NLRB Stats Archive › Annual Reports › FY1964 › Distribution of Unfair Labor Practice Situations Received, by Number of Employees in Establishment, Fiscal Year 1964
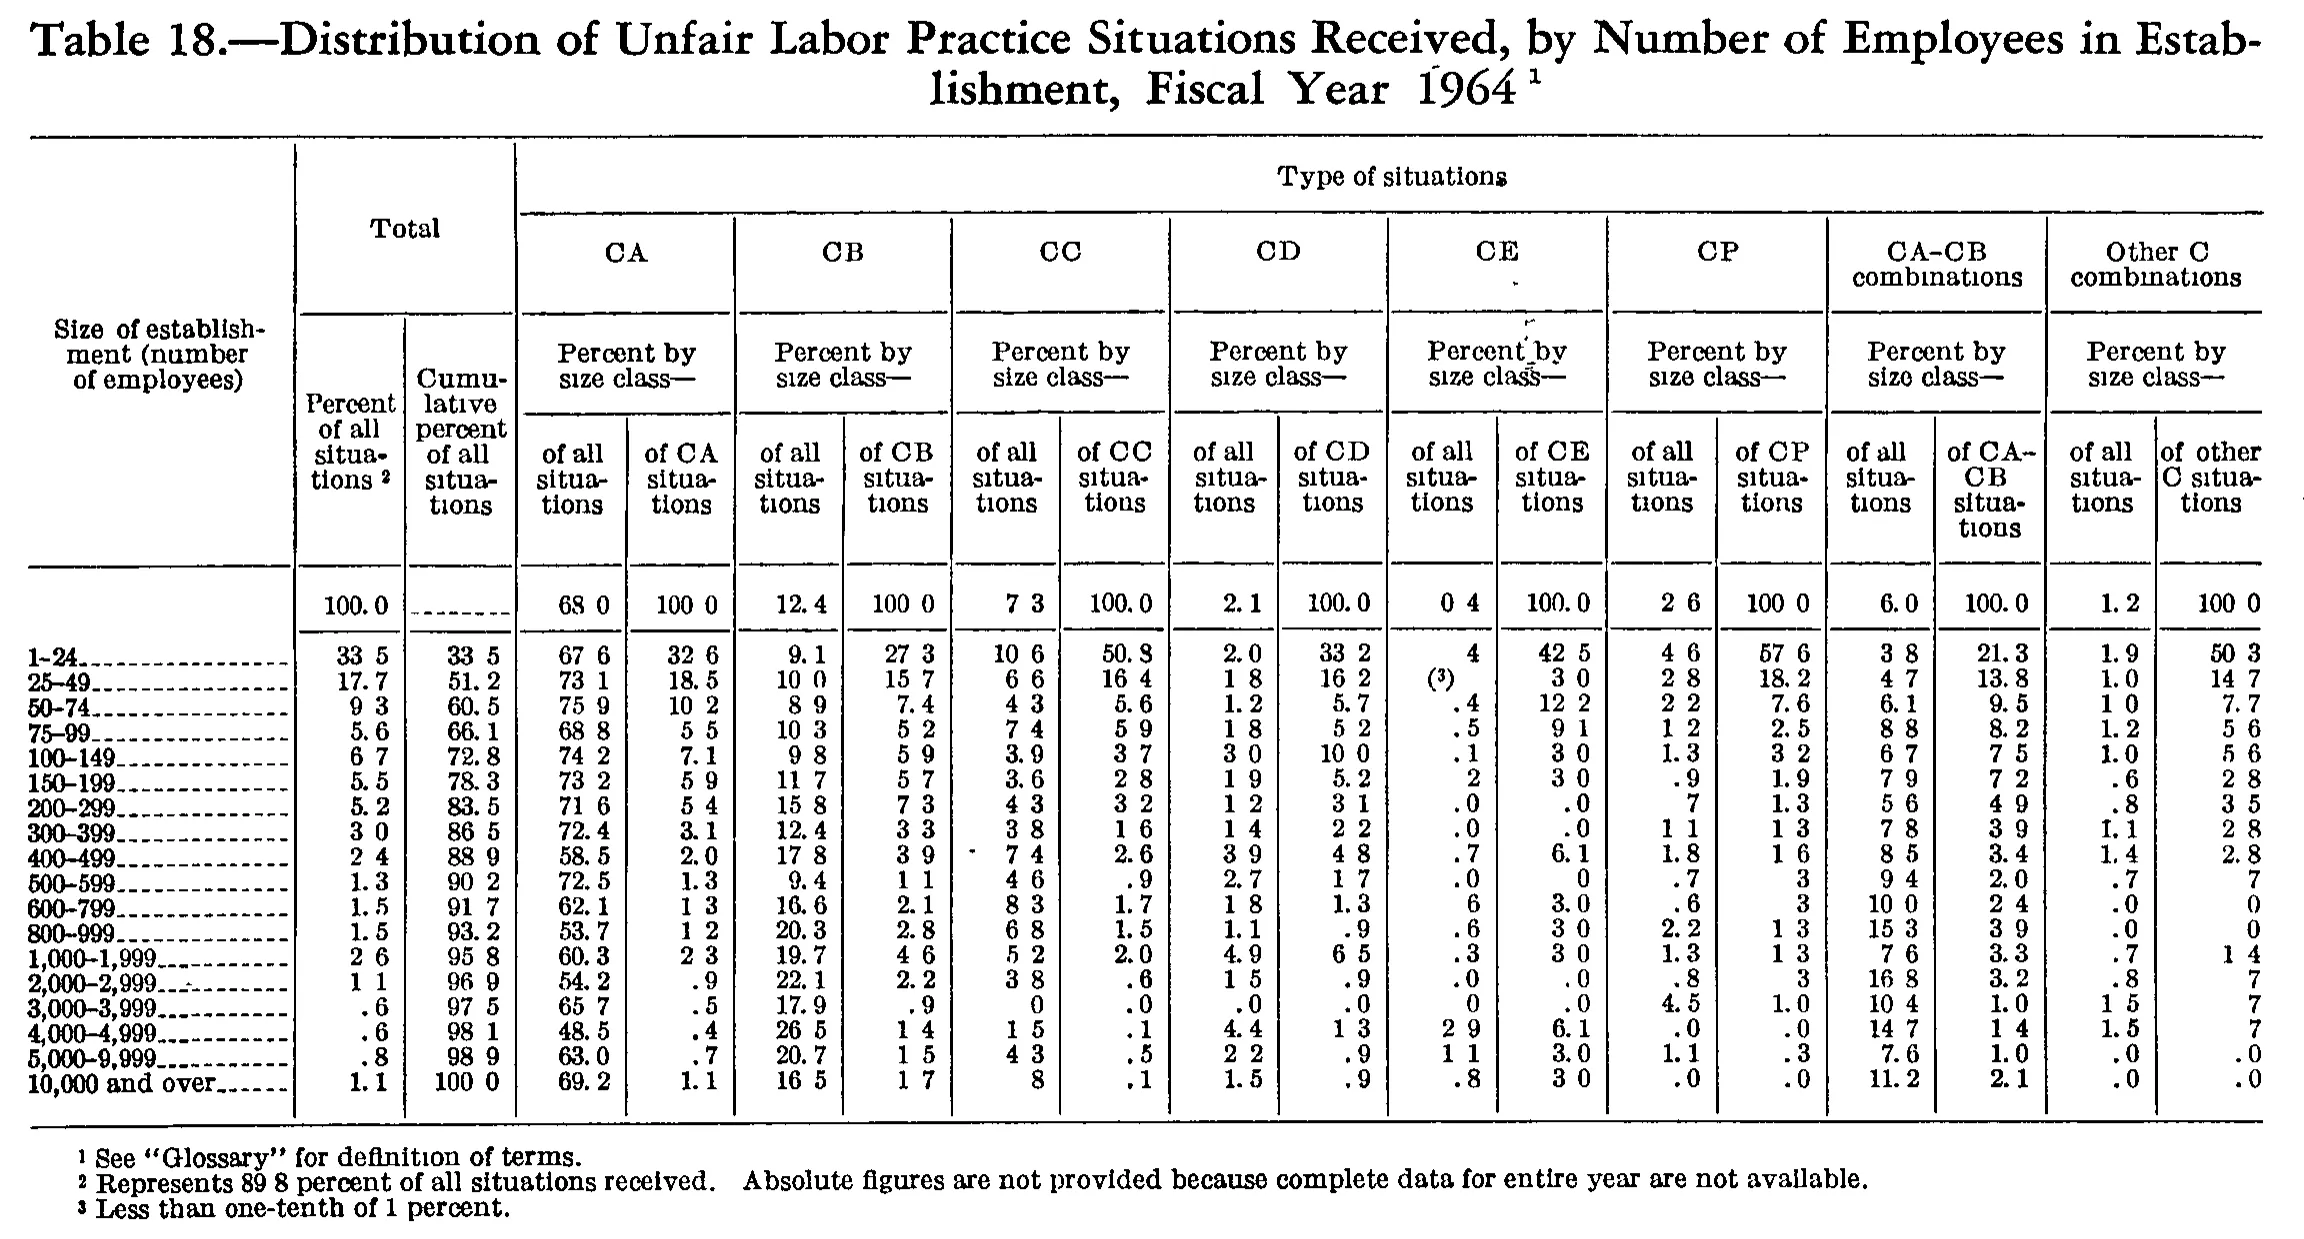
Distribution of Unfair Labor Practice Situations Received, by Number of Employees in Establishment, Fiscal Year 1964
| Size of establishment (number of employees) | Total | Type of situations | ||||||||||||||||
|---|---|---|---|---|---|---|---|---|---|---|---|---|---|---|---|---|---|---|
| Size of establishment (number of employees) | Total | CA | CB | CC | CD | CE | CP | CA-CB combinations | Other C combinations | |||||||||
| Size of establishment (number of employees) | Percent of all situations | Cumulative percent of all situations | Percent by size class— | Percent by size class— | Percent by size class— | Percent by size class— | Percent by size class— | Percent by size class— | Percent by size class— | Percent by size class— | ||||||||
| Size of establishment (number of employees) | Percent of all situations | Cumulative percent of all situations | of all situations | of CA situations | of all situations | of CB situations | of all situations | of CC situations | of all situations | of CD situations | of all situations | of CE situations | of all situations | of CP situations | of all situations | of CA-CB situations | of all situations | of other C situations |
| 100.0 | 68.0 | 100.0 | 12.4 | 100.0 | 7.3 | 100.0 | 2.1 | 100.0 | 0.4 | 100.0 | 2.6 | 100.0 | 6.0 | 100.0 | 1.2 | 100.0 | ||
| 1-24 | 33.5 | 33.5 | 67.6 | 32.6 | 9.1 | 27.3 | 10.6 | 50.8 | 2.0 | 33.2 | .4 | 42.5 | 4.6 | 57.6 | 3.8 | 21.3 | 1.9 | 50.3 |
| 25-49 | 17.7 | 51.2 | 73.1 | 18.5 | 10.0 | 15.7 | 6.6 | 16.4 | 1.8 | 16.2 | [3] | 3.0 | 2.8 | 18.2 | 4.7 | 13.8 | 1.0 | 14.7 |
| 50-74 | 9.3 | 60.5 | 75.9 | 10.2 | 8.9 | 7.4 | 4.3 | 5.6 | 1.2 | 5.7 | .4 | 12.2 | 2.2 | 7.6 | 6.1 | 9.5 | 1.0 | 7.7 |
| 75-99 | 5.6 | 66.1 | 68.8 | 5.5 | 10.3 | 5.2 | 7.4 | 5.9 | 1.8 | 5.2 | .5 | 9.1 | 1.2 | 2.5 | 8.8 | 8.2 | 1.2 | 5.6 |
| 100-149 | 6.7 | 72.8 | 74.2 | 7.1 | 9.8 | 5.9 | 3.9 | 3.7 | 3.0 | 10.0 | .1 | 3.0 | 1.3 | 3.2 | 6.7 | 7.5 | 1.0 | 5.6 |
| 150-199 | 5.5 | 78.3 | 73.2 | 5.9 | 11.7 | 5.7 | 3.6 | 2.8 | 1.9 | 5.2 | .2 | 3.0 | .9 | 1.9 | 7.9 | 7.2 | .6 | 2.8 |
| 200-299 | 5.2 | 83.5 | 71.6 | 5.4 | 15.8 | 7.3 | 4.3 | 3.2 | 1.2 | 3.1 | .0 | .0 | .7 | 1.3 | 5.6 | 4.9 | .8 | 3.5 |
| 300-399 | 3.0 | 86.5 | 72.4 | 3.1 | 12.4 | 3.3 | 3.8 | 1.6 | 1.4 | 2.2 | .0 | .0 | 1.1 | 1.3 | 7.8 | 3.9 | 1.1 | 2.8 |
| 400-499 | 2.4 | 88.9 | 58.5 | 2.0 | 17.8 | 3.9 | 7.4 | 2.6 | 3.9 | 4.8 | .7 | 6.1 | 1.8 | 1.6 | 8.5 | 3.4 | 1.4 | 2.8 |
| 500-599 | 1.3 | 90.2 | 72.5 | 1.3 | 9.4 | 1.1 | 4.6 | .9 | 2.7 | 1.7 | .0 | .0 | .7 | .3 | 9.4 | 2.0 | .7 | .7 |
| 600-799 | 1.5 | 91.7 | 62.1 | 1.3 | 16.6 | 2.1 | 8.3 | 1.7 | 1.8 | 1.3 | .6 | 3.0 | .6 | .3 | 10.0 | 2.4 | .0 | .0 |
| 800-999 | 1.5 | 93.2 | 53.7 | 1.2 | 20.3 | 2.8 | 6.8 | 1.5 | 1.1 | .9 | .6 | 3.0 | 2.2 | 1.3 | 15.3 | 3.9 | .0 | .0 |
| 1,000-1,999 | 2.6 | 95.8 | 60.3 | 2.3 | 19.7 | 4.6 | 5.2 | 2.0 | 4.9 | 6.5 | .3 | 3.0 | 1.3 | 1.3 | 7.6 | 3.3 | .7 | 1.4 |
| 2,000-2,999 | 1.1 | 96.9 | 54.2 | .9 | 22.1 | 2.2 | 3.8 | .6 | 1.5 | .9 | .0 | .0 | .8 | .3 | 16.8 | 3.2 | .8 | .7 |
| 3,000-3,999 | .6 | 97.5 | 65.7 | .5 | 17.9 | .9 | .0 | .0 | .0 | .0 | .0 | .0 | 4.5 | 1.0 | 10.4 | 1.0 | 1.5 | 3.7 |
| 4,000-4,999 | .6 | 98.1 | 48.5 | .4 | 26.5 | 1.4 | 1.5 | .1 | 4.4 | 1.3 | 2.9 | 6.1 | .0 | .0 | 14.7 | 1.4 | 1.5 | .7 |
| 5,000-9,999 | .8 | 98.9 | 63.0 | .7 | 20.7 | 1.5 | 4.3 | .5 | 2.2 | .9 | 1.1 | 3.0 | 1.1 | .3 | 7.6 | 1.0 | .0 | .0 |
| 10,000 and over | 1.1 | 100.0 | 69.2 | 1.1 | 16.5 | 1.7 | .8 | .1 | 1.5 | .9 | .8 | 3.0 | .0 | .0 | 11.2 | 2.1 | .0 | .0 |
- 1 See "Glossary" for definition of terms.
- 2 Represents 89.8 percent of all situations received. Absolute figures are not provided because complete data for entire year are not available.
- 3 Less than one-tenth of 1 percent.
Reader’s notes
p. 213. 19 columns: stub, 2 under "Total", and 16 under "Type of situations" (two per situation type: "of all situations" and "of <type> situations"). Decimal points: this is a 1-bit scan in which many printed periods dropped out, so a great many cells image as e.g. "33 5", "68 0", "100 0" or a bare "4"/"7"/"0". Every value in the table is a percentage carried to one decimal place, so I have restored the decimal point in each such cell (".4", "33.5", "100.0"). No digits were changed. This reconstruction is corroborated by arithmetic: the eight "of all situations" columns sum to exactly 100.0 in every one of the 18 size-class rows; each of the eight "of <type> situations" columns sums to exactly 100.0 down the column; and the "Cumulative percent" column reproduces exactly as the running sum of the "Percent of all situations" column (33.5 ... 100.0). Sole cell failing those checks: row "3,000-3,999", last column ("Other C combinations" / "of other C situations"). It images as two characters, which I read as 3.7. Both the row relation (0.6 percent of all situations x 1.5 percent Other C, against a 1.2 percent Other C total, implies roughly 0.7-0.8) and the column total (the column sums to 102.3 with 3.7, but to exactly 100.0 with .7) indicate the intended value is .7. Transcribed as printed; treat as a probable misprint in the source, or less likely a misread of a blotted ".7". First body row is unlabeled (the all-sizes total line); its stub is blank as printed. Its "Cumulative percent" cell holds only a dash rule and is therefore "". Row "25-49", "CE" / "of all situations" holds the parenthesized footnote reference "(3)" in place of a value (footnote 3: less than one-tenth of 1 percent), not a number. Minor scan artifacts, not transcribed into cells: the "CA-CB combinations" column's spanner images as "Percent by sizo class-" (broken "size"); a stray dash sits to the left of "7.4" in row "400-499", "CC" / "of all situations"; the "1.1" in row "300-399", "Other C combinations" / "of all situations" images with a damaged leading 1. Footnote 2 reads "89 8 percent" in the scan; rendered as "89.8 percent". The stub heading and several column headings are hyphen-broken across lines in the original ("Size of establish-ment", "Cumu-lative", "situa-tions", "of CA-CB situations"); joined and repaired.
Source image
Source data: U.S. NLRB Annual Reports (public domain). Reconstruction by NLRB Stats Archive. Read by claude-opus-5 (effort max, prompt extract_v1) from the 300-dpi scan; stitched by page. Updated October 2026.