NLRB Stats Archive › Annual Reports › FY1964 › Size of Units in Representation Elections Held in Cases Closed, Fiscal Year 1964
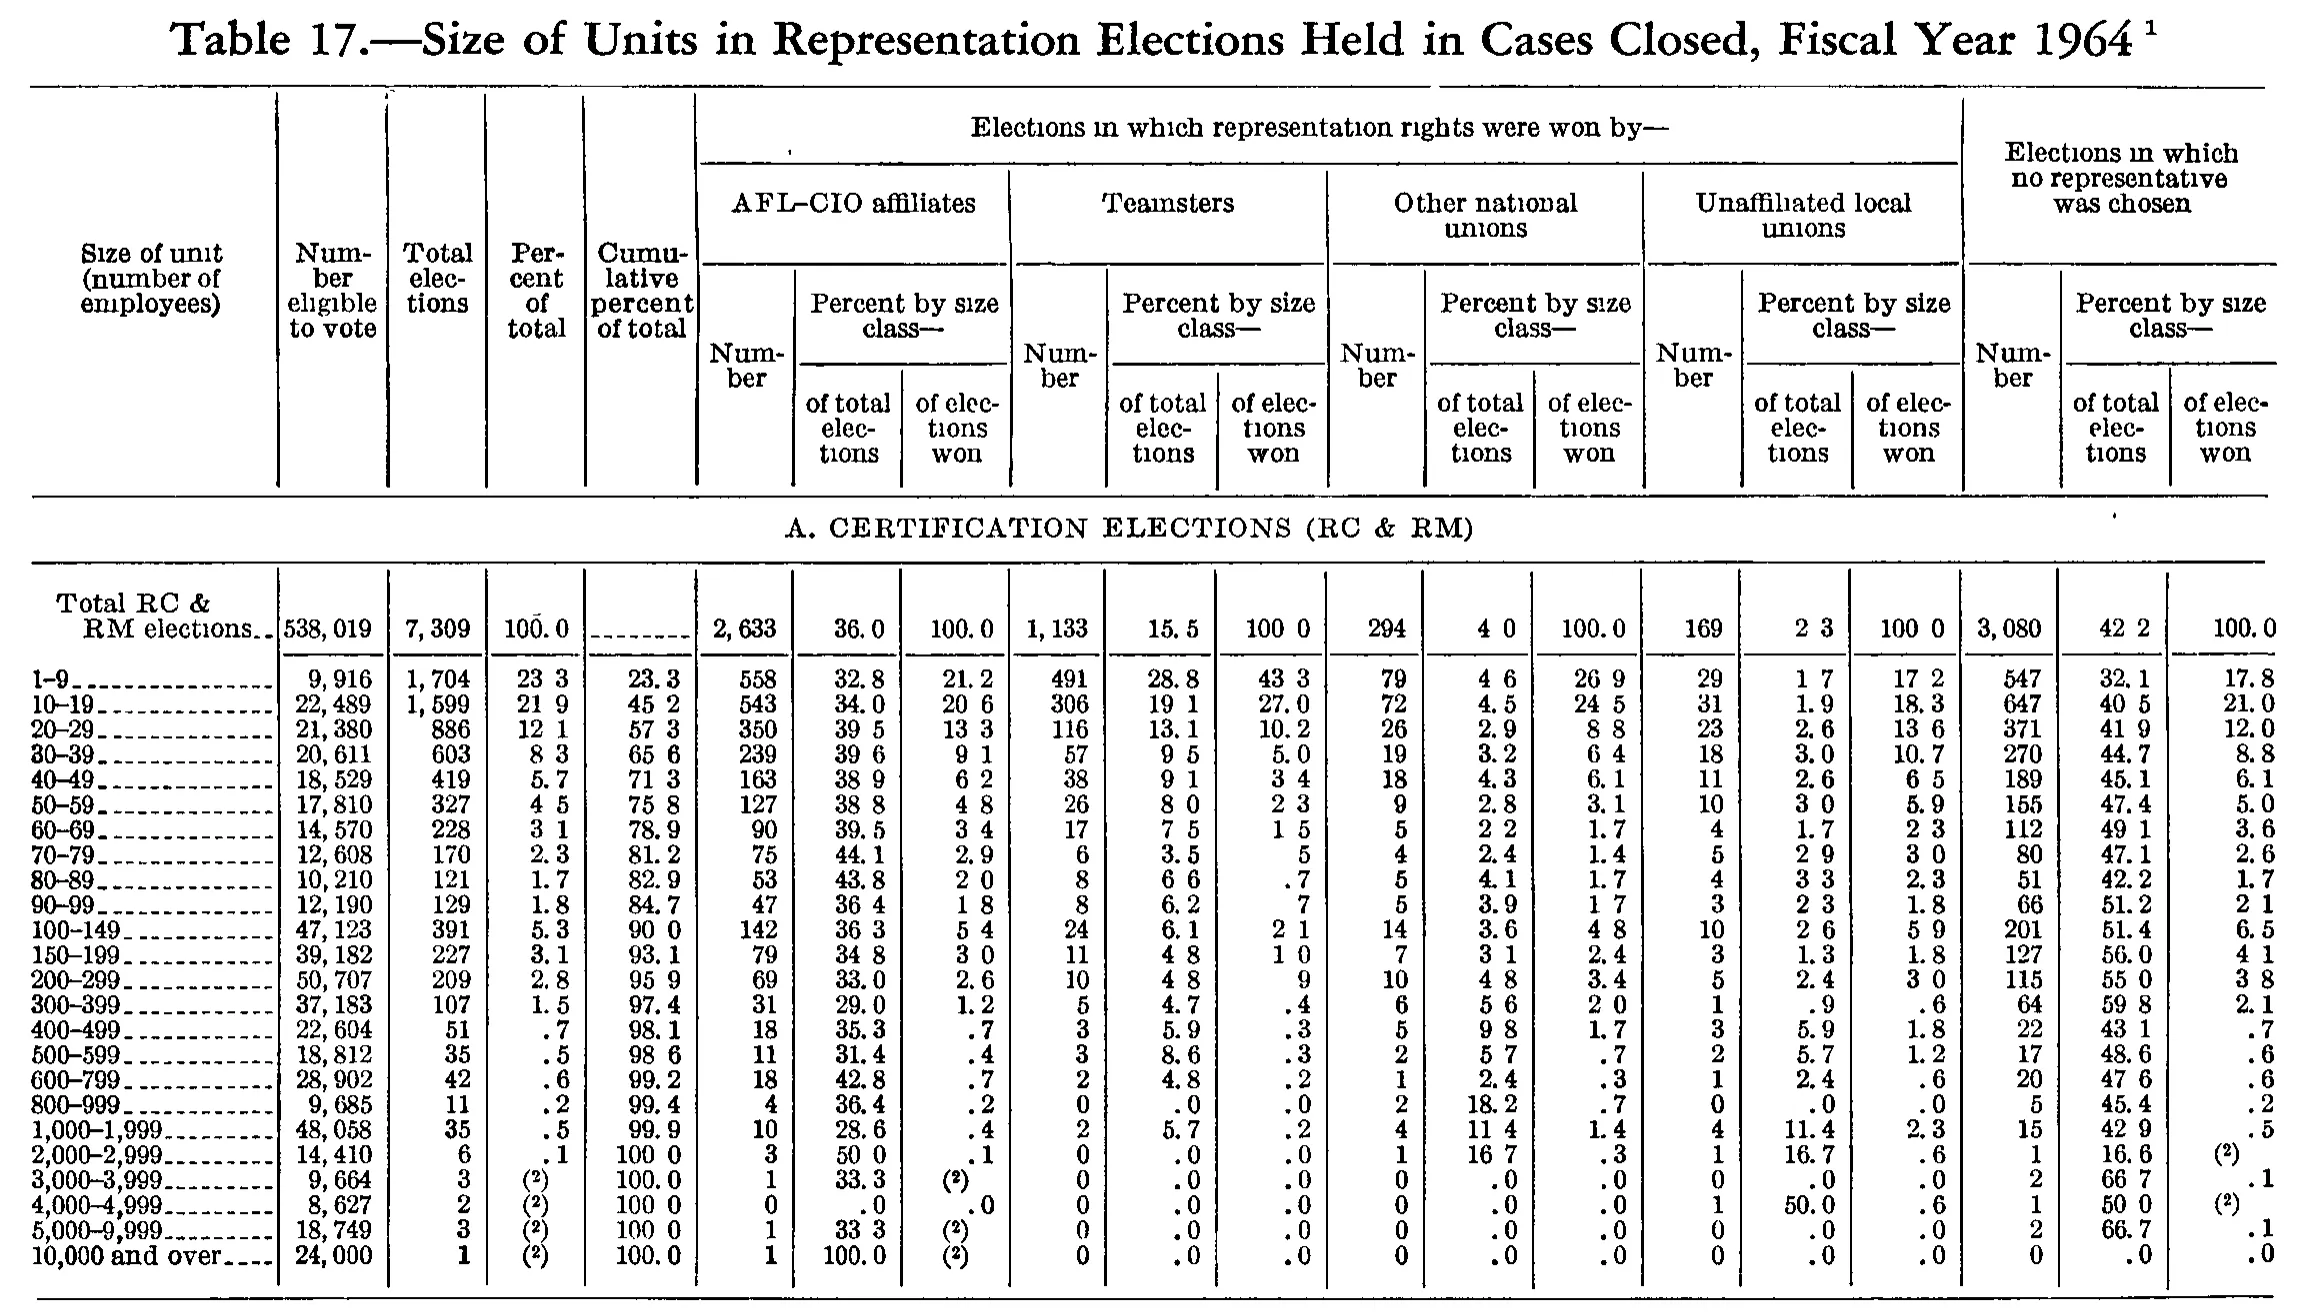
Size of Units in Representation Elections Held in Cases Closed, Fiscal Year 1964
Stitched from pp. 211–212.
| Size of unit (number of employees) | Number eligible to vote | Total elections | Percent of total | Cumulative percent of total | Elections in which representation rights were won by— | Elections in which no representative was chosen | |||||||||||||
|---|---|---|---|---|---|---|---|---|---|---|---|---|---|---|---|---|---|---|---|
| Size of unit (number of employees) | Number eligible to vote | Total elections | Percent of total | Cumulative percent of total | AFL-CIO affiliates | Teamsters | Other national unions | Unaffiliated local unions | Elections in which no representative was chosen | ||||||||||
| Size of unit (number of employees) | Number eligible to vote | Total elections | Percent of total | Cumulative percent of total | Number | Percent by size class— | Number | Percent by size class— | Number | Percent by size class— | Number | Percent by size class— | Number | Percent by size class— | |||||
| Size of unit (number of employees) | Number eligible to vote | Total elections | Percent of total | Cumulative percent of total | Number | of total elections | of elections won | Number | of total elections | of elections won | Number | of total elections | of elections won | Number | of total elections | of elections won | Number | of total elections | of elections won |
| A. CERTIFICATION ELECTIONS (RC & RM) | |||||||||||||||||||
| Total RC & RM elections | 538,019 | 7,309 | 100.0 | 2,633 | 36.0 | 100.0 | 1,133 | 15.5 | 100.0 | 294 | 4.0 | 100.0 | 169 | 2.3 | 100.0 | 3,080 | 42.2 | 100.0 | |
| 1-9 | 9,916 | 1,704 | 23.3 | 23.3 | 558 | 32.8 | 21.2 | 491 | 28.8 | 43.3 | 79 | 4.6 | 26.9 | 29 | 1.7 | 17.2 | 547 | 32.1 | 17.8 |
| 10-19 | 22,489 | 1,599 | 21.9 | 45.2 | 543 | 34.0 | 20.6 | 306 | 19.1 | 27.0 | 72 | 4.5 | 24.5 | 31 | 1.9 | 18.3 | 647 | 40.5 | 21.0 |
| 20-29 | 21,380 | 886 | 12.1 | 57.3 | 350 | 39.5 | 13.3 | 116 | 13.1 | 10.2 | 26 | 2.9 | 8.8 | 23 | 2.6 | 13.6 | 371 | 41.9 | 12.0 |
| 30-39 | 20,611 | 603 | 8.3 | 65.6 | 239 | 39.6 | 9.1 | 57 | 9.5 | 5.0 | 19 | 3.2 | 6.4 | 18 | 3.0 | 10.7 | 270 | 44.7 | 8.8 |
| 40-49 | 18,529 | 419 | 5.7 | 71.3 | 163 | 38.9 | 6.2 | 38 | 9.1 | 3.4 | 18 | 4.3 | 6.1 | 11 | 2.6 | 6.5 | 189 | 45.1 | 6.1 |
| 50-59 | 17,810 | 327 | 4.5 | 75.8 | 127 | 38.8 | 4.8 | 26 | 8.0 | 2.3 | 9 | 2.8 | 3.1 | 10 | 3.0 | 5.9 | 155 | 47.4 | 5.0 |
| 60-69 | 14,570 | 228 | 3.1 | 78.9 | 90 | 39.5 | 3.4 | 17 | 7.5 | 1.5 | 5 | 2.2 | 1.7 | 4 | 1.7 | 2.3 | 112 | 49.1 | 3.6 |
| 70-79 | 12,608 | 170 | 2.3 | 81.2 | 75 | 44.1 | 2.9 | 6 | 3.5 | .5 | 4 | 2.4 | 1.4 | 5 | 2.9 | 3.0 | 80 | 47.1 | 2.6 |
| 80-89 | 10,210 | 121 | 1.7 | 82.9 | 53 | 43.8 | 2.0 | 8 | 6.6 | .7 | 5 | 4.1 | 1.7 | 4 | 3.3 | 2.3 | 51 | 42.2 | 1.7 |
| 90-99 | 12,190 | 129 | 1.8 | 84.7 | 47 | 36.4 | 1.8 | 8 | 6.2 | .7 | 5 | 3.9 | 1.7 | 3 | 2.3 | 1.8 | 66 | 51.2 | 2.1 |
| 100-149 | 47,123 | 391 | 5.3 | 90.0 | 142 | 36.3 | 5.4 | 24 | 6.1 | 2.1 | 14 | 3.6 | 4.8 | 10 | 2.6 | 5.9 | 201 | 51.4 | 6.5 |
| 150-199 | 39,182 | 227 | 3.1 | 93.1 | 79 | 34.8 | 3.0 | 11 | 4.8 | 1.0 | 7 | 3.1 | 2.4 | 3 | 1.3 | 1.8 | 127 | 56.0 | 4.1 |
| 200-299 | 50,707 | 209 | 2.8 | 95.9 | 69 | 33.0 | 2.6 | 10 | 4.8 | .9 | 10 | 4.8 | 3.4 | 5 | 2.4 | 3.0 | 115 | 55.0 | 3.8 |
| 300-399 | 37,183 | 107 | 1.5 | 97.4 | 31 | 29.0 | 1.2 | 5 | 4.7 | .4 | 6 | 5.6 | 2.0 | 1 | .9 | .6 | 64 | 59.8 | 2.1 |
| 400-499 | 22,604 | 51 | .7 | 98.1 | 18 | 35.3 | .7 | 3 | 5.9 | .3 | 5 | 9.8 | 1.7 | 3 | 5.9 | 1.8 | 22 | 43.1 | .7 |
| 500-599 | 18,812 | 35 | .5 | 98.6 | 11 | 31.4 | .4 | 3 | 8.6 | .3 | 2 | 5.7 | .7 | 2 | 5.7 | 1.2 | 17 | 48.6 | .6 |
| 600-799 | 28,902 | 42 | .6 | 99.2 | 18 | 42.8 | .7 | 2 | 4.8 | .2 | 1 | 2.4 | .3 | 1 | 2.4 | .6 | 20 | 47.6 | .6 |
| 800-999 | 9,685 | 11 | .2 | 99.4 | 4 | 36.4 | .2 | 0 | .0 | .0 | 2 | 18.2 | .7 | 0 | .0 | .0 | 5 | 45.4 | .2 |
| 1,000-1,999 | 48,058 | 35 | .5 | 99.9 | 10 | 28.6 | .4 | 2 | 5.7 | .2 | 4 | 11.4 | 1.4 | 4 | 11.4 | 2.3 | 15 | 42.9 | .5 |
| 2,000-2,999 | 14,410 | 6 | .1 | 100.0 | 3 | 50.0 | .1 | 0 | .0 | .0 | 1 | 16.7 | .3 | 1 | 16.7 | .6 | 1 | 16.6 | [2] |
| 3,000-3,999 | 9,664 | 3 | [2] | 100.0 | 1 | 33.3 | [2] | 0 | .0 | .0 | 0 | .0 | .0 | 0 | .0 | .0 | 2 | 66.7 | .1 |
| 4,000-4,999 | 8,627 | 2 | [2] | 100.0 | 0 | .0 | .0 | 0 | .0 | .0 | 0 | .0 | .0 | 1 | 50.0 | .6 | 1 | 50.0 | [2] |
| 5,000-9,999 | 18,749 | 3 | [2] | 100.0 | 1 | 33.3 | [2] | 0 | .0 | .0 | 0 | .0 | .0 | 0 | .0 | .0 | 2 | 66.7 | .1 |
| 10,000 and over | 24,000 | 1 | [2] | 100.0 | 1 | 100.0 | [2] | 0 | .0 | .0 | 0 | .0 | .0 | 0 | .0 | .0 | 0 | .0 | .0 |
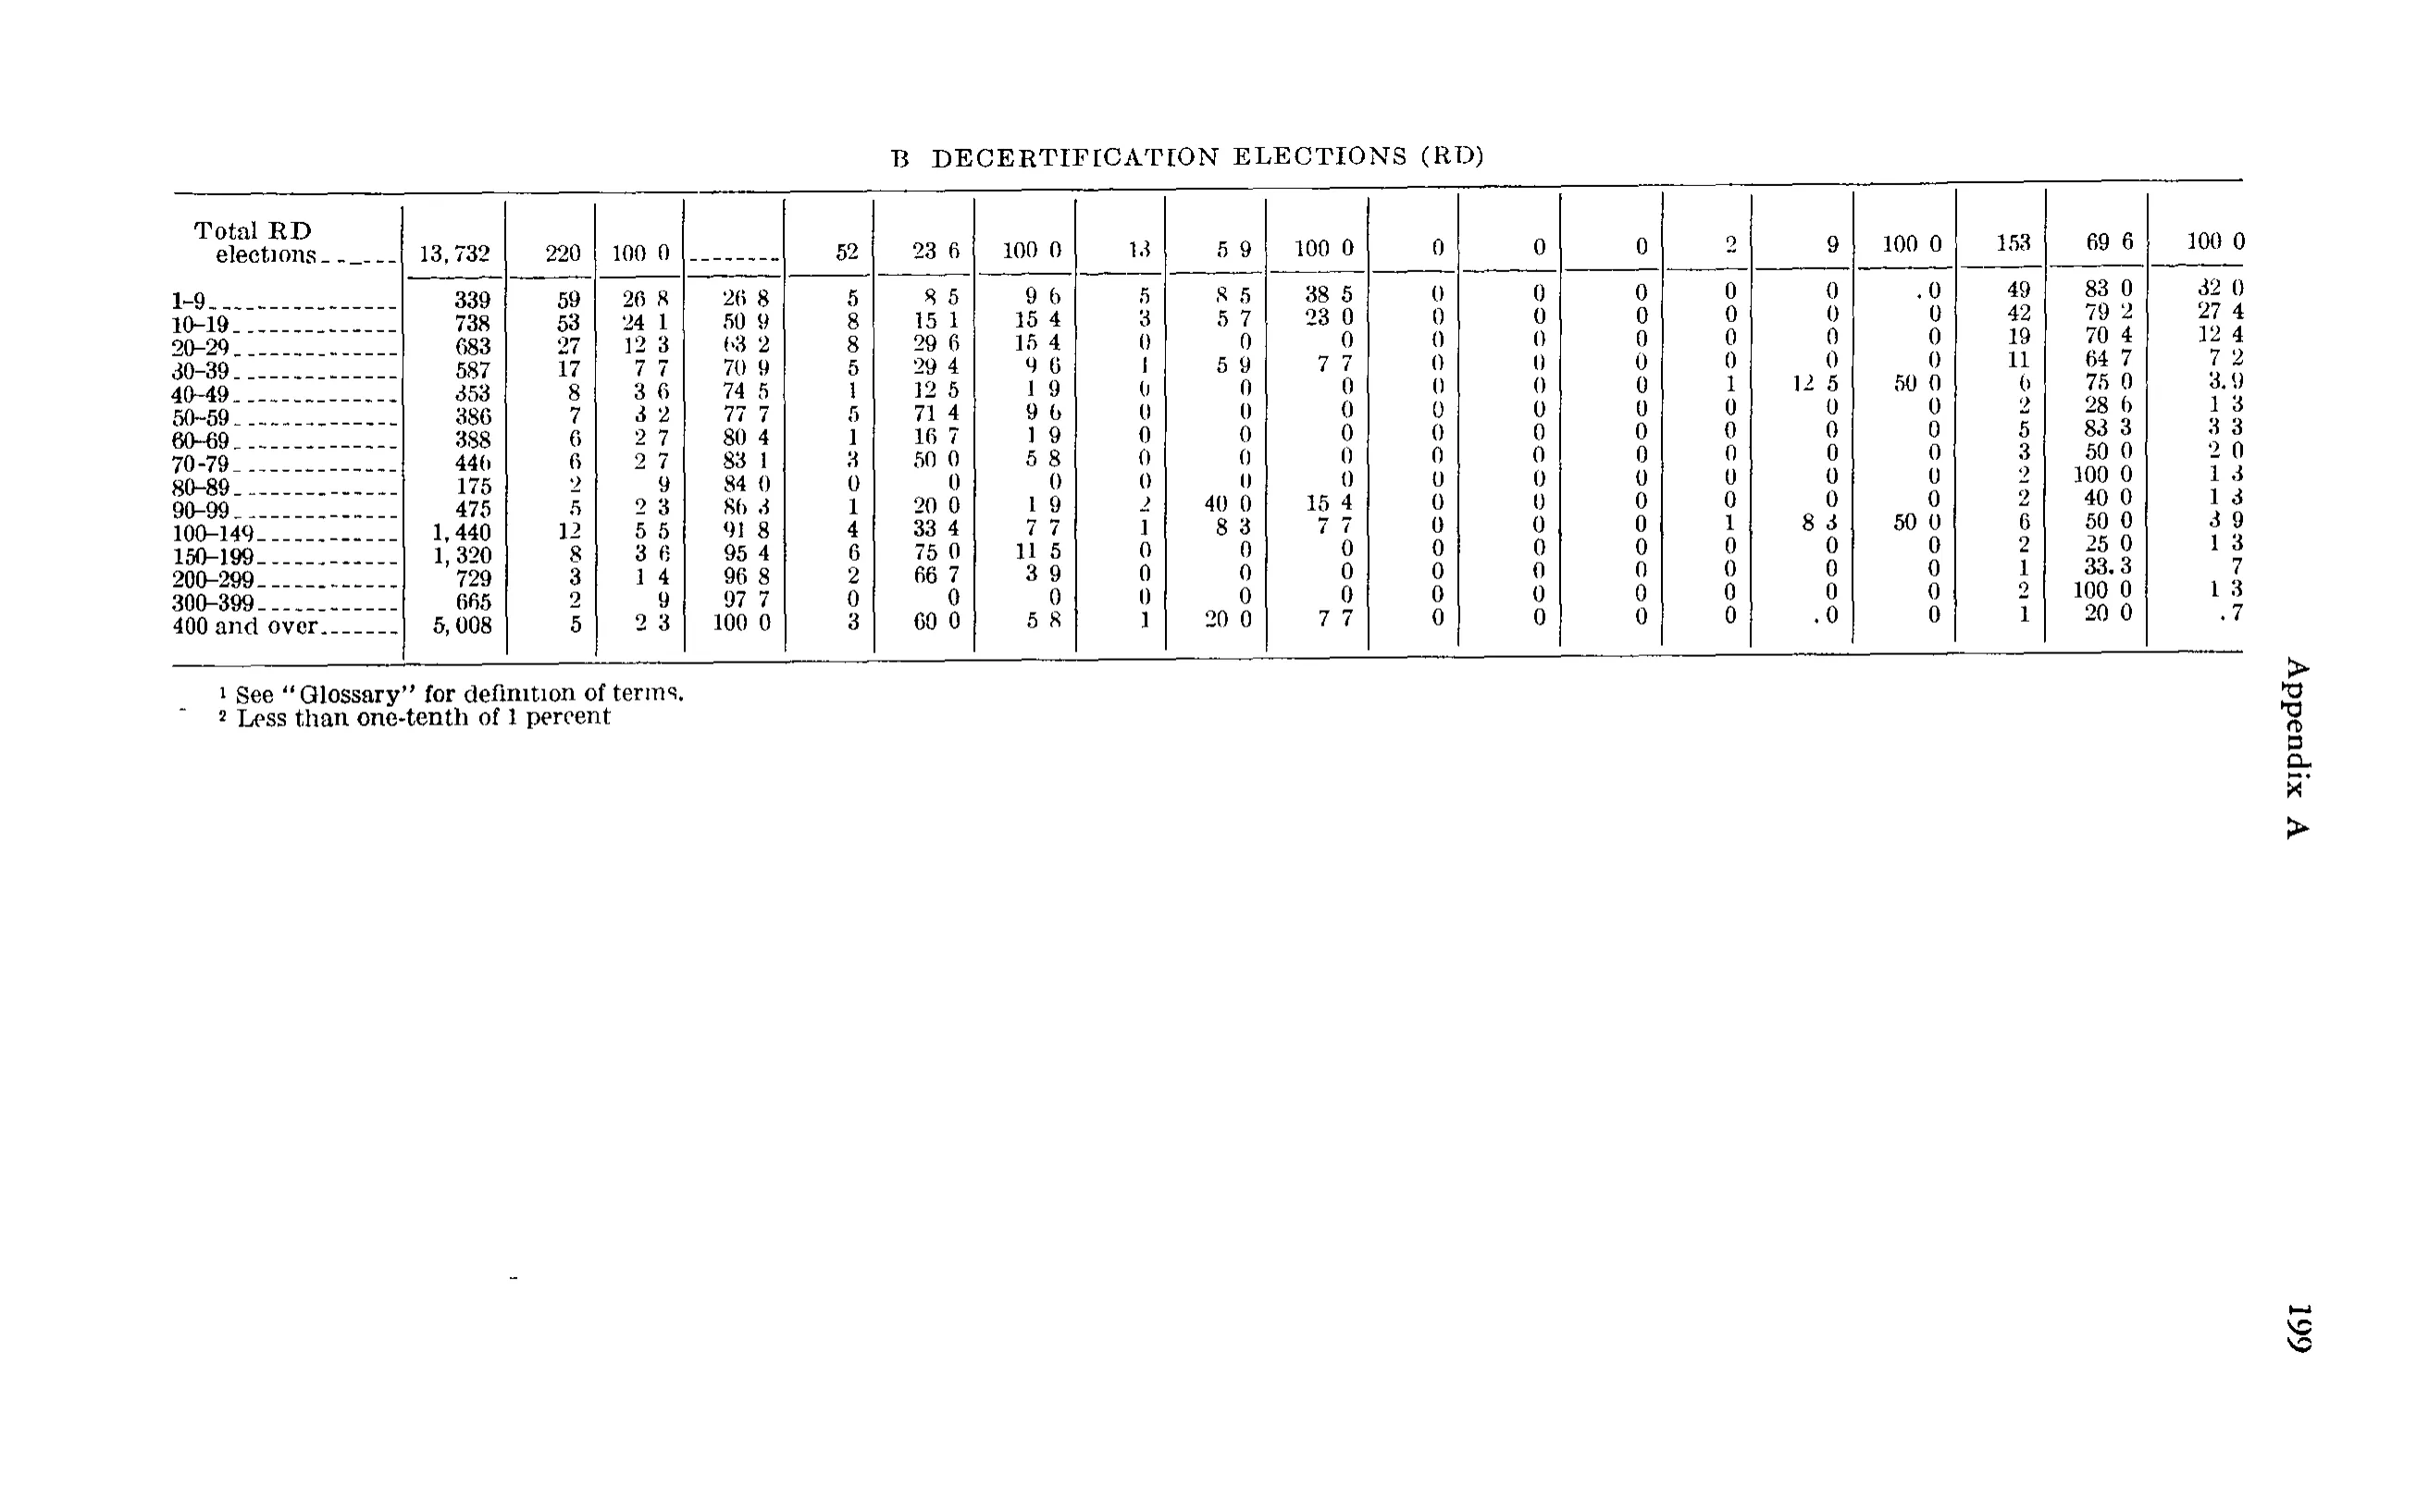
| B DECERTIFICATION ELECTIONS (RD) | |||||||||||||||||||
| Total RD elections | 13,732 | 220 | 100.0 | 52 | 23.6 | 100.0 | 13 | 5.9 | 100.0 | 0 | 0 | 0 | 2 | .9 | 100.0 | 153 | 69.6 | 100.0 | |
| 1-9 | 339 | 59 | 26.8 | 26.8 | 5 | 8.5 | 9.6 | 5 | 8.5 | 38.5 | 0 | 0 | 0 | 0 | 0 | 0 | 49 | 83.0 | 32.0 |
| 10-19 | 738 | 53 | 24.1 | 50.9 | 8 | 15.1 | 15.4 | 3 | 5.7 | 23.0 | 0 | 0 | 0 | 0 | 0 | 0 | 42 | 79.2 | 27.4 |
| 20-29 | 683 | 27 | 12.3 | 63.2 | 8 | 29.6 | 15.4 | 0 | 0 | 0 | 0 | 0 | 0 | 0 | 0 | 0 | 19 | 70.4 | 12.4 |
| 30-39 | 587 | 17 | 7.7 | 70.9 | 5 | 29.4 | 9.6 | 1 | 5.9 | 7.7 | 0 | 0 | 0 | 0 | 0 | 0 | 11 | 64.7 | 7.2 |
| 40-49 | 353 | 8 | 3.6 | 74.5 | 1 | 12.5 | 1.9 | 0 | 0 | 0 | 0 | 0 | 0 | 1 | 12.5 | 50.0 | 6 | 75.0 | 3.9 |
| 50-59 | 386 | 7 | 3.2 | 77.7 | 5 | 71.4 | 9.6 | 0 | 0 | 0 | 0 | 0 | 0 | 0 | 0 | 0 | 2 | 28.6 | 1.3 |
| 60-69 | 388 | 6 | 2.7 | 80.4 | 1 | 16.7 | 1.9 | 0 | 0 | 0 | 0 | 0 | 0 | 0 | 0 | 0 | 5 | 83.3 | 3.3 |
| 70-79 | 446 | 6 | 2.7 | 83.1 | 3 | 50.0 | 5.8 | 0 | 0 | 0 | 0 | 0 | 0 | 0 | 0 | 0 | 3 | 50.0 | 2.0 |
| 80-89 | 175 | 2 | .9 | 84.0 | 0 | 0 | 0 | 0 | 0 | 0 | 0 | 0 | 0 | 0 | 0 | 0 | 2 | 100.0 | 1.3 |
| 90-99 | 475 | 5 | 2.3 | 86.3 | 1 | 20.0 | 1.9 | 2 | 40.0 | 15.4 | 0 | 0 | 0 | 0 | 0 | 0 | 2 | 40.0 | 1.3 |
| 100-149 | 1,440 | 12 | 5.5 | 91.8 | 4 | 33.4 | 7.7 | 1 | 8.3 | 7.7 | 0 | 0 | 0 | 1 | 8.3 | 50.0 | 6 | 50.0 | 3.9 |
| 150-199 | 1,320 | 8 | 3.6 | 95.4 | 6 | 75.0 | 11.5 | 0 | 0 | 0 | 0 | 0 | 0 | 0 | 0 | 0 | 2 | 25.0 | 1.3 |
| 200-299 | 729 | 3 | 1.4 | 96.8 | 2 | 66.7 | 3.9 | 0 | 0 | 0 | 0 | 0 | 0 | 0 | 0 | 0 | 1 | 33.3 | .7 |
| 300-399 | 665 | 2 | .9 | 97.7 | 0 | 0 | 0 | 0 | 0 | 0 | 0 | 0 | 0 | 0 | 0 | 0 | 2 | 100.0 | 1.3 |
| 400 and over | 5,008 | 5 | 2.3 | 100.0 | 3 | 60.0 | 5.8 | 1 | 20.0 | 7.7 | 0 | 0 | 0 | 0 | 0 | 0 | 1 | 20.0 | .7 |
- 1 See "Glossary" for definition of terms.
- 2 Less than one-tenth of 1 percent
231 of 231 figures sit in a row or column sum that works out.
Reader’s notes
p. 211. Crop scope: this image shows only the column-heading block and Panel A ("A. CERTIFICATION ELECTIONS (RC & RM)") of Table 17. Panel B and the footnote block are below the crop, so `footnotes` is empty even though the caption carries a marker 1 and the body cells reference a footnote 2. Decimal points: in this scan a great many one-decimal percentages print with a faint or dropped decimal point, so they appear as e.g. "100 0", "42 2", "23 3", "4 0", "2 3". Every such cell is a percent carried to one decimal, and I transcribed the decimal point in each. This is corroborated arithmetically: in every data row the five "of total elections" percents sum to exactly 100.0, each "of elections won" column sums down to 100.0, and the "Cumulative percent of total" column is the exact running sum of "Percent of total". "(2)" cells: in the "Percent of total" and three "of elections won" columns, several cells hold a raised parenthesized 2 standing in place of a value (the usual "less than 0.05 percent" convention) rather than a number attached to a marker. I transcribed these as "(2)". They are consistent with the underlying counts (e.g. 3 of 7,309 = 0.04 percent). "Cumulative percent of total" in the "Total RC & RM elections" row is a dash rule, transcribed as "". Column alignment was verified independently: each of the five component "Number" columns sums down to its printed total (2,633 / 1,133 / 294 / 169 / 3,080), those five totals sum to 7,309, and each data row's five Numbers sum to that row's "Total elections". No misprints detected.
p. 212. No column headings are printed on this crop — it continues a table whose headings stand on the preceding page — so header_rows is empty. The grid is 20 columns: stub + a 4-column first group (employees eligible; number of elections; percent; cumulative percent) followed by five 3-column groups (count; percent of the size class; percent of that group's total). The first group's cumulative-percent cell on the "Total RD elections" line is a dash rule and is given as "". Decimal points: this is a 1-bit scan in which most periods inside numbers have dropped out, so percentages print as e.g. "26 8", "100 0". The commas in "13, 732", "1, 440", "5, 008" survive, and a few periods do survive ("33.3" at 200-299, "3.9" at 40-49), confirming the points are present in the original. I have restored them, i.e. "26 8" is transcribed "26.8". Values printed without a leading zero (".9", ".7") are kept that way. Doubtful cell: row "100-149", column 6 (percent of the size class in the first 3-column group) reads "33 4" to me, i.e. 33.4, but 4 of 12 is 33.3, and the corresponding cell at row "200-299" column 18 is printed "33.3". This is either a printer's error or a misread of a damaged "3"; it is the one cell in the table that fails the arithmetic cross-check. Transcribed as read. Stray marks: a faint dot precedes the 0 at row "1-9" column 16 and at row "400 and over" column 15. Since every other zero in the table is set as a bare "0" and both cells are 0 of 2 and 0 of 5 respectively, I read these as scan specks and transcribed "0". Footnote marker 2 ("Less than one-tenth of 1 percent") is not attached to any value in this panel; it presumably marks a cell in panel A on the previous page. The section line is printed "B DECERTIFICATION ELECTIONS (RD)" above the table's top rule; a period after the "B" may have been lost with the other periods, but none is visible, so it is transcribed without one. Arithmetic checks that do pass: column 1 sums to 13,732; column 2 to 220; the five category counts sum to 220 (52 + 13 + 0 + 2 + 153) and to each size class's election total row by row; the cumulative-percent column accumulates correctly to 100.0; and all remaining percentages reproduce from the counts.
Source image
Source data: U.S. NLRB Annual Reports (public domain). Reconstruction by NLRB Stats Archive. Read by claude-opus-5 (effort max, prompt extract_v1) from the 300-dpi scan; stitched by page. Updated October 2026.