NLRB Stats Archive › Annual Reports › FY1964 › Geographic distribution of representation elections — by division and State
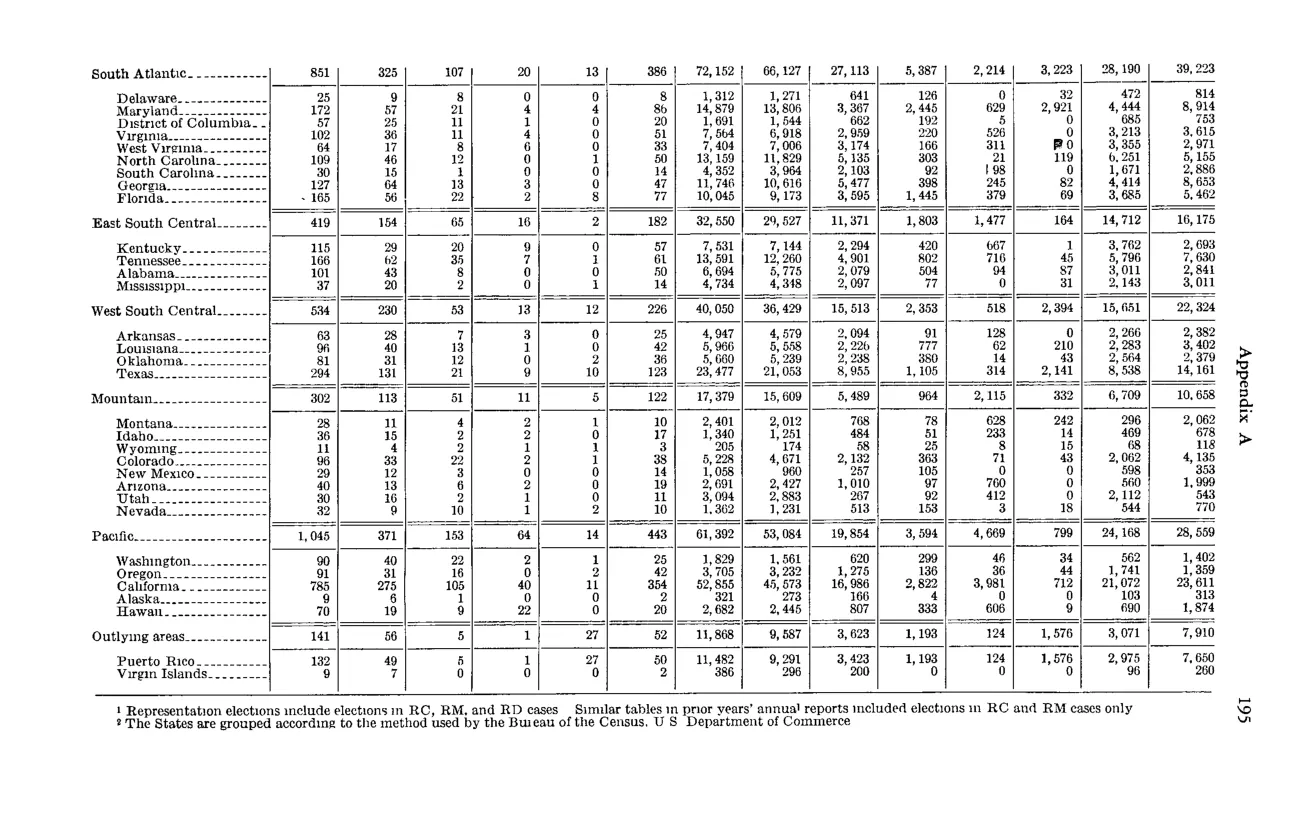
Geographic distribution of representation elections — by division and State
| Division and State 2 | Total elections | Number of elections in which representation rights were won by | Number of elections in which representation rights were won by | Number of elections in which representation rights were won by | Number of elections in which representation rights were won by | Number of elections in which representation rights were won by | Number of elections in which no representative was chosen | Number of employees eligible to vote | Total valid votes cast | Valid votes cast for | Valid votes cast for | Valid votes cast for | Valid votes cast for | Valid votes cast for | Valid votes cast for | Employees in units chosen representation | |
|---|---|---|---|---|---|---|---|---|---|---|---|---|---|---|---|---|---|
| AFL-CIO affiliates | Teamsters | Other national unions | Unaffiliated national unions | Local unaffiliated unions | AFL-CIO affiliates | Teamsters | Other national unions | Unaffiliated national unions | Local unaffiliated unions | No union | |||||||
| South Atlantic (division subtotal) | 853 | 325 | 107 | 20 | 13 | 386 | 72,152 | 66,127 | 27,113 | 5,387 | 2,214 | 3,223 | 28,190 | 39,325 | |||
| South Atlantic states (Delaware, Maryland, District of Columbia, Virginia, West Virginia, North Carolina, South Carolina, Georgia, Florida) | |||||||||||||||||
| East South Central (division subtotal) | 419 | 154 | 55 | 16 | 2 | 182 | 32,550 | 29,527 | 11,371 | 1,632 | 1,477 | 164 | 14,712 | 16,179 | |||
| East South Central states (Kentucky, Tennessee, Alabama, Mississippi) | |||||||||||||||||
| West South Central (division subtotal) | 534 | 230 | 53 | 9 | 4 | 226 | 40,650 | 36,499 | 15,513 | 2,353 | 318 | 61 | 2,394 | 15,851 | 22,324 | ||
| West South Central states (Arkansas, Louisiana, Oklahoma, Texas) | |||||||||||||||||
| Mountain (division subtotal) | 302 | 113 | 61 | 3 | 122 | 17,370 | 15,069 | 5,489 | 964 | 2,115 | 332 | 6,719 | 10,558 | ||||
| Mountain states (Montana, Idaho, Wyoming, Colorado, New Mexico, Arizona, Utah, Nevada) | |||||||||||||||||
| Pacific (division subtotal) | 1,045 | 371 | 153 | 64 | 14 | 443 | 61,392 | 53,094 | 19,854 | 3,594 | 4,659 | 709 | 24,168 | 28,559 | |||
| Pacific states (Washington, Oregon, California, Alaska, Hawaii) | |||||||||||||||||
| Outlying areas (Puerto Rico + Virgin Islands) | 131 | 67 | 10 | 7 | 27 | 11,868 | 9,762 | 3,623 | 1,445 | 1,556 | 5,176 |
Source image
Source data: U.S. NLRB Annual Reports (public domain). Reconstruction by NLRB Stats Archive. Updated June 2026.