NLRB Stats Archive › Annual Reports › FY1964 › Cases received and disposed of — by industry group
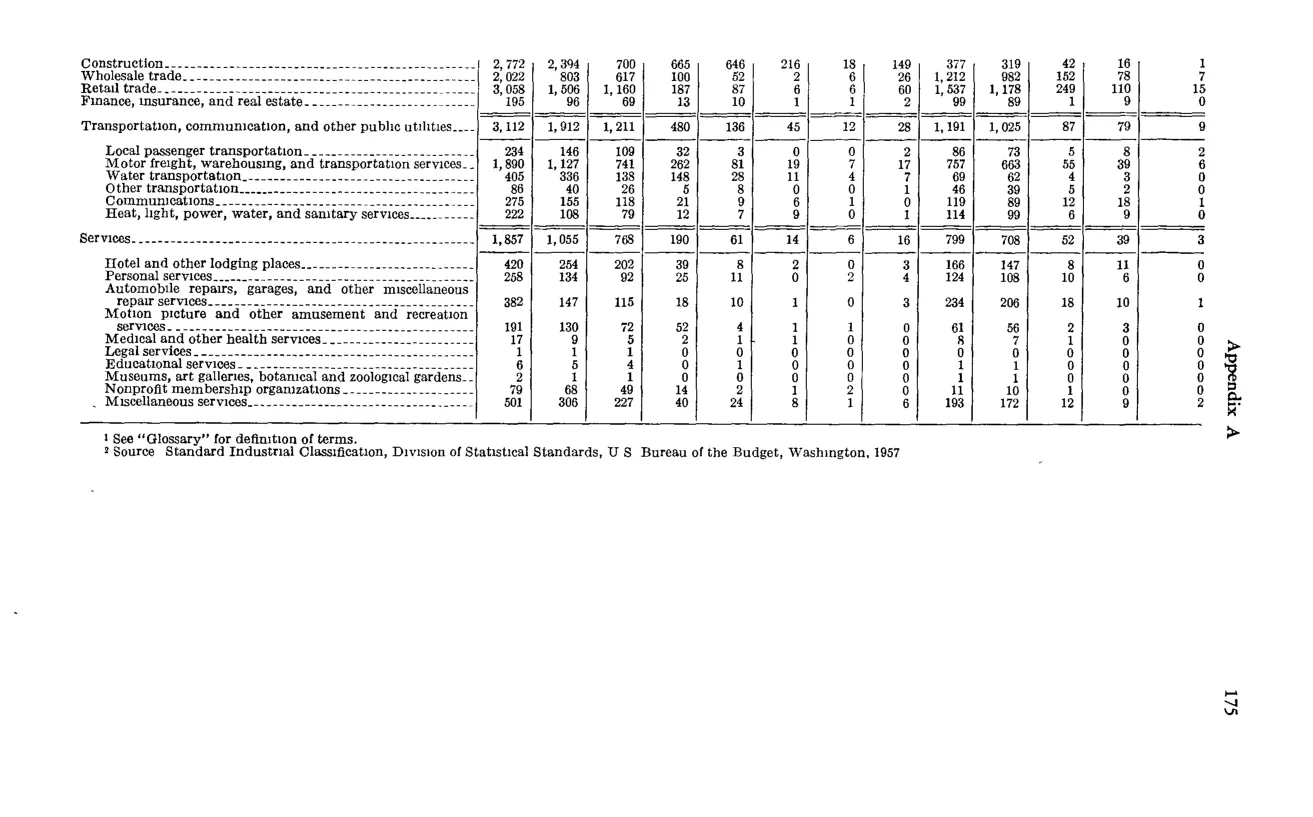
Cases received and disposed of — by industry group
| Industry group | Total all cases | All C cases | CA | CB | CC | CD | CE | CP | All R cases | RC | RM | RD | UD | |
|---|---|---|---|---|---|---|---|---|---|---|---|---|---|---|
| Construction | 2,172 | 2,394 | 700 | 665 | 646 | 216 | 18 | 149 | 377 | 131 | 228 | 18 | 15 | 1 |
| Wholesale trade | 1,272 | 618 | 275 | 117 | 189 | 8 | 8 | 21 | 646 | 549 | 60 | 31 | 6 | |
| Retail trade | 3,058 | 1,306 | 1,072 | 112 | 82 | 13 | 10 | 17 | 1,752 | 1,178 | 439 | 240 | 15 | |
| Finance, insurance, and real estate | 245 | 76 | 53 | 10 | 5 | 0 | 0 | 0 | 169 | 143 | 22 | 4 | ||
| Transportation, communication, and other public utilities | 1,912 | 1,912 | 1,211 | 490 | 159 | 138 | 45 | 2 | 26 | 1,781 | 1,295 | 87 | 59 | 9 |
| Transportation | ||||||||||||||
| Services | 1,887 | 1,355 | 768 | 190 | 61 | 14 | 6 | 16 | 708 | 726 | 52 | 29 | ||
| Services |
Source image
Source data: U.S. NLRB Annual Reports (public domain). Reconstruction by NLRB Stats Archive. Updated June 2026.