NLRB Stats Archive › Annual Reports › FY1964 › Decisions issued
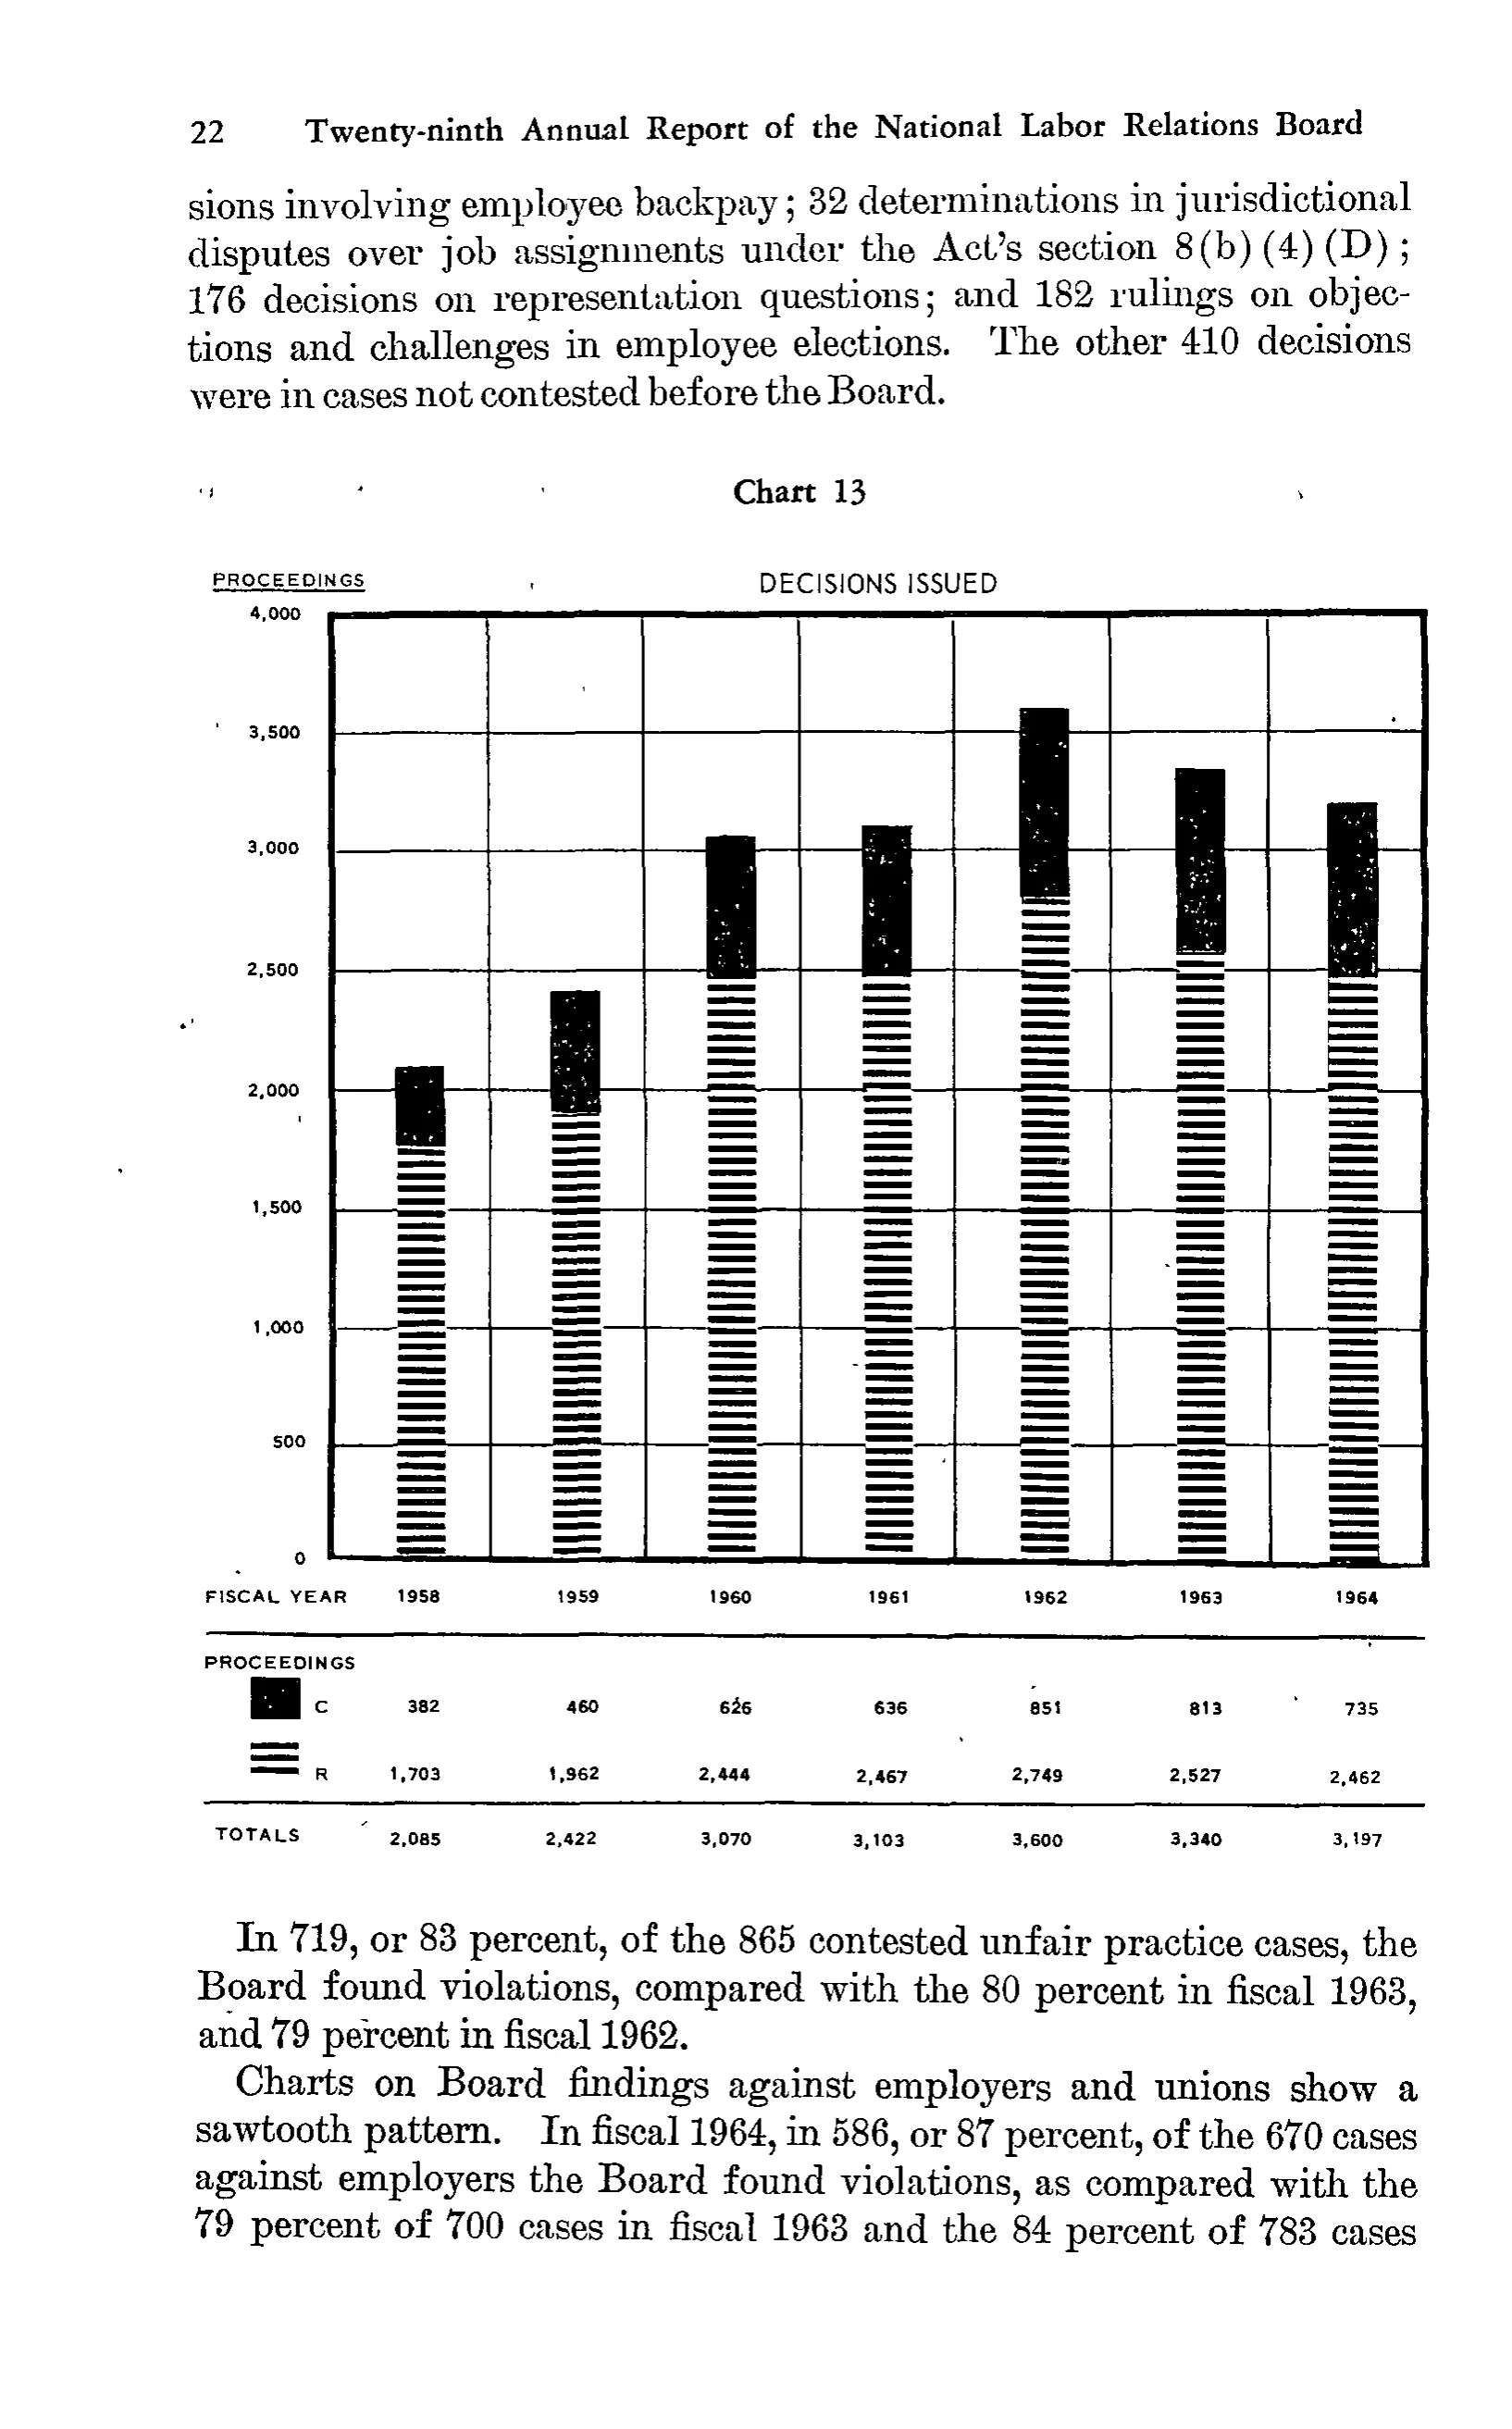
Decisions issued
| FISCAL YEAR | 1958 | 1959 | 1960 | 1961 | 1962 | 1963 | 1964 |
|---|---|---|---|---|---|---|---|
| PROCEEDINGS | |||||||
| C | 382 | 460 | 626 | 636 | 851 | 813 | 735 |
| R | 1,703 | 1,962 | 2,444 | 2,467 | 2,749 | 2,527 | 2,462 |
| TOTALS | 2,085 | 2,422 | 3,070 | 3,103 | 3,600 | 3,340 | 3,197 |
21 of 21 figures sit in a row or column sum that works out.
Reader’s notes
p. 35. The crop is Chart 13 ("DECISIONS ISSUED"), a stacked bar chart; the only tabular matter is the data/legend block printed beneath the plot, which is what is transcribed here. Columns are the seven fiscal years 1958-1964 taken from the "FISCAL YEAR" line under the plot axis. "PROCEEDINGS" is the section heading of the legend block and carries no values. In the printed legend the labels "C" and "R" each sit to the right of a small key swatch (solid black for C, horizontal-bar hatching for R); only the letters are transcribed. The word "PROCEEDINGS" also appears at the upper left as the chart's y-axis title, together with the axis scale 0 to 4,000 in 500-unit steps; that axis labelling is part of the plot, not the data block, and is not transcribed. All year columns are internally consistent: C + R equals the printed TOTALS in every year. The surrounding body text above and below the chart is not part of the table.
Source image
Source data: U.S. NLRB Annual Reports (public domain). Reconstruction by NLRB Stats Archive. Read by claude-opus-5 (effort max, prompt extract_v1) from the 300-dpi scan; stitched by page. Updated October 2026.