NLRB Stats Archive › Annual Reports › FY1964 › Board case backlog
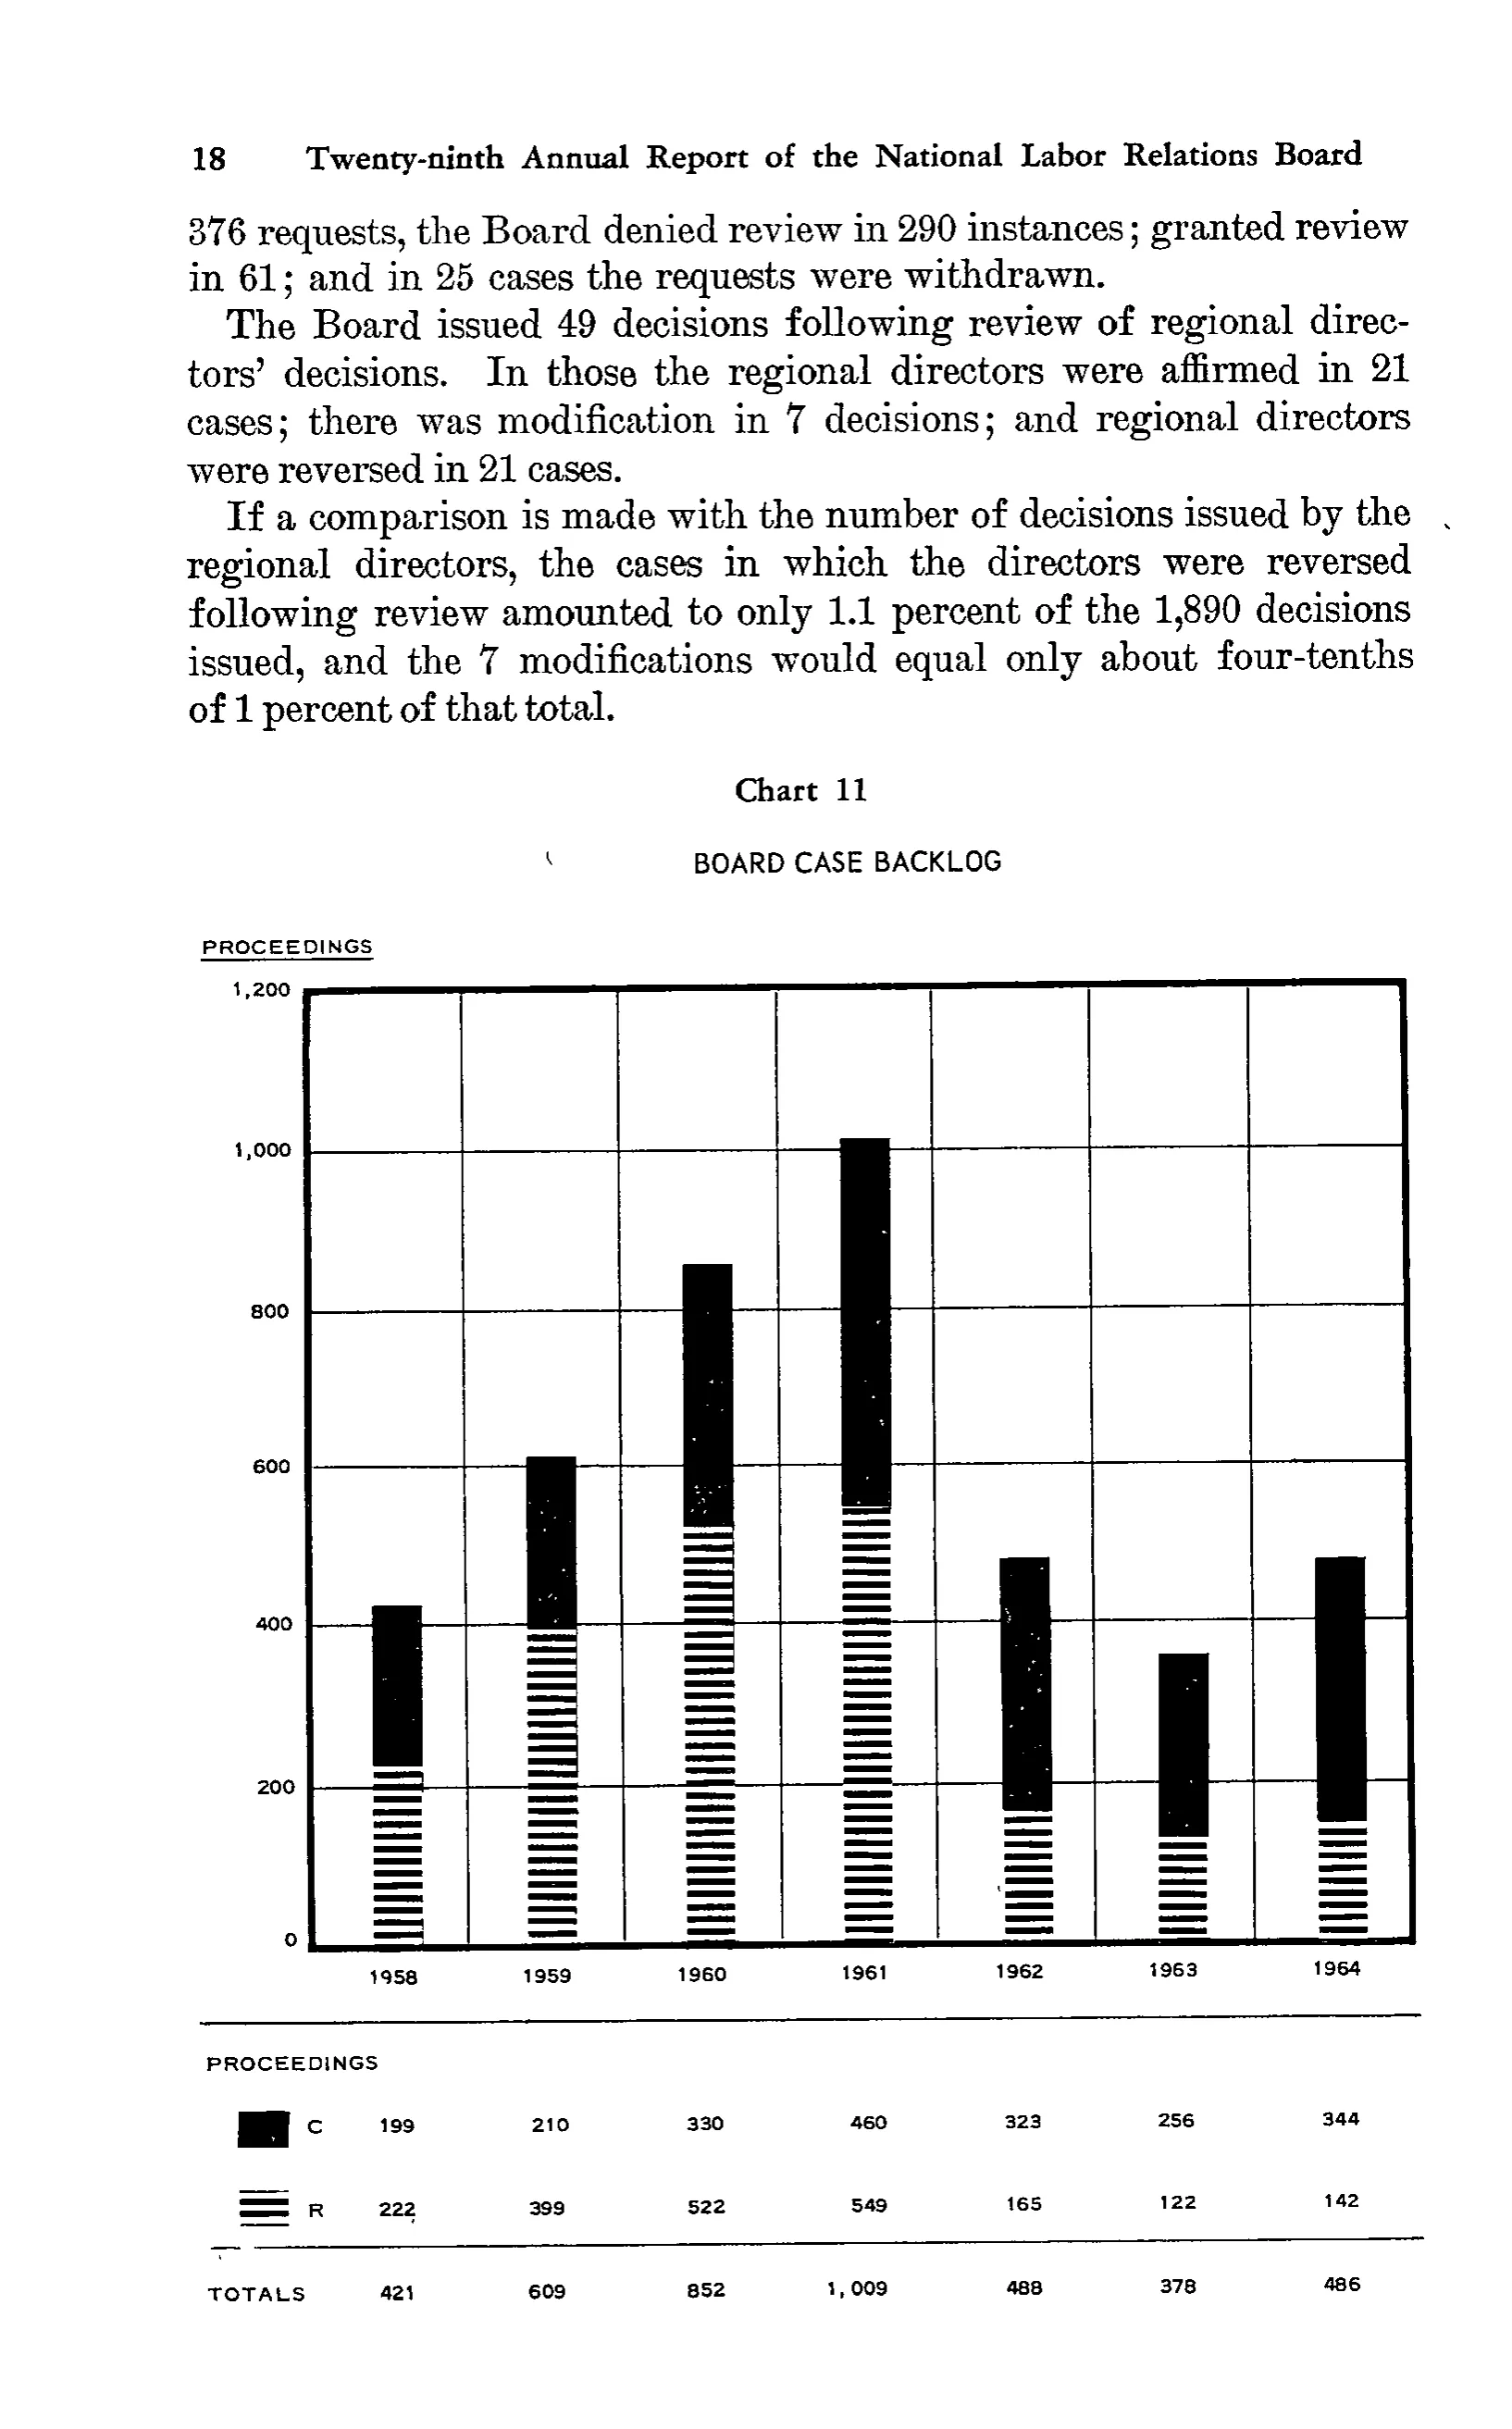
Board case backlog
| 1958 | 1959 | 1960 | 1961 | 1962 | 1963 | 1964 | |
|---|---|---|---|---|---|---|---|
| PROCEEDINGS | |||||||
| C | 199 | 210 | 330 | 460 | 323 | 256 | 344 |
| R | 222 | 399 | 522 | 549 | 165 | 122 | 142 |
| TOTALS | 421 | 609 | 852 | 1,009 | 488 | 378 | 486 |
21 of 21 figures sit in a row or column sum that works out.
Reader’s notes
p. 31. This crop is not a conventional statistical table: it is Chart 11, "Board Case Backlog", a stacked bar chart, preceded on the page by three paragraphs of running text (omitted). The grid above transcribes the data/legend panel printed below the chart. The column headings 1958-1964 are the chart's x-axis year labels, printed above and aligned with the data columns; no other headings are printed, and the stub column has no heading. The row labels "C" and "R" are each preceded by a legend swatch (solid black for C, horizontal stripes for R); the swatches are graphic keys, not text, so they are not transcribed. "PROCEEDINGS" is printed at the left above the C and R rows as a label line with no values (the same word also appears as the unit label above the chart's y-axis). The 1961 total is printed with a space after the comma ("1, 009") and is written 1,009. The C and R values sum exactly to the printed TOTALS in every year. All digits in the data panel are clearly legible; the only uncertainty is in how the chart's axis labels map to table headings, not in the values themselves.
Source image
Source data: U.S. NLRB Annual Reports (public domain). Reconstruction by NLRB Stats Archive. Read by claude-opus-5 (effort max, prompt extract_v1) from the 300-dpi scan; stitched by page. Updated October 2026.