NLRB Stats Archive › Annual Reports › FY1964 › Trial examiner hearings and decisions
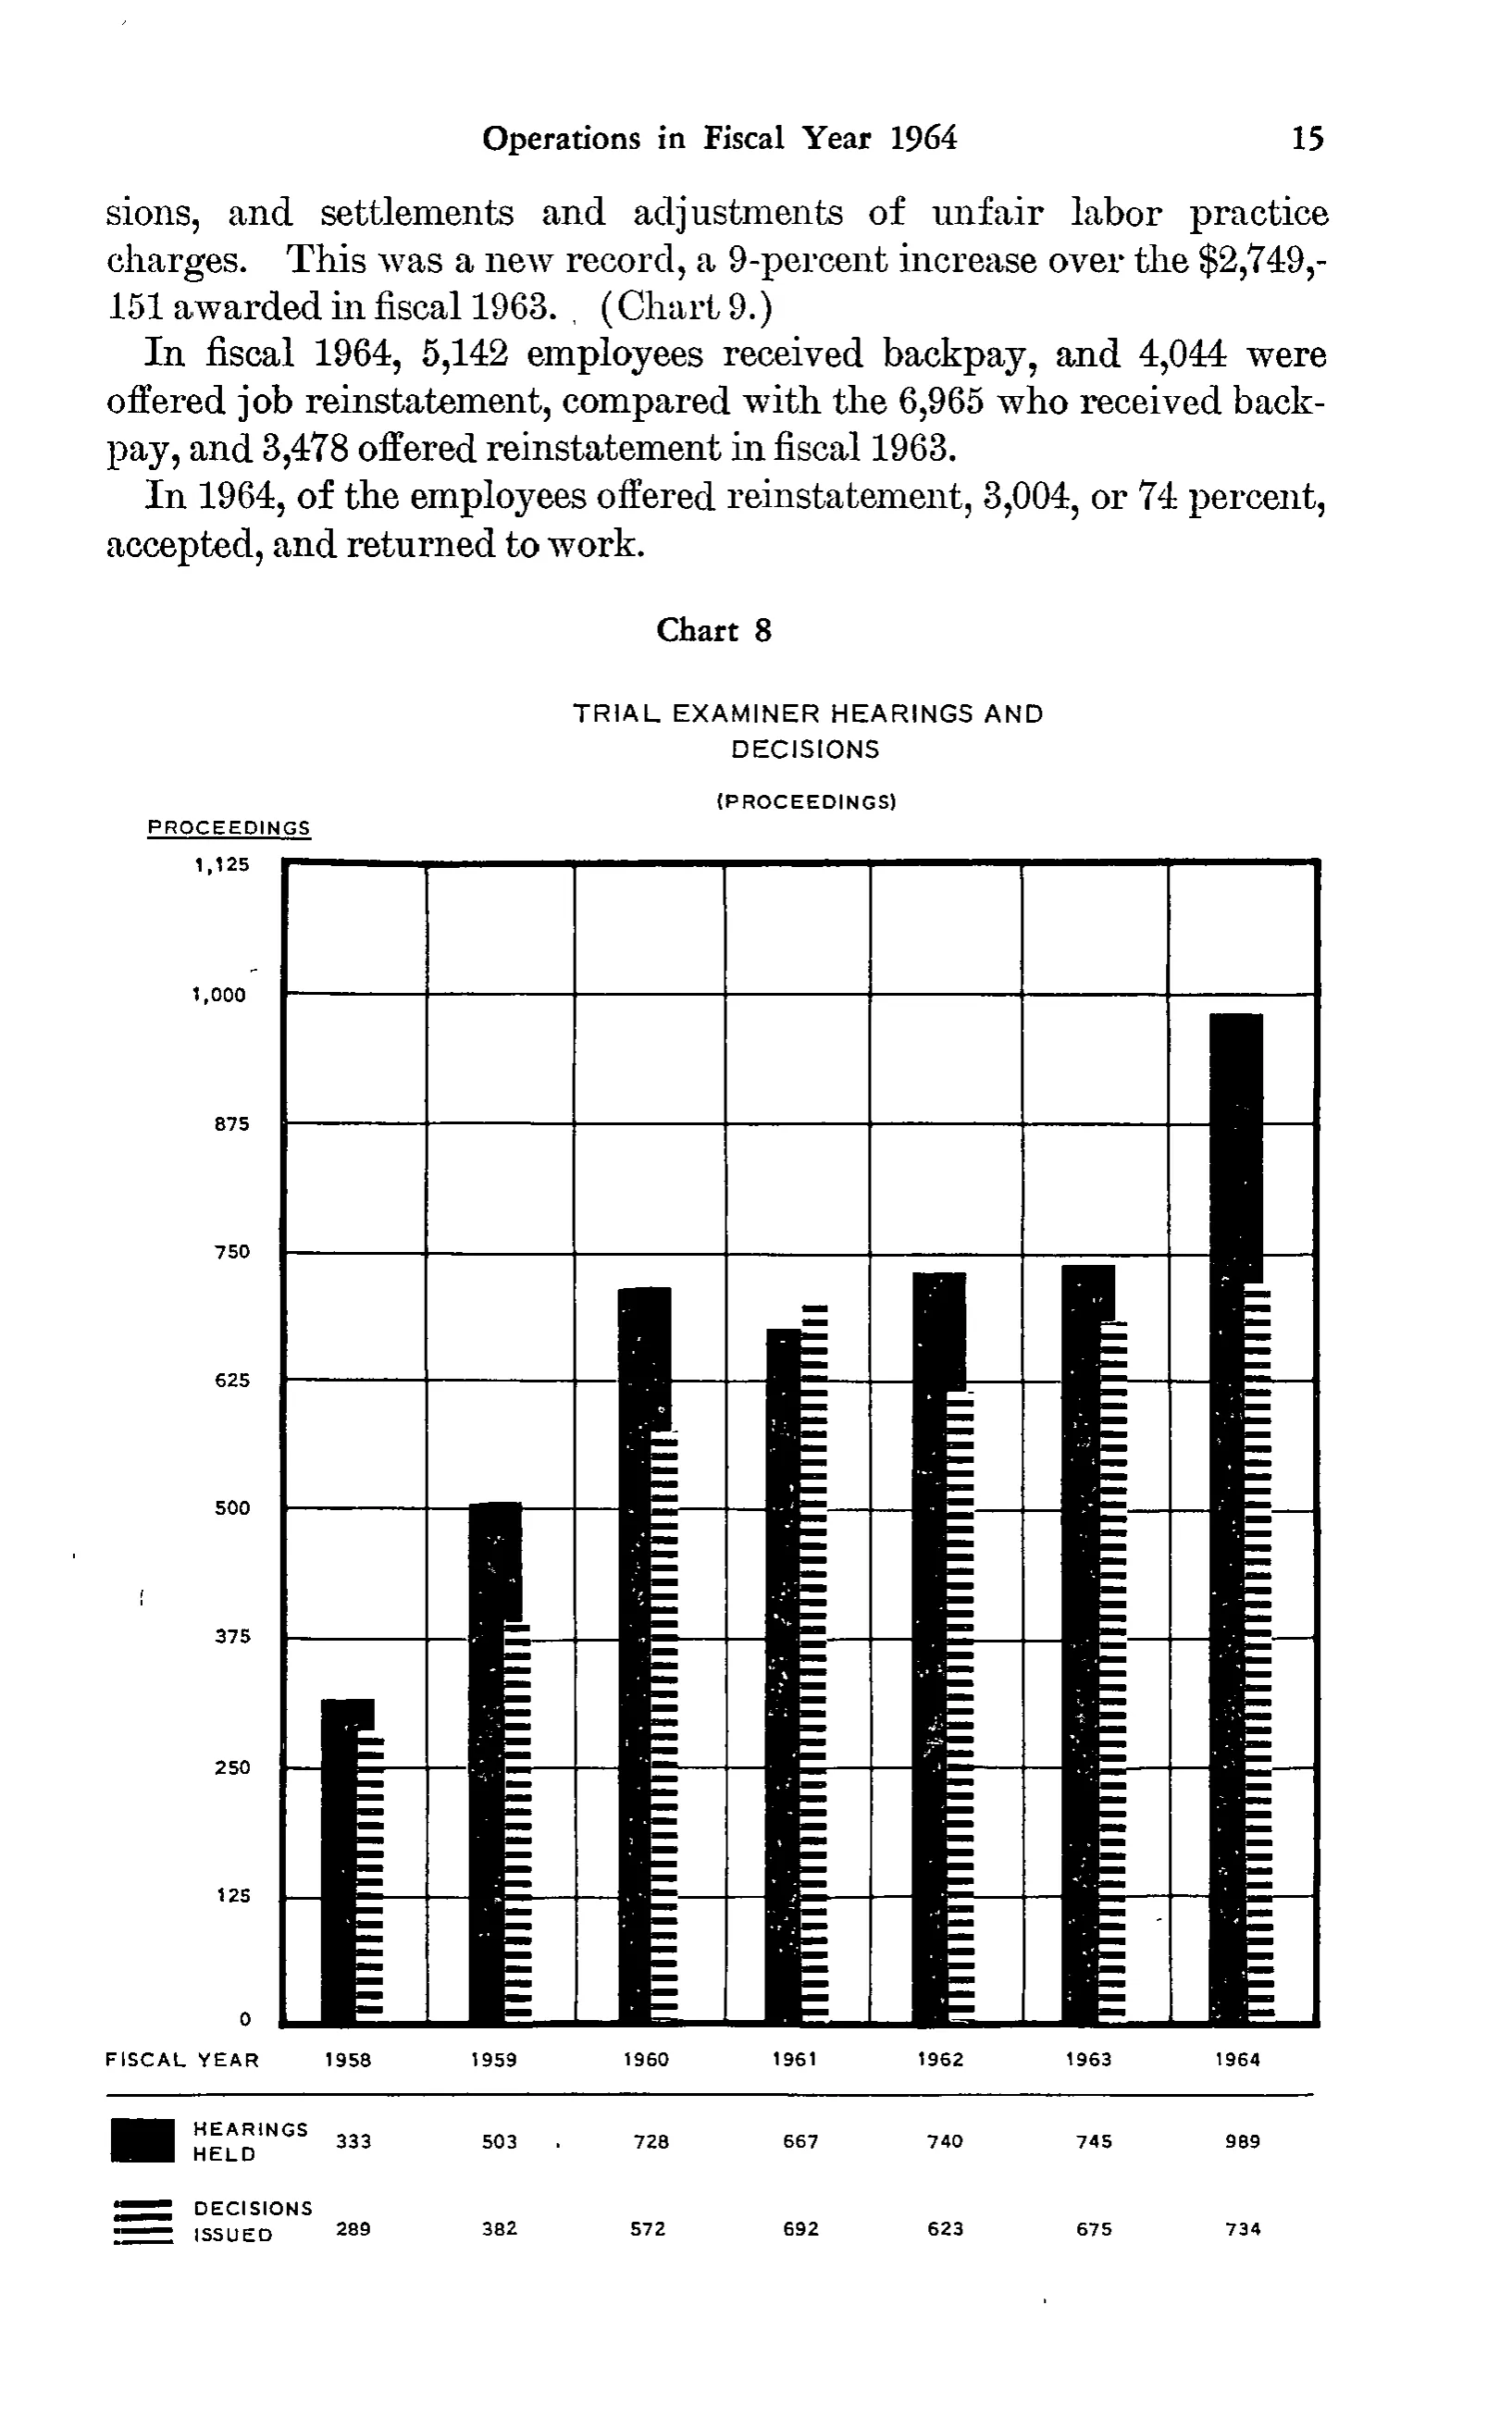
Trial examiner hearings and decisions
| FISCAL YEAR | 1958 | 1959 | 1960 | 1961 | 1962 | 1963 | 1964 |
|---|---|---|---|---|---|---|---|
| HEARINGS HELD | 333 | 503 | 728 | 667 | 740 | 745 | 989 |
| DECISIONS ISSUED | 289 | 382 | 572 | 692 | 623 | 675 | 734 |
0 of 14 figures sit in a row or column sum that works out.
Reader’s notes
p. 28. The crop is not a conventional statistical table: it is a page of narrative text followed by "Chart 8 — TRIAL EXAMINER HEARINGS AND DECISIONS (PROCEEDINGS)", a vertical bar chart. The only tabular matter is the data strip printed under the chart's horizontal axis, which is what the grid above transcribes: a "FISCAL YEAR" line giving 1958-1964 and two legend-keyed data lines ("HEARINGS HELD" = solid black bars, "DECISIONS ISSUED" = horizontally striped bars). The legend swatches (the black and striped key boxes printed to the left of each row label) are graphic and are not transcribed. The chart's y-axis scale labels (0, 125, 250, 375, 500, 625, 750, 875, 1,000, 1,125 under the heading "PROCEEDINGS") are also part of the graphic and are omitted. The plotted bar heights are consistent with every transcribed value, including 1961 where decisions issued (692) exceeds hearings held (667). A small isolated ink speck sits between the "503" (1959) and "728" (1960) cells on the HEARINGS HELD line; it is dirt on the scan, not a footnote marker or punctuation, and has not been transcribed. Page running head "Operations in Fiscal Year 1964" and page number 15 omitted per instructions.
Source image
Source data: U.S. NLRB Annual Reports (public domain). Reconstruction by NLRB Stats Archive. Read by claude-opus-5 (effort max, prompt extract_v1) from the 300-dpi scan; stitched by page. Updated October 2026.