NLRB Stats Archive › Annual Reports › FY1963 › Size of Units in Collective-Bargaining and Decertification Elections, Fiscal Year 1963
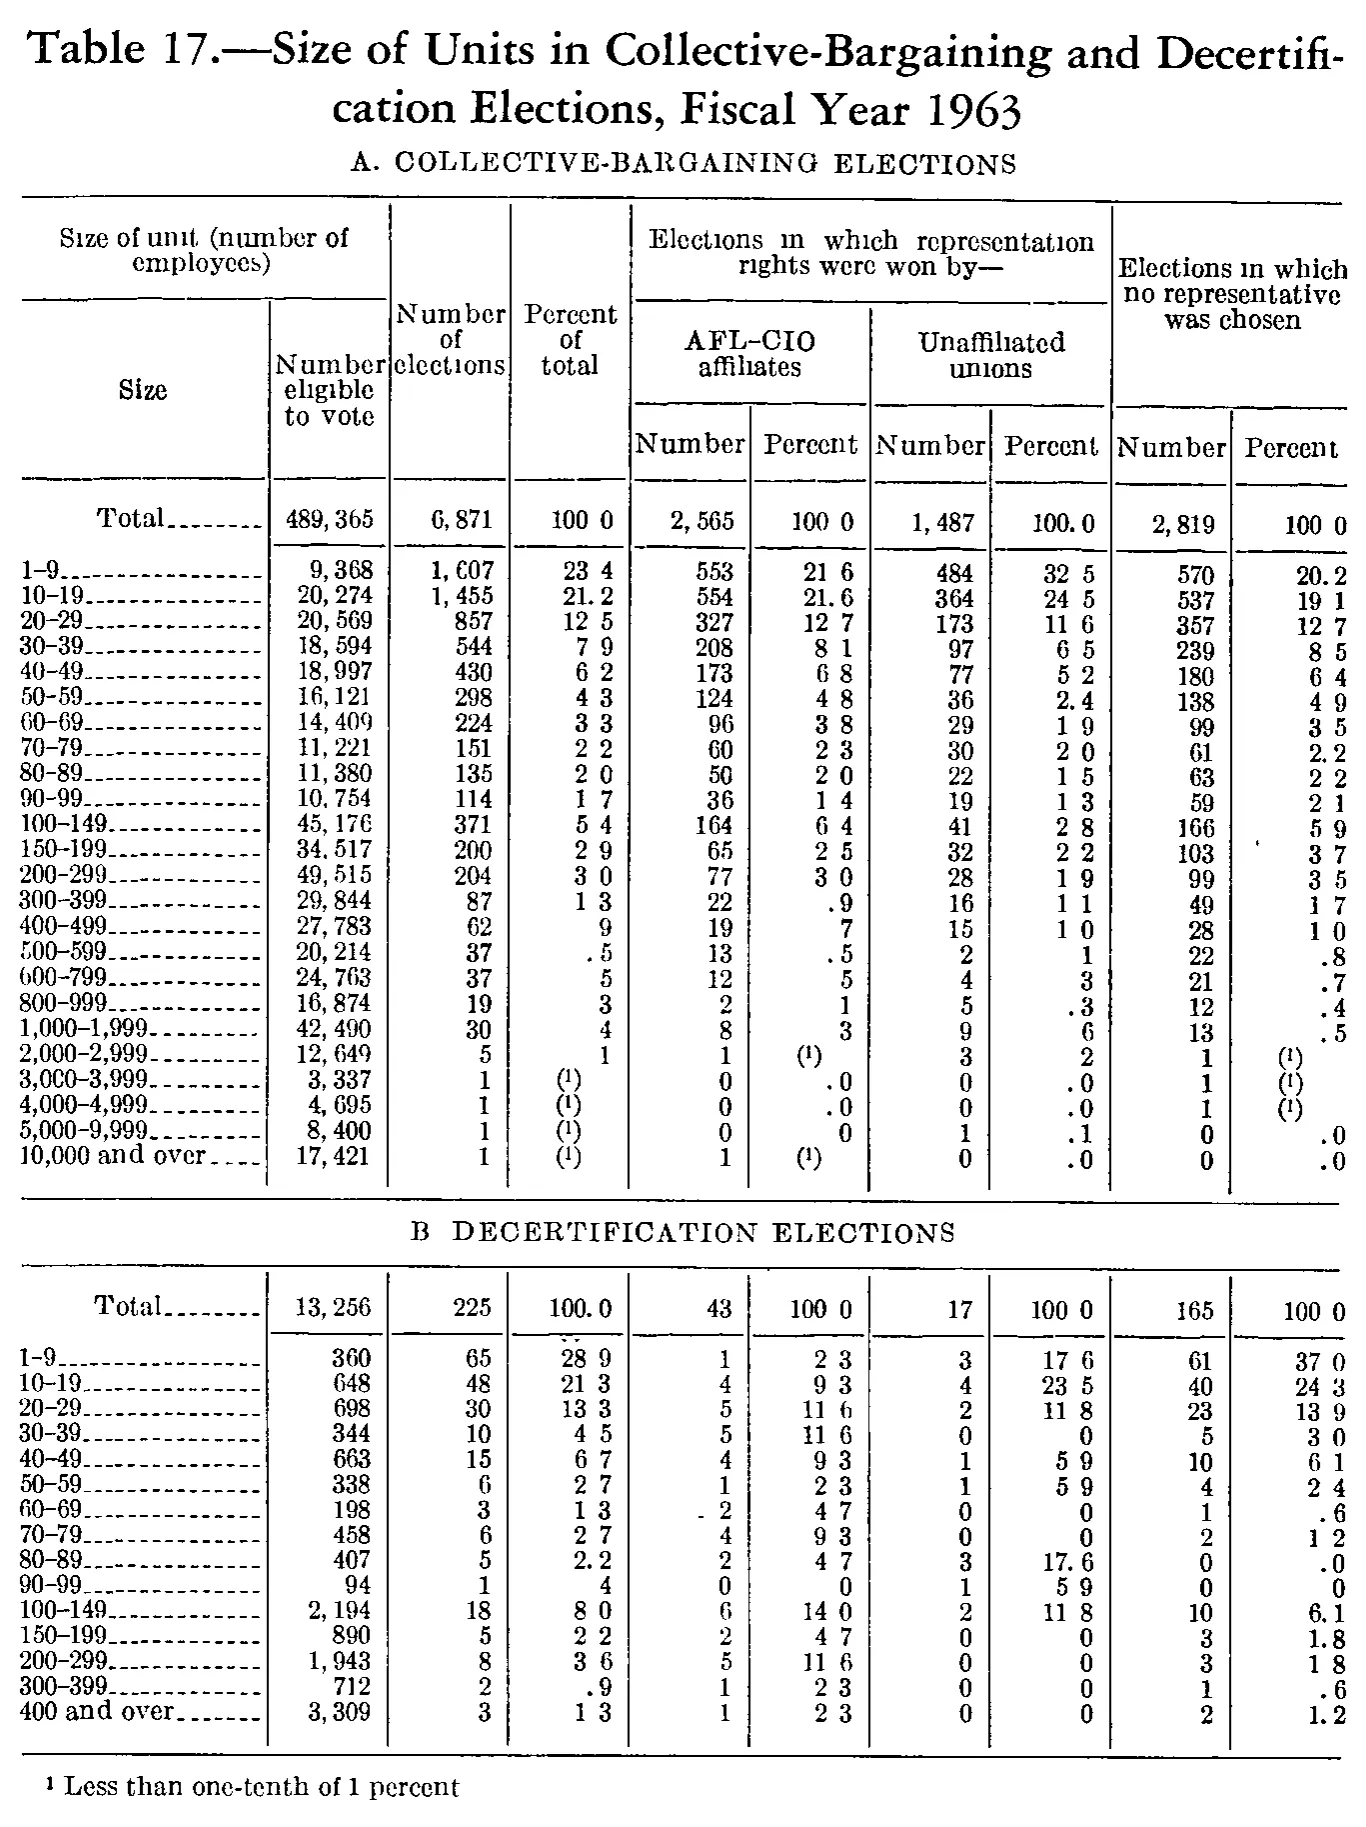
Size of Units in Collective-Bargaining and Decertification Elections, Fiscal Year 1963
| Size of unit (number of employees) | Size of unit (number of employees) | Number of elections | Percent of total | Elections in which representation rights were won by— | Elections in which no representative was chosen | ||||
|---|---|---|---|---|---|---|---|---|---|
| Size | Number eligible to vote | Number of elections | Percent of total | AFL-CIO affiliates | Unaffiliated unions | Elections in which no representative was chosen | |||
| Size | Number eligible to vote | Number of elections | Percent of total | Number | Percent | Number | Percent | Number | Percent |
| A. COLLECTIVE-BARGAINING ELECTIONS | |||||||||
| Total | 489,365 | 6,871 | 100.0 | 2,565 | 100.0 | 1,487 | 100.0 | 2,819 | 100.0 |
| 1-9 | 9,368 | 1,607 | 23.4 | 553 | 21.6 | 484 | 32.5 | 570 | 20.2 |
| 10-19 | 20,274 | 1,455 | 21.2 | 554 | 21.6 | 364 | 24.5 | 537 | 19.1 |
| 20-29 | 20,569 | 857 | 12.5 | 327 | 12.7 | 173 | 11.6 | 357 | 12.7 |
| 30-39 | 18,594 | 544 | 7.9 | 208 | 8.1 | 97 | 6.5 | 239 | 8.5 |
| 40-49 | 18,997 | 430 | 6.2 | 173 | 6.8 | 77 | 5.2 | 180 | 6.4 |
| 50-59 | 16,121 | 298 | 4.3 | 124 | 4.8 | 36 | 2.4 | 138 | 4.9 |
| 60-69 | 14,409 | 224 | 3.3 | 96 | 3.8 | 29 | 1.9 | 99 | 3.5 |
| 70-79 | 11,221 | 151 | 2.2 | 60 | 2.3 | 30 | 2.0 | 61 | 2.2 |
| 80-89 | 11,380 | 135 | 2.0 | 50 | 2.0 | 22 | 1.5 | 63 | 2.2 |
| 90-99 | 10,754 | 114 | 1.7 | 36 | 1.4 | 19 | 1.3 | 59 | 2.1 |
| 100-149 | 45,176 | 371 | 5.4 | 164 | 6.4 | 41 | 2.8 | 166 | 5.9 |
| 150-199 | 34,517 | 200 | 2.9 | 65 | 2.5 | 32 | 2.2 | 103 | 3.7 |
| 200-299 | 49,515 | 204 | 3.0 | 77 | 3.0 | 28 | 1.9 | 99 | 3.5 |
| 300-399 | 29,844 | 87 | 1.3 | 22 | .9 | 16 | 1.1 | 49 | 1.7 |
| 400-499 | 27,783 | 62 | .9 | 19 | .7 | 15 | 1.0 | 28 | 1.0 |
| 500-599 | 20,214 | 37 | .5 | 13 | .5 | 2 | .1 | 22 | .8 |
| 600-799 | 24,763 | 37 | .5 | 12 | .5 | 4 | .3 | 21 | .7 |
| 800-999 | 16,874 | 19 | .3 | 2 | .1 | 5 | .3 | 12 | .4 |
| 1,000-1,999 | 42,490 | 30 | .4 | 8 | .3 | 9 | .6 | 13 | .5 |
| 2,000-2,999 | 12,649 | 5 | .1 | 1 | [1] | 3 | .2 | 1 | [1] |
| 3,000-3,999 | 3,337 | 1 | [1] | 0 | .0 | 0 | .0 | 1 | [1] |
| 4,000-4,999 | 4,695 | 1 | [1] | 0 | .0 | 0 | .0 | 1 | [1] |
| 5,000-9,999 | 8,400 | 1 | [1] | 0 | .0 | 1 | .1 | 0 | .0 |
| 10,000 and over | 17,421 | 1 | [1] | 1 | [1] | 0 | .0 | 0 | .0 |
| B DECERTIFICATION ELECTIONS | |||||||||
| Total | 13,256 | 225 | 100.0 | 43 | 100.0 | 17 | 100.0 | 165 | 100.0 |
| 1-9 | 360 | 65 | 28.9 | 1 | 2.3 | 3 | 17.6 | 61 | 37.0 |
| 10-19 | 648 | 48 | 21.3 | 4 | 9.3 | 4 | 23.5 | 40 | 24.3 |
| 20-29 | 698 | 30 | 13.3 | 5 | 11.6 | 2 | 11.8 | 23 | 13.9 |
| 30-39 | 344 | 10 | 4.5 | 5 | 11.6 | 0 | .0 | 5 | 3.0 |
| 40-49 | 663 | 15 | 6.7 | 4 | 9.3 | 1 | 5.9 | 10 | 6.1 |
| 50-59 | 338 | 6 | 2.7 | 1 | 2.3 | 1 | 5.9 | 4 | 2.4 |
| 60-69 | 198 | 3 | 1.3 | 2 | 4.7 | 0 | .0 | 1 | .6 |
| 70-79 | 458 | 6 | 2.7 | 4 | 9.3 | 0 | .0 | 2 | 1.2 |
| 80-89 | 407 | 5 | 2.2 | 2 | 4.7 | 3 | 17.6 | 0 | .0 |
| 90-99 | 94 | 1 | .4 | 0 | .0 | 1 | 5.9 | 0 | .0 |
| 100-149 | 2,194 | 18 | 8.0 | 6 | 14.0 | 2 | 11.8 | 10 | 6.1 |
| 150-199 | 890 | 5 | 2.2 | 2 | 4.7 | 0 | .0 | 3 | 1.8 |
| 200-299 | 1,943 | 8 | 3.6 | 5 | 11.6 | 0 | .0 | 3 | 1.8 |
| 300-399 | 712 | 2 | .9 | 1 | 2.3 | 0 | .0 | 1 | .6 |
| 400 and over | 3,309 | 3 | 1.3 | 1 | 2.3 | 0 | .0 | 2 | 1.2 |
- 1 Less than one-tenth of 1 percent
187 of 187 figures sit in a row or column sum that works out.
Reader’s notes
p. 196. Structure: the table is printed as two sections stacked vertically (A above, B below), sharing one set of column headings that is printed only once, above section A. Section B repeats the same ten columns with no headings of its own. Both section subtitles ("A. COLLECTIVE-BARGAINING ELECTIONS", "B DECERTIFICATION ELECTIONS") are carried as label-only rows. Section B's subtitle shows no period after the "B", unlike "A."; a faint period may have been lost in the scan. Decimal points: this 1-bit scan drops a great many printed decimal points in the four percent columns — the Total rows, for instance, image as "100 0" and most data cells as "23 4", "21 6" and so on. Every cell in those columns is a one-decimal figure, so the points have been restored; the gap in the image is where the period sits. Lone-digit percent cells were treated the same way (section B row 90-99, Percent of total, images as a bare "4" and is given as ".4" — 1 of 225 = 0.4 percent), as were the zero percents that image as a bare "0" and are given as ".0" (section A rows 5,000-9,999; section B rows 30-39, 60-69, 70-79, 90-99, 150-199, 200-299, 300-399, 400 and over). Cells where the period is plainly visible were left as read. Verification: all five numeric columns add exactly to their printed totals in both sections — section A, 489,365 / 6,871 / 2,565 / 1,487 / 2,819; section B, 13,256 / 225 / 43 / 17 / 165 — so the digits are well attested and no printed total appears to be in error. Doubtful glyphs: "1,607" (section A, row 1-9, Number of elections) is broken in the scan and could be misread as "1,C07"; the column total confirms 1,607. "(1)" standing alone in a cell is the printed reference to footnote 1 (less than one-tenth of 1 percent), not a value. Two specks are scanner noise, not characters: an apostrophe-like mark to the left of "103" (section A, row 150-199, Elections in which no representative was chosen / Number) and a short dash before "2" (section B, row 60-69, AFL-CIO affiliates / Number).
Source image
Source data: U.S. NLRB Annual Reports (public domain). Reconstruction by NLRB Stats Archive. Read by claude-opus-5 (effort max, prompt extract_v1) from the 300-dpi scan; stitched by page. Updated October 2026.