NLRB Stats Archive › Annual Reports › FY1963 › Analysis of Methods of Disposition of Representation Cases Closed, Fiscal Year 1963
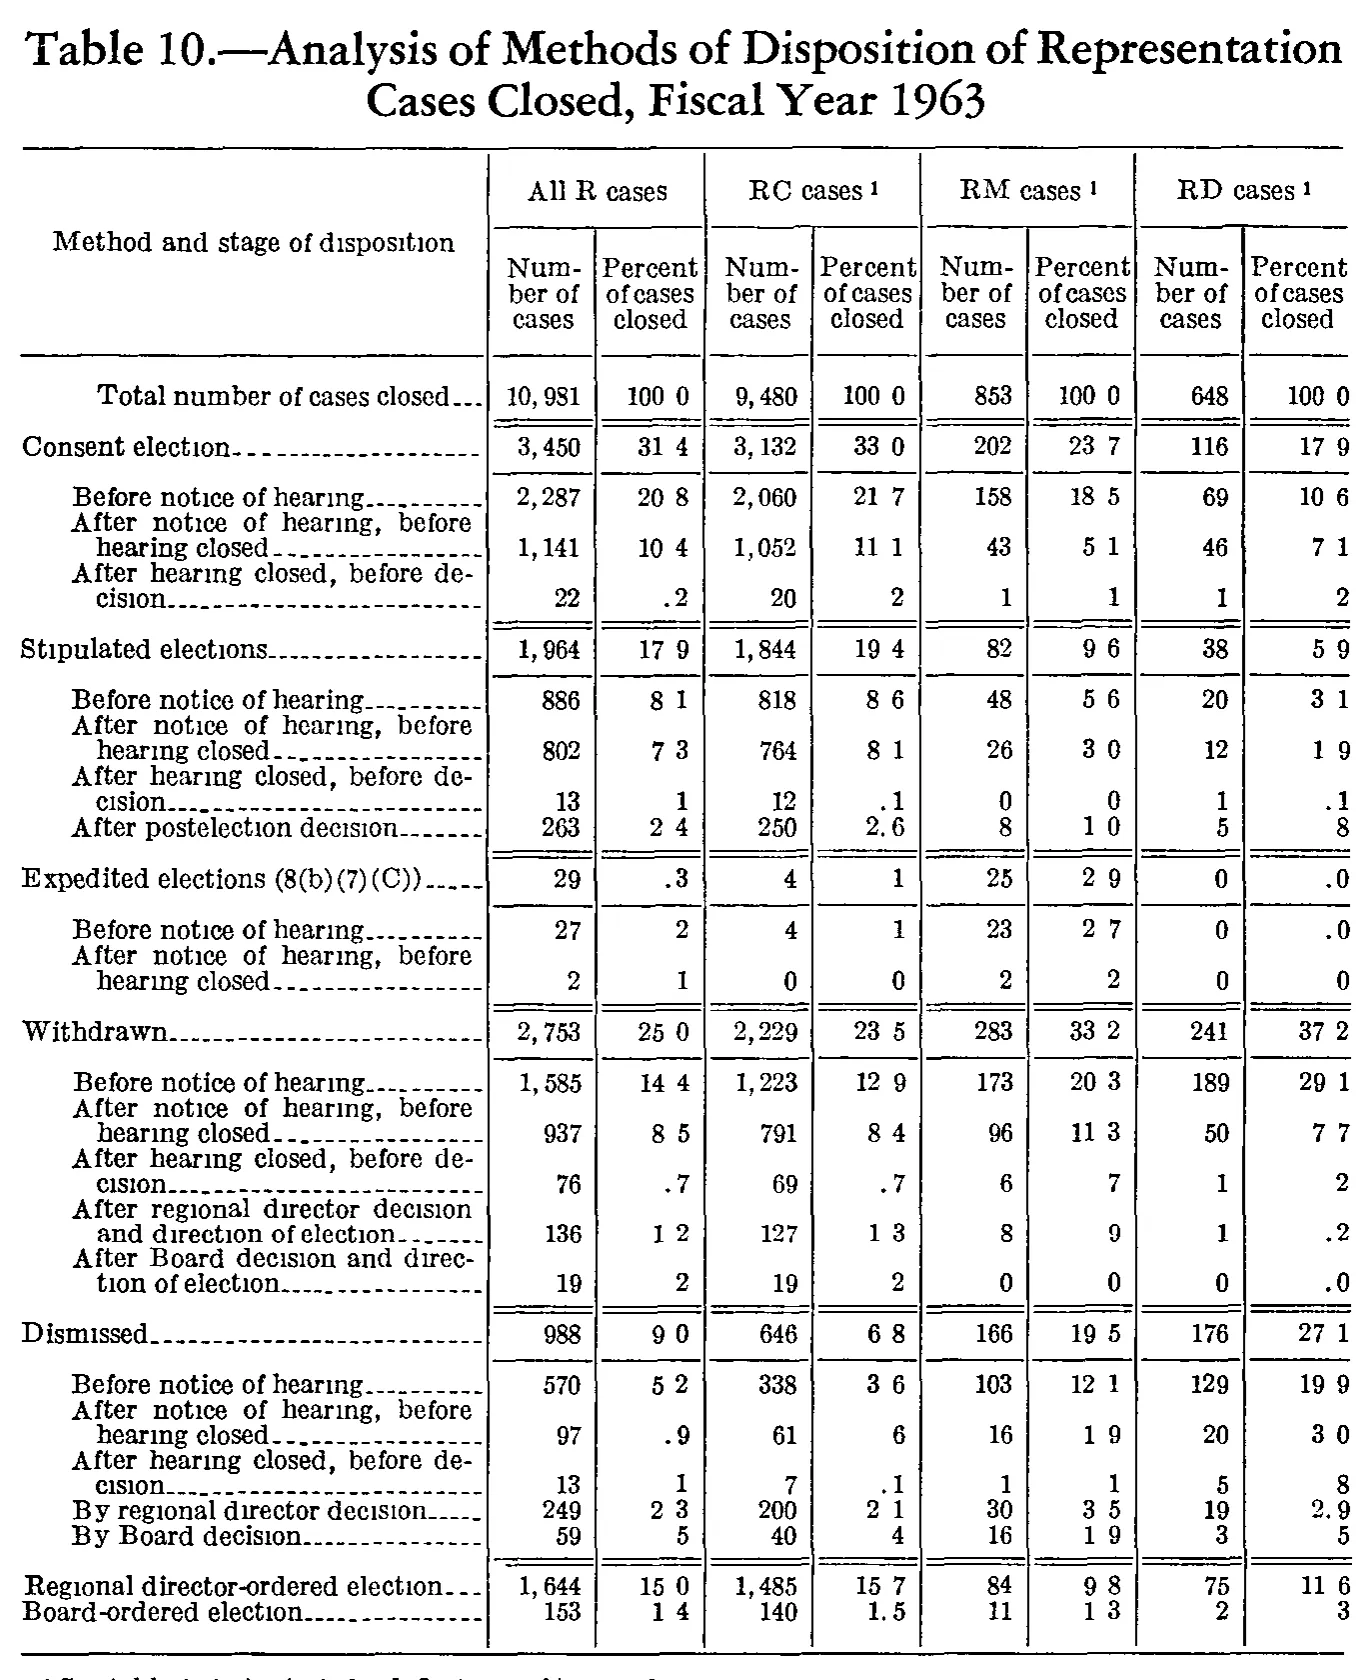
Analysis of Methods of Disposition of Representation Cases Closed, Fiscal Year 1963
| Method and stage of disposition | All R cases | RC cases | RM cases | RD cases | ||||
|---|---|---|---|---|---|---|---|---|
| Method and stage of disposition | Number of cases | Percent of cases closed | Number of cases | Percent of cases closed | Number of cases | Percent of cases closed | Number of cases | Percent of cases closed |
| Total number of cases closed | 10,981 | 100.0 | 9,480 | 100.0 | 853 | 100.0 | 648 | 100.0 |
| Consent election | 3,450 | 31.4 | 3,132 | 33.0 | 202 | 23.7 | 116 | 17.9 |
| Before notice of hearing | 2,287 | 20.8 | 2,060 | 21.7 | 158 | 18.5 | 69 | 10.6 |
| After notice of hearing, before hearing closed | 1,141 | 10.4 | 1,052 | 11.1 | 43 | 5.1 | 46 | 7.1 |
| After hearing closed, before decision | 22 | .2 | 20 | .2 | 1 | .1 | 1 | .2 |
| Stipulated elections | 1,964 | 17.9 | 1,844 | 19.4 | 82 | 9.6 | 38 | 5.9 |
| Before notice of hearing | 886 | 8.1 | 818 | 8.6 | 48 | 5.6 | 20 | 3.1 |
| After notice of hearing, before hearing closed | 802 | 7.3 | 764 | 8.1 | 26 | 3.0 | 12 | 1.9 |
| After hearing closed, before decision | 13 | .1 | 12 | .1 | 0 | 0 | 1 | .1 |
| After postelection decision | 263 | 2.4 | 250 | 2.6 | 8 | 1.0 | 5 | .8 |
| Expedited elections (8(b)(7)(C)) | 29 | .3 | 4 | .1 | 25 | 2.9 | 0 | .0 |
| Before notice of hearing | 27 | .2 | 4 | .1 | 23 | 2.7 | 0 | .0 |
| After notice of hearing, before hearing closed | 2 | .1 | 0 | 0 | 2 | .2 | 0 | 0 |
| Withdrawn | 2,753 | 25.0 | 2,229 | 23.5 | 283 | 33.2 | 241 | 37.2 |
| Before notice of hearing | 1,585 | 14.4 | 1,223 | 12.9 | 173 | 20.3 | 189 | 29.1 |
| After notice of hearing, before hearing closed | 937 | 8.5 | 791 | 8.4 | 96 | 11.3 | 50 | 7.7 |
| After hearing closed, before decision | 76 | .7 | 69 | .7 | 6 | .7 | 1 | .2 |
| After regional director decision and direction of election | 136 | 1.2 | 127 | 1.3 | 8 | .9 | 1 | .2 |
| After Board decision and direction of election | 19 | .2 | 19 | .2 | 0 | 0 | 0 | .0 |
| Dismissed | 988 | 9.0 | 646 | 6.8 | 166 | 19.5 | 176 | 27.1 |
| Before notice of hearing | 570 | 5.2 | 338 | 3.6 | 103 | 12.1 | 129 | 19.9 |
| After notice of hearing, before hearing closed | 97 | .9 | 61 | .6 | 16 | 1.9 | 20 | 3.0 |
| After hearing closed, before decision | 13 | .1 | 7 | .1 | 1 | .1 | 5 | .8 |
| By regional director decision | 249 | 2.3 | 200 | 2.1 | 30 | 3.5 | 19 | 2.9 |
| By Board decision | 59 | .5 | 40 | .4 | 16 | 1.9 | 3 | .5 |
| Regional director-ordered election | 1,644 | 15.0 | 1,485 | 15.7 | 84 | 9.8 | 75 | 11.6 |
| Board-ordered election | 153 | 1.4 | 140 | 1.5 | 11 | 1.3 | 2 | .3 |
101 of 101 figures sit in a row or column sum that works out.
Reader’s notes
p. 187. 9 columns: stub plus a Number/Percent pair for each of All R, RC, RM and RD cases. The superscript 1 sits on the RC, RM and RD panel headings only, not on "All R cases". Decimal points: this is a coarse 1-bit scan and the decimal point in the "Percent of cases closed" columns is dropped in most cells, printing as a gap ("100 0", "31 4", "20 8") or as a bare digit where a leading ".x" is meant ("2", "9", "5"). Every percent cell on this page carries exactly one decimal place, and the point is clearly visible in a minority of cells (".2", ".7", ".9", "2.6", "1.5", "2.9"), so I have restored the point in every percent cell rather than transcribing the gap. No digits were changed. Cells where the printed zero percents are genuinely inconsistent and transcribed as seen: row "After hearing closed, before decision" (Stipulated), RM percent = "0"; row "After notice of hearing, before hearing closed" (Expedited), RC percent = "0" and RD percent = "0"; row "After Board decision and direction of election", RM percent = "0". Elsewhere a zero percent prints as ".0" (Expedited elections RD, its "Before notice of hearing" RD, "After Board decision and direction of election" RD). This may be the same dropped-point artifact rather than a real distinction. Doubtful cells, all in percent columns, where the glyph reads as a "1" but the arithmetic implies ".0": "Expedited elections (8(b)(7)(C))" RC percent, "Before notice of hearing" (under Expedited) RC percent — both against 4 cases out of 9,480 — and "After notice of hearing, before hearing closed" (under Expedited) All R percent, against 2 cases out of 10,981. I transcribed them as ".1" as read; ".0" is a real possibility. Also doubtful: "After hearing closed, before decision" (Stipulated) RD percent, read ".1" where 1 of 648 rounds to .2 as it does in the three other 1-of-648 cells; and "After notice of hearing, before hearing closed" (Dismissed) RD percent, read "3.0" where 20 of 648 is 3.1. All eight number columns cross-foot exactly: each method's sub-stages sum to its method line, and the seven method lines sum to the "Total number of cases closed" row in every panel (10,981 / 9,480 / 853 / 648). The number columns are therefore reliable. A footnote line is printed below the table but is sliced by the bottom edge of the crop; only the tops of a few characters survive and I could not read it, so `footnotes` is empty. The table carries at least one footnote (marker 1 on the RC, RM and RD headings).
Source image
Source data: U.S. NLRB Annual Reports (public domain). Reconstruction by NLRB Stats Archive. Read by claude-opus-5 (effort max, prompt extract_v1) from the 300-dpi scan; stitched by page. Updated October 2026.