NLRB Stats Archive › Annual Reports › FY1963 › Geographic Distribution of Unfair Labor Practice and Representation Cases Received, Fiscal Year 1963
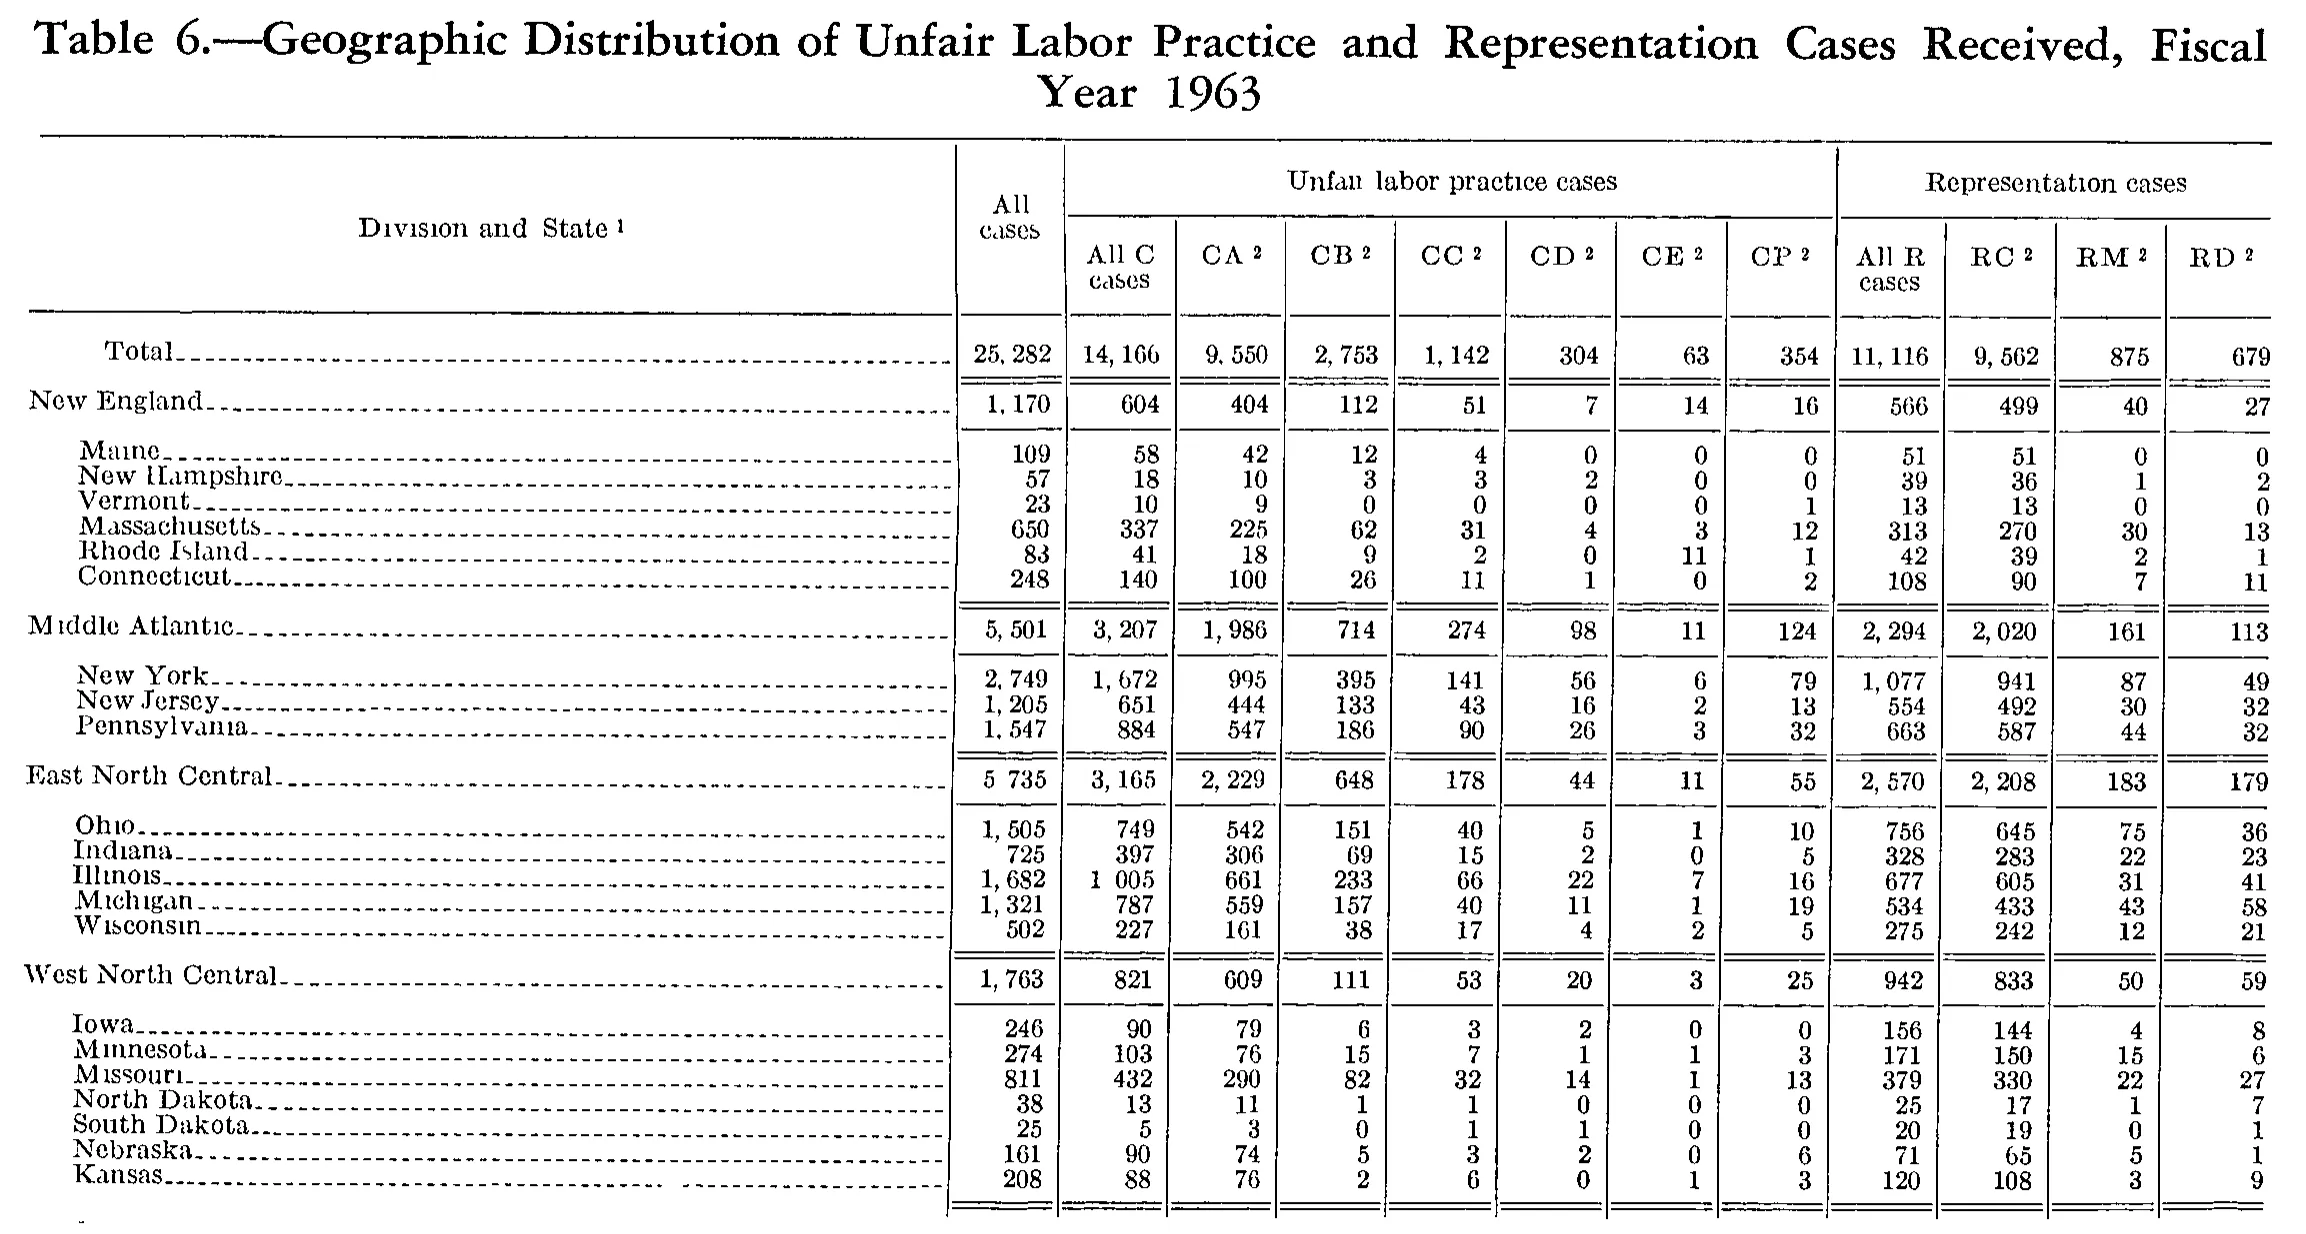
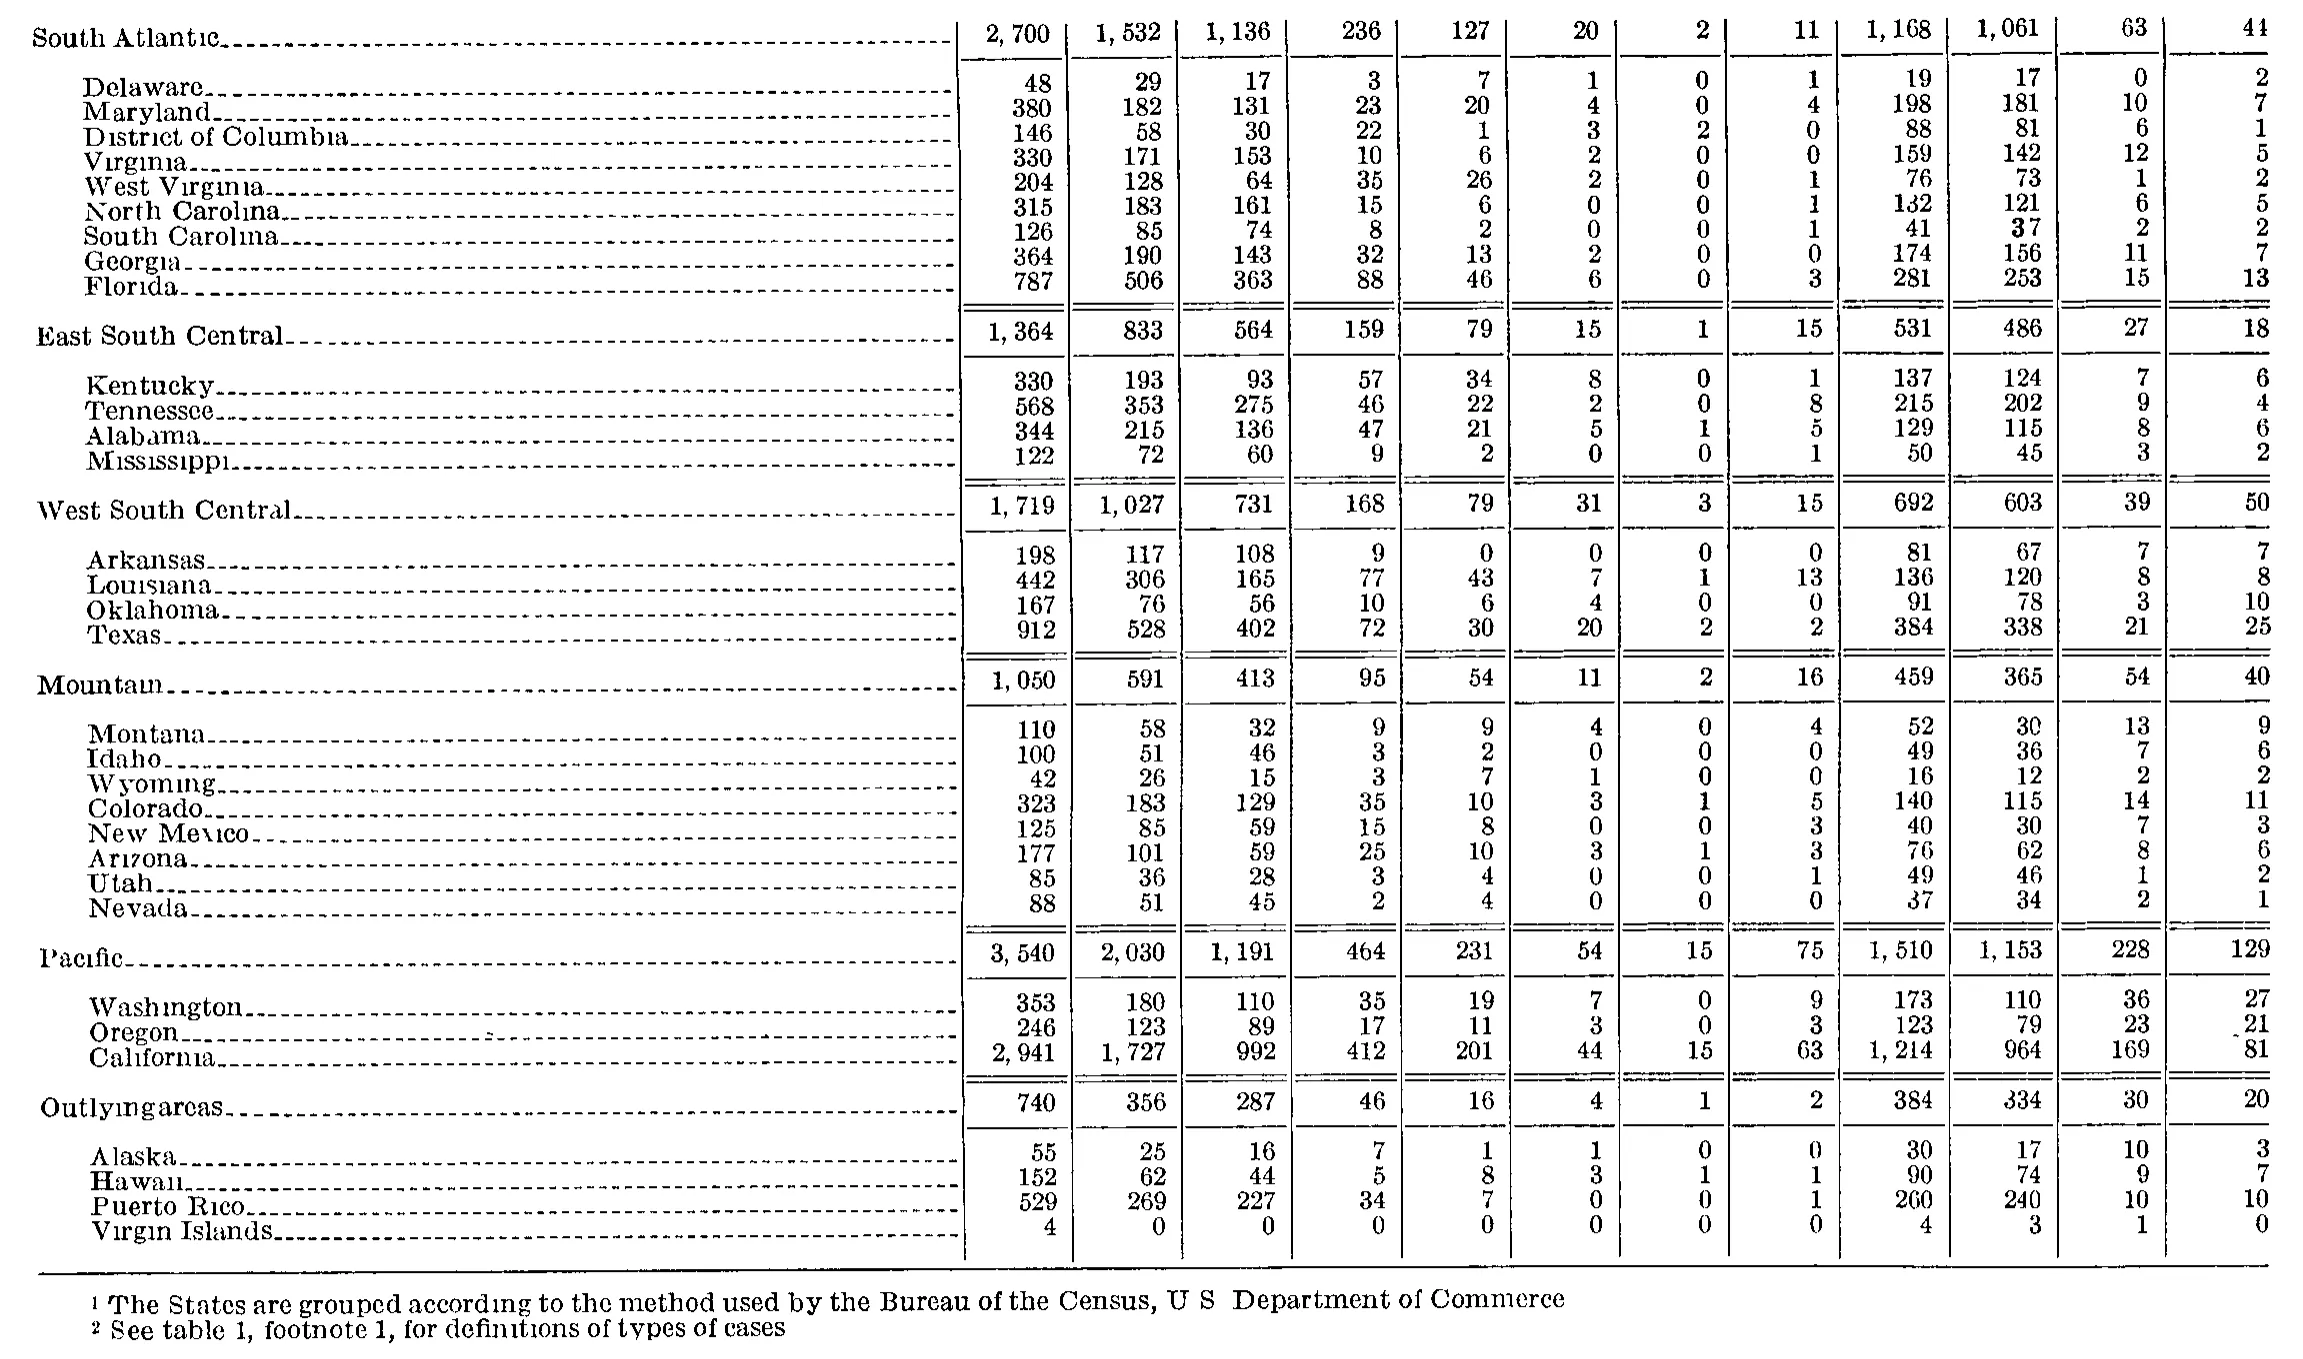
Geographic Distribution of Unfair Labor Practice and Representation Cases Received, Fiscal Year 1963
Stitched from pp. 181–182.
| Division and State | All cases | Unfair labor practice cases | Representation cases | |||||||||
|---|---|---|---|---|---|---|---|---|---|---|---|---|
| Division and State | All cases | All C cases | CA | CB | CC | CD | CE | CP | All R cases | RC | RM | RD |
| Total | 25,282 | 14,166 | 9,550 | 2,753 | 1,142 | 304 | 63 | 354 | 11,116 | 9,562 | 875 | 679 |
| New England | 1,170 | 604 | 404 | 112 | 51 | 7 | 14 | 16 | 566 | 499 | 40 | 27 |
| Maine | 109 | 58 | 42 | 12 | 4 | 0 | 0 | 0 | 51 | 51 | 0 | 0 |
| New Hampshire | 57 | 18 | 10 | 3 | 3 | 2 | 0 | 0 | 39 | 36 | 1 | 2 |
| Vermont | 23 | 10 | 9 | 0 | 0 | 0 | 0 | 1 | 13 | 13 | 0 | 0 |
| Massachusetts | 650 | 337 | 225 | 62 | 31 | 4 | 3 | 12 | 313 | 270 | 30 | 13 |
| Rhode Island | 83 | 41 | 18 | 9 | 2 | 0 | 11 | 1 | 42 | 39 | 2 | 1 |
| Connecticut | 248 | 140 | 100 | 26 | 11 | 1 | 0 | 2 | 108 | 90 | 7 | 11 |
| Middle Atlantic | 5,501 | 3,207 | 1,986 | 714 | 274 | 98 | 11 | 124 | 2,294 | 2,020 | 161 | 113 |
| New York | 2,749 | 1,672 | 995 | 395 | 141 | 56 | 6 | 79 | 1,077 | 941 | 87 | 49 |
| New Jersey | 1,205 | 651 | 444 | 133 | 43 | 16 | 2 | 13 | 554 | 492 | 30 | 32 |
| Pennsylvania | 1,547 | 884 | 547 | 186 | 90 | 26 | 3 | 32 | 663 | 587 | 44 | 32 |
| East North Central | 5,735 | 3,165 | 2,229 | 648 | 178 | 44 | 11 | 55 | 2,570 | 2,208 | 183 | 179 |
| Ohio | 1,505 | 749 | 542 | 151 | 40 | 5 | 1 | 10 | 756 | 645 | 75 | 36 |
| Indiana | 725 | 397 | 306 | 69 | 15 | 2 | 0 | 5 | 328 | 283 | 22 | 23 |
| Illinois | 1,682 | 1,005 | 661 | 233 | 66 | 22 | 7 | 16 | 677 | 605 | 31 | 41 |
| Michigan | 1,321 | 787 | 559 | 157 | 40 | 11 | 1 | 19 | 534 | 433 | 43 | 58 |
| Wisconsin | 502 | 227 | 161 | 38 | 17 | 4 | 2 | 5 | 275 | 242 | 12 | 21 |
| West North Central | 1,763 | 821 | 609 | 111 | 53 | 20 | 3 | 25 | 942 | 833 | 50 | 59 |
| Iowa | 246 | 90 | 79 | 6 | 3 | 2 | 0 | 0 | 156 | 144 | 4 | 8 |
| Minnesota | 274 | 103 | 76 | 15 | 7 | 1 | 1 | 3 | 171 | 150 | 15 | 6 |
| Missouri | 811 | 432 | 290 | 82 | 32 | 14 | 1 | 13 | 379 | 330 | 22 | 27 |
| North Dakota | 38 | 13 | 11 | 1 | 1 | 0 | 0 | 0 | 25 | 17 | 1 | 7 |
| South Dakota | 25 | 5 | 3 | 0 | 1 | 1 | 0 | 0 | 20 | 19 | 0 | 1 |
| Nebraska | 161 | 90 | 74 | 5 | 3 | 2 | 0 | 6 | 71 | 65 | 5 | 1 |
| Kansas | 208 | 88 | 76 | 2 | 6 | 0 | 1 | 3 | 120 | 108 | 3 | 9 |
| South Atlantic | 2,700 | 1,532 | 1,136 | 236 | 127 | 20 | 2 | 11 | 1,168 | 1,061 | 63 | 44 |
| Delaware | 48 | 29 | 17 | 3 | 7 | 1 | 0 | 1 | 19 | 17 | 0 | 2 |
| Maryland | 380 | 182 | 131 | 23 | 20 | 4 | 0 | 4 | 198 | 181 | 10 | 7 |
| District of Columbia | 146 | 58 | 30 | 22 | 1 | 3 | 2 | 0 | 88 | 81 | 6 | 1 |
| Virginia | 330 | 171 | 153 | 10 | 6 | 2 | 0 | 0 | 159 | 142 | 12 | 5 |
| West Virginia | 204 | 128 | 64 | 35 | 26 | 2 | 0 | 1 | 76 | 73 | 1 | 2 |
| North Carolina | 315 | 183 | 161 | 15 | 6 | 0 | 0 | 1 | 132 | 121 | 6 | 5 |
| South Carolina | 126 | 85 | 74 | 8 | 2 | 0 | 0 | 1 | 41 | 37 | 2 | 2 |
| Georgia | 364 | 190 | 143 | 32 | 13 | 2 | 0 | 0 | 174 | 156 | 11 | 7 |
| Florida | 787 | 506 | 363 | 88 | 46 | 6 | 0 | 3 | 281 | 253 | 15 | 13 |
| East South Central | 1,364 | 833 | 564 | 159 | 79 | 15 | 1 | 15 | 531 | 486 | 27 | 18 |
| Kentucky | 330 | 193 | 93 | 57 | 34 | 8 | 0 | 1 | 137 | 124 | 7 | 6 |
| Tennessee | 568 | 353 | 275 | 46 | 22 | 2 | 0 | 8 | 215 | 202 | 9 | 4 |
| Alabama | 344 | 215 | 136 | 47 | 21 | 5 | 1 | 5 | 129 | 115 | 8 | 6 |
| Mississippi | 122 | 72 | 60 | 9 | 2 | 0 | 0 | 1 | 50 | 45 | 3 | 2 |
| West South Central | 1,719 | 1,027 | 731 | 168 | 79 | 31 | 3 | 15 | 692 | 603 | 39 | 50 |
| Arkansas | 198 | 117 | 108 | 9 | 0 | 0 | 0 | 0 | 81 | 67 | 7 | 7 |
| Louisiana | 442 | 306 | 165 | 77 | 43 | 7 | 1 | 13 | 136 | 120 | 8 | 8 |
| Oklahoma | 167 | 76 | 56 | 10 | 6 | 4 | 0 | 0 | 91 | 78 | 3 | 10 |
| Texas | 912 | 528 | 402 | 72 | 30 | 20 | 2 | 2 | 384 | 338 | 21 | 25 |
| Mountain | 1,050 | 591 | 413 | 95 | 54 | 11 | 2 | 16 | 459 | 365 | 54 | 40 |
| Montana | 110 | 58 | 32 | 9 | 9 | 4 | 0 | 4 | 52 | 30 | 13 | 9 |
| Idaho | 100 | 51 | 46 | 3 | 2 | 0 | 0 | 0 | 49 | 36 | 7 | 6 |
| Wyoming | 42 | 26 | 15 | 3 | 7 | 1 | 0 | 0 | 16 | 12 | 2 | 2 |
| Colorado | 323 | 183 | 129 | 35 | 10 | 3 | 1 | 5 | 140 | 115 | 14 | 11 |
| New Mexico | 125 | 85 | 59 | 15 | 8 | 0 | 0 | 3 | 40 | 30 | 7 | 3 |
| Arizona | 177 | 101 | 59 | 25 | 10 | 3 | 1 | 3 | 76 | 62 | 8 | 6 |
| Utah | 85 | 36 | 28 | 3 | 4 | 0 | 0 | 1 | 49 | 46 | 1 | 2 |
| Nevada | 88 | 51 | 45 | 2 | 4 | 0 | 0 | 0 | 37 | 34 | 2 | 1 |
| Pacific | 3,540 | 2,030 | 1,191 | 464 | 231 | 54 | 15 | 75 | 1,510 | 1,153 | 228 | 129 |
| Washington | 353 | 180 | 110 | 35 | 19 | 7 | 0 | 9 | 173 | 110 | 36 | 27 |
| Oregon | 246 | 123 | 89 | 17 | 11 | 3 | 0 | 3 | 123 | 79 | 23 | 21 |
| California | 2,941 | 1,727 | 992 | 412 | 201 | 44 | 15 | 63 | 1,214 | 964 | 169 | 81 |
| Outlying areas | 740 | 356 | 287 | 46 | 16 | 4 | 1 | 2 | 384 | 334 | 30 | 20 |
| Alaska | 55 | 25 | 16 | 7 | 1 | 1 | 0 | 0 | 30 | 17 | 10 | 3 |
| Hawaii | 152 | 62 | 44 | 5 | 8 | 3 | 1 | 1 | 90 | 74 | 9 | 7 |
| Puerto Rico | 529 | 269 | 227 | 34 | 7 | 0 | 0 | 1 | 260 | 240 | 10 | 10 |
| Virgin Islands | 4 | 0 | 0 | 0 | 0 | 0 | 0 | 0 | 4 | 3 | 1 | 0 |
- 1 The States are grouped according to the method used by the Bureau of the Census, U.S. Department of Commerce.
- 2 See table 1, footnote 1, for definitions of types of cases.
690 of 690 figures sit in a row or column sum that works out.
Reader’s notes
p. 181. The crop ends after the Kansas row; the table continues on the following page (South Atlantic and later divisions), and the footnote texts for markers 1 and 2 are not printed on this image, so `footnotes` is empty. Two cells are printed with a gap where the thousands comma should be, and I have written them with a comma: "East North Central" / "All cases" is printed "5 735" (written 5,735) and "Illinois" / "All C cases" is printed "1 005" (written 1,005). In both cases the comma appears to have dropped out in printing or scanning; the row and column arithmetic confirms the intended values. I verified the arithmetic throughout as a check on column placement: every state row's "All C cases" equals the sum of its CA–CP cells, every "All R cases" equals RC+RM+RD, "All cases" equals All C + All R, and each division line equals the sum of its member states. All of these reconcile exactly, including the Total line (14,166 + 11,116 = 25,282). One value worth flagging even though it reconciles: Rhode Island shows 11 in CE, which is unusually large next to the national CE total of 63, but the New England CE subtotal of 14 only balances with that 11 included, so it is transcribed as printed. The scan renders some letterforms imperfectly (e.g. the "Unfair labor practice cases" spanner and the dotted "i" in several state names); headings and labels are given in their correct spelling.
p. 182. The crop continues a table from the preceding page: no column headings are printed on this image, so header_rows is empty. The grid has 13 columns (stub + 12 data columns), counted from the vertical column rules; the first data column after the stub is the one beginning 2,700 / 48 / 380. Verification: every state row and every regional subtotal cross-foots. In each state row, column 2 = columns 3+4+5+6+7+8, and column 1 = column 2 + column 9; each region's subtotal equals the sum of its member states in all 12 columns. No printed total appears to be in error. Two cells with a slightly irregular impression in the scan, both confirmed by the cross-foots: South Carolina, column 10 (37, printed in a heavier face) and Montana, column 10 (30, where the final zero is broken). Footnotes: the abbreviation periods in "U.S. Department of Commerce." and the sentence-final periods of both footnotes do not render in this 1-bit scan (the text images as "U S Department of Commerce"), though the inter-word spacing indicates they are present in the original setting; I have written them as the original prints them. The row labels are followed by dashed leader rules, which have been dropped; "Outlying areas" images with the word space nearly closed up.
Source image
Source data: U.S. NLRB Annual Reports (public domain). Reconstruction by NLRB Stats Archive. Read by claude-opus-5 (effort max, prompt extract_v1) from the 300-dpi scan; stitched by page. Updated October 2026.