NLRB Stats Archive › Annual Reports › FY1963 › Median days to process representation cases
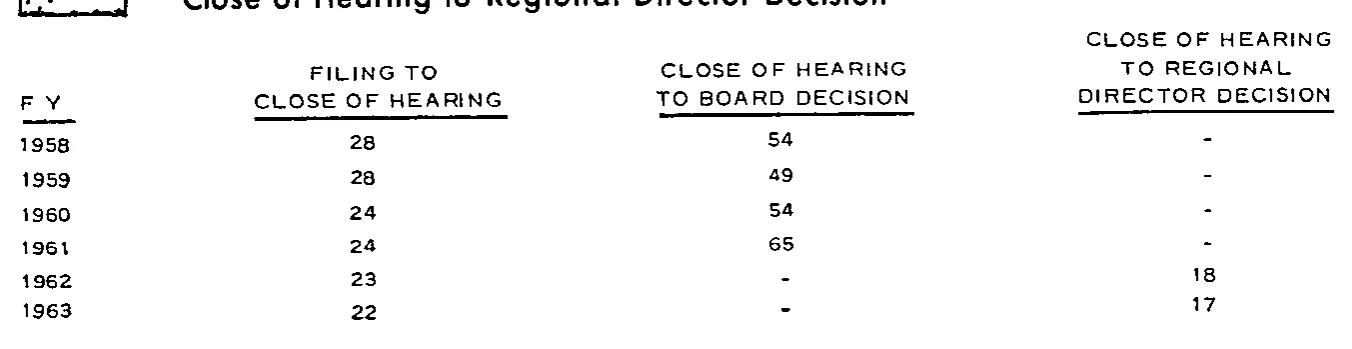
Median days to process representation cases
| F Y | FILING TO CLOSE OF HEARING | CLOSE OF HEARING TO BOARD DECISION | CLOSE OF HEARING TO REGIONAL DIRECTOR DECISION |
|---|---|---|---|
| 1958 | 28 | 54 | |
| 1959 | 28 | 49 | |
| 1960 | 24 | 54 | |
| 1961 | 24 | 65 | |
| 1962 | 23 | 18 | |
| 1963 | 22 | 17 |
0 of 12 figures sit in a row or column sum that works out.
Reader’s notes
p. 30. The crop cuts off the table/chart caption at the top: only the partial line "Close of Hearing to Regional Director Decision" and a small boxed legend/key at the upper left are visible, both clipped by the top edge; any caption text above that is not on this image. Cells rendered as "" hold a single short dash in the original: the "CLOSE OF HEARING TO BOARD DECISION" column for 1962 and 1963, and the "CLOSE OF HEARING TO REGIONAL DIRECTOR DECISION" column for 1958-1961 (these dashes mark the years for which the corresponding series does not exist, Regional Director decisions beginning in FY 1962). The stub heading is printed with a space as "F Y". All values are whole numbers (median days); no other markers or footnotes are printed on this crop.
Source image
Source data: U.S. NLRB Annual Reports (public domain). Reconstruction by NLRB Stats Archive. Read by claude-opus-5 (effort max, prompt extract_v1) from the 300-dpi scan; stitched by page. Updated October 2026.