NLRB Stats Archive › Annual Reports › FY1962 › Size of Units in Collective-Bargaining and Decertification Elections, Fiscal Year 1962
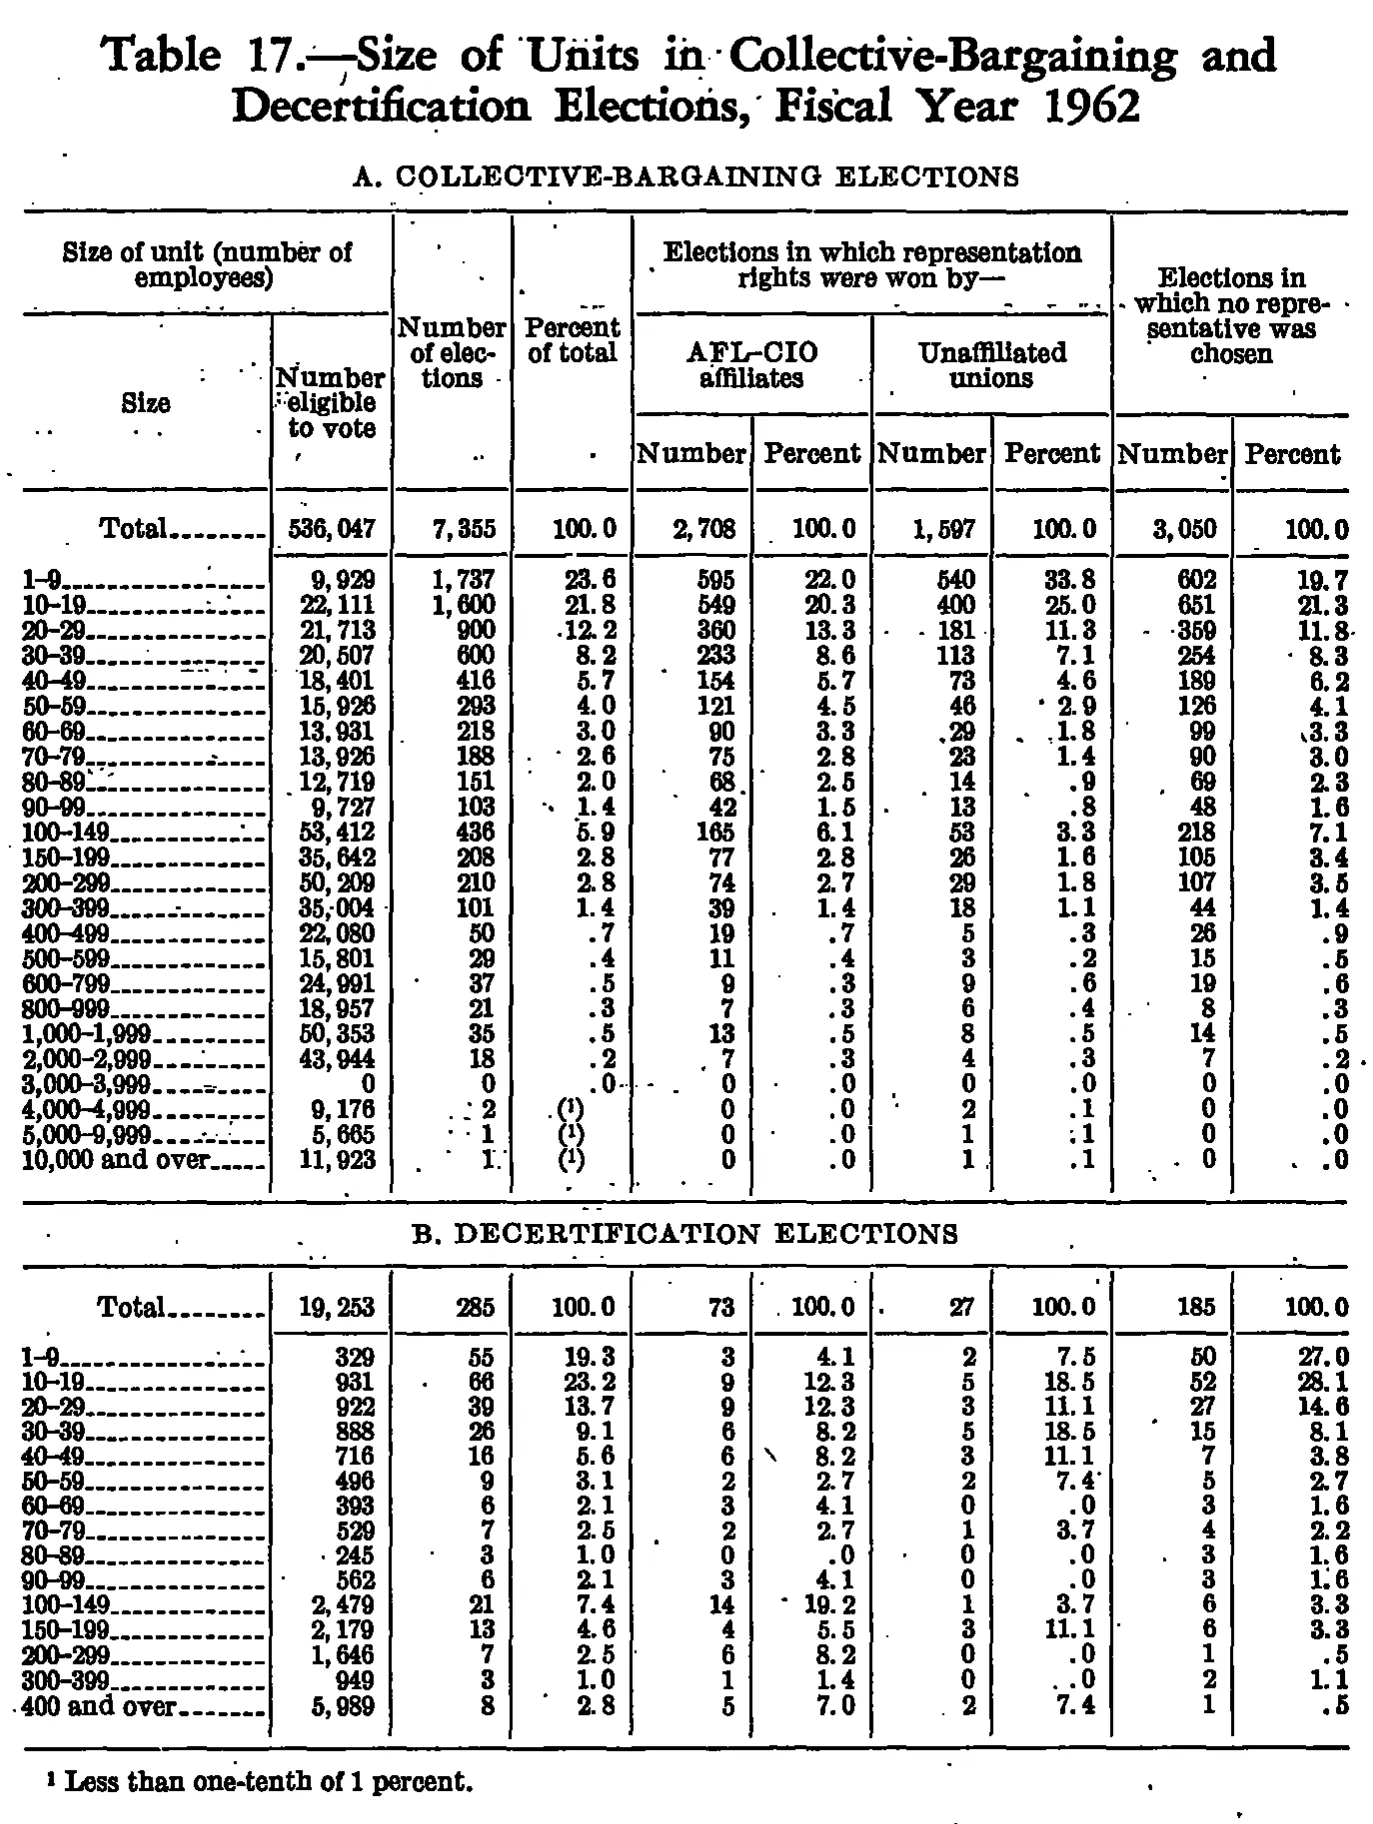
Size of Units in Collective-Bargaining and Decertification Elections, Fiscal Year 1962
| Size of unit (number of employees) | Size of unit (number of employees) | Number of elections | Percent of total | Elections in which representation rights were won by— | Elections in which no representative was chosen | ||||
|---|---|---|---|---|---|---|---|---|---|
| Size | Number eligible to vote | Number of elections | Percent of total | AFL-CIO affiliates | Unaffiliated unions | Elections in which no representative was chosen | |||
| Size | Number eligible to vote | Number of elections | Percent of total | Number | Percent | Number | Percent | Number | Percent |
| A. COLLECTIVE-BARGAINING ELECTIONS | |||||||||
| Total | 536,047 | 7,355 | 100.0 | 2,708 | 100.0 | 1,597 | 100.0 | 3,050 | 100.0 |
| 1-9 | 9,929 | 1,737 | 23.6 | 595 | 22.0 | 540 | 33.8 | 602 | 19.7 |
| 10-19 | 22,111 | 1,600 | 21.8 | 549 | 20.3 | 400 | 25.0 | 651 | 21.3 |
| 20-29 | 21,713 | 900 | 12.2 | 360 | 13.3 | 181 | 11.3 | 359 | 11.8 |
| 30-39 | 20,507 | 600 | 8.2 | 233 | 8.6 | 113 | 7.1 | 254 | 8.3 |
| 40-49 | 18,401 | 416 | 5.7 | 154 | 5.7 | 73 | 4.6 | 189 | 6.2 |
| 50-59 | 15,926 | 293 | 4.0 | 121 | 4.5 | 46 | 2.9 | 126 | 4.1 |
| 60-69 | 13,931 | 218 | 3.0 | 90 | 3.3 | 29 | 1.8 | 99 | 3.3 |
| 70-79 | 13,926 | 188 | 2.6 | 75 | 2.8 | 23 | 1.4 | 90 | 3.0 |
| 80-89 | 12,719 | 151 | 2.0 | 68 | 2.5 | 14 | .9 | 69 | 2.3 |
| 90-99 | 9,727 | 103 | 1.4 | 42 | 1.5 | 13 | .8 | 48 | 1.6 |
| 100-149 | 53,412 | 436 | 5.9 | 165 | 6.1 | 53 | 3.3 | 218 | 7.1 |
| 150-199 | 35,642 | 208 | 2.8 | 77 | 2.8 | 26 | 1.6 | 105 | 3.4 |
| 200-299 | 50,209 | 210 | 2.8 | 74 | 2.7 | 29 | 1.8 | 107 | 3.5 |
| 300-399 | 35,004 | 101 | 1.4 | 39 | 1.4 | 18 | 1.1 | 44 | 1.4 |
| 400-499 | 22,080 | 50 | .7 | 19 | .7 | 5 | .3 | 26 | .9 |
| 500-599 | 15,801 | 29 | .4 | 11 | .4 | 3 | .2 | 15 | .5 |
| 600-799 | 24,991 | 37 | .5 | 9 | .3 | 9 | .6 | 19 | .6 |
| 800-999 | 18,957 | 21 | .3 | 7 | .3 | 6 | .4 | 8 | .3 |
| 1,000-1,999 | 50,353 | 35 | .5 | 13 | .5 | 8 | .5 | 14 | .5 |
| 2,000-2,999 | 43,944 | 18 | .2 | 7 | .3 | 4 | .3 | 7 | .2 |
| 3,000-3,999 | 0 | 0 | .0 | 0 | .0 | 0 | .0 | 0 | .0 |
| 4,000-4,999 | 9,176 | 2 | 0 | .0 | 2 | .1 | 0 | .0 | |
| 5,000-9,999 | 5,665 | 1 | 0 | .0 | 1 | .1 | 0 | .0 | |
| 10,000 and over | 11,923 | 1 | 0 | .0 | 1 | .1 | 0 | .0 | |
| B. DECERTIFICATION ELECTIONS | |||||||||
| Total | 19,253 | 285 | 100.0 | 73 | 100.0 | 27 | 100.0 | 185 | 100.0 |
| 1-9 | 329 | 55 | 19.3 | 3 | 4.1 | 2 | 7.5 | 50 | 27.0 |
| 10-19 | 931 | 66 | 23.2 | 9 | 12.3 | 5 | 18.5 | 52 | 28.1 |
| 20-29 | 922 | 39 | 13.7 | 9 | 12.3 | 3 | 11.1 | 27 | 14.6 |
| 30-39 | 888 | 26 | 9.1 | 6 | 8.2 | 5 | 18.5 | 15 | 8.1 |
| 40-49 | 716 | 16 | 5.6 | 6 | 8.2 | 3 | 11.1 | 7 | 3.8 |
| 50-59 | 496 | 9 | 3.1 | 2 | 2.7 | 2 | 7.4 | 5 | 2.7 |
| 60-69 | 393 | 6 | 2.1 | 3 | 4.1 | 0 | .0 | 3 | 1.6 |
| 70-79 | 529 | 7 | 2.5 | 2 | 2.7 | 1 | 3.7 | 4 | 2.2 |
| 80-89 | 245 | 3 | 1.0 | 0 | .0 | 0 | .0 | 3 | 1.6 |
| 90-99 | 562 | 6 | 2.1 | 3 | 4.1 | 0 | .0 | 3 | 1.6 |
| 100-149 | 2,479 | 21 | 7.4 | 14 | 19.2 | 1 | 3.7 | 6 | 3.3 |
| 150-199 | 2,179 | 13 | 4.6 | 4 | 5.5 | 3 | 11.1 | 6 | 3.3 |
| 200-299 | 1,646 | 7 | 2.5 | 6 | 8.2 | 0 | .0 | 1 | .5 |
| 300-399 | 949 | 3 | 1.0 | 1 | 1.4 | 0 | .0 | 2 | 1.1 |
| 400 and over | 5,989 | 8 | 2.8 | 5 | 7.0 | 2 | 7.4 | 1 | .5 |
- 1 Less than one-tenth of 1 percent.
188 of 188 figures sit in a row or column sum that works out.
Reader’s notes
p. 294. Ten columns: stub (size class), Number eligible to vote, Number of elections, Percent of total, then Number/Percent pairs for AFL-CIO affiliates, Unaffiliated unions, and Elections in which no representative was chosen. The last two pairs sit under the spanner "Elections in which representation rights were won by—" (AFL-CIO and Unaffiliated only); "Elections in which no representative was chosen" is its own tall heading over the final Number/Percent pair. The table is one table printed as two stacked sections sharing a single set of column headings. The section line "A. COLLECTIVE-BARGAINING ELECTIONS" is printed above the column headings (between the caption and the header box); I have transcribed it as the first body row, with no values, so that each of the two "Total" rows can be identified. "B. DECERTIFICATION ELECTIONS" is printed between the two bodies and is likewise a label-only row. In section A the "Percent of total" cells for the rows 4,000-4,999, 5,000-9,999 and 10,000 and over hold a parenthesised raised 1 (a footnote reference standing in place of a value, "less than one-tenth of 1 percent"); transcribed as "(^1)". The scan carries scattered ink specks and leader-dot debris inside the number columns (for example a speck just before 12.2 in the 20-29 row of section A, and before 3.3 in the 60-69 no-representative column); these are not part of the values. Arithmetic cross-checks all hold as printed: in both sections the three "Number" columns sum to the "Number of elections" column in every row, the election counts sum to the printed totals (7,355 and 285), and the "Number eligible to vote" column sums exactly to 536,047 and 19,253. Two printed percentages are rounded down rather than to nearest: section A, 200-299, Percent of total prints 2.8 (210/7,355 = 2.86), and section B, 50-59, Percent of total prints 3.1 (9/285 = 3.16). Both are transcribed as printed.
Source image
Source data: U.S. NLRB Annual Reports (public domain). Reconstruction by NLRB Stats Archive. Read by claude-opus-5 (effort max, prompt extract_v1) from the 300-dpi scan; stitched by page. Updated October 2026.