NLRB Stats Archive › Annual Reports › FY1962 › Disposition of Representation Cases Closed, Fiscal Year 1962
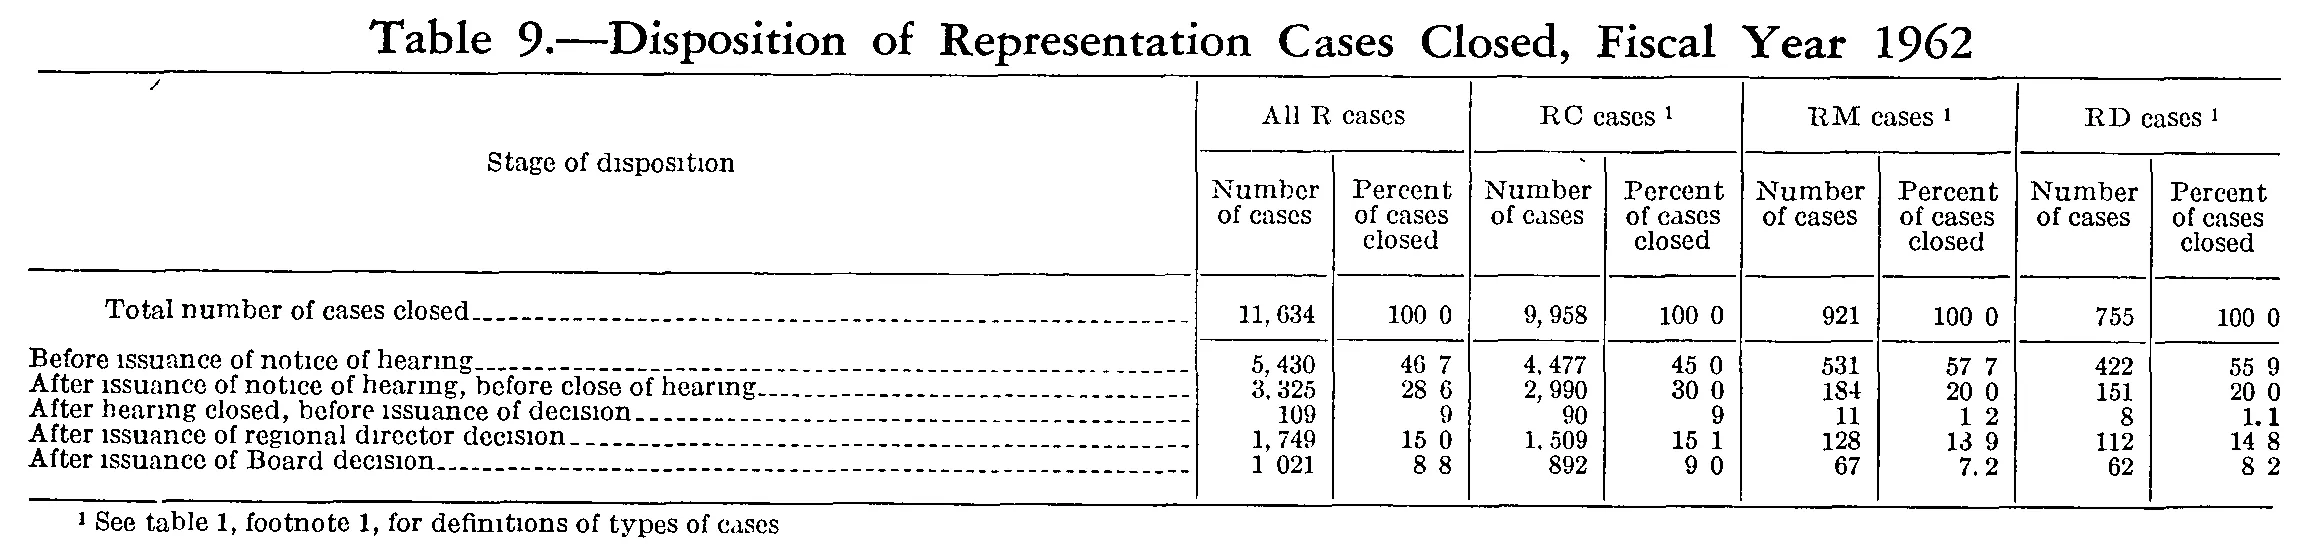
Disposition of Representation Cases Closed, Fiscal Year 1962
| Stage of disposition | All R cases | RC cases | RM cases | RD cases | ||||
|---|---|---|---|---|---|---|---|---|
| Stage of disposition | Number of cases | Percent of cases closed | Number of cases | Percent of cases closed | Number of cases | Percent of cases closed | Number of cases | Percent of cases closed |
| Total number of cases closed | 11,634 | 100.0 | 9,958 | 100.0 | 921 | 100.0 | 755 | 100.0 |
| Before issuance of notice of hearing | 5,430 | 46.7 | 4,477 | 45.0 | 531 | 57.7 | 422 | 55.9 |
| After issuance of notice of hearing, before close of hearing | 3,325 | 28.6 | 2,990 | 30.0 | 184 | 20.0 | 151 | 20.0 |
| After hearing closed, before issuance of decision | 109 | .9 | 90 | .9 | 11 | 1.2 | 8 | 1.1 |
| After issuance of regional director decision | 1,749 | 15.0 | 1,509 | 15.1 | 128 | 13.9 | 112 | 14.8 |
| After issuance of Board decision | 1,021 | 8.8 | 892 | 9.0 | 67 | 7.2 | 62 | 8.2 |
- 1 See table 1, footnote 1, for definitions of types of cases
24 of 24 figures sit in a row or column sum that works out.
Reader’s notes
p. 285. Nine columns: stub plus four two-column panels (All R, RC, RM, RD), each with "Number of cases" and "Percent of cases closed". Decimal points in the percent columns are largely lost in this 1-bit scan: most percent cells render as a digit group, a gap, then one digit (e.g. "100 0", "46 7", "8 2"), while a few cells in the same columns still show a legible period ("1.1" in RD, "7.2" in RM). I have written the period in every percent cell, treating the missing ones as scan dropout rather than as printed spaces. The two cells in the "After hearing closed, before issuance of decision" row under All R percent and RC percent show only a single "9" sitting in the decimal position; I read these as ".9" (leading period dropped by the scan), the house style of the era for values under 1. If a strictly literal rendering is wanted, those cells are ambiguous between ".9" and "9". Similarly, the thousands comma in the All R "After issuance of Board decision" cell is faint and renders as "1 021"; transcribed as "1,021". Both readings are supported by arithmetic: each panel's five stage figures sum exactly to its printed total (11,634 / 9,958 / 921 / 755) and each panel's percents sum to 100.0 only if the small cells are .9, .9, 1.2 and 1.1. No printed value appears to be a misprint, and no part of the table is cut off by the crop.
Source image
Source data: U.S. NLRB Annual Reports (public domain). Reconstruction by NLRB Stats Archive. Read by claude-opus-5 (effort max, prompt extract_v1) from the 300-dpi scan; stitched by page. Updated October 2026.