NLRB Stats Archive › Annual Reports › FY1962 › Geographic Distribution of Unfair Labor Practice and Representation Cases Received, Fiscal Year 1962
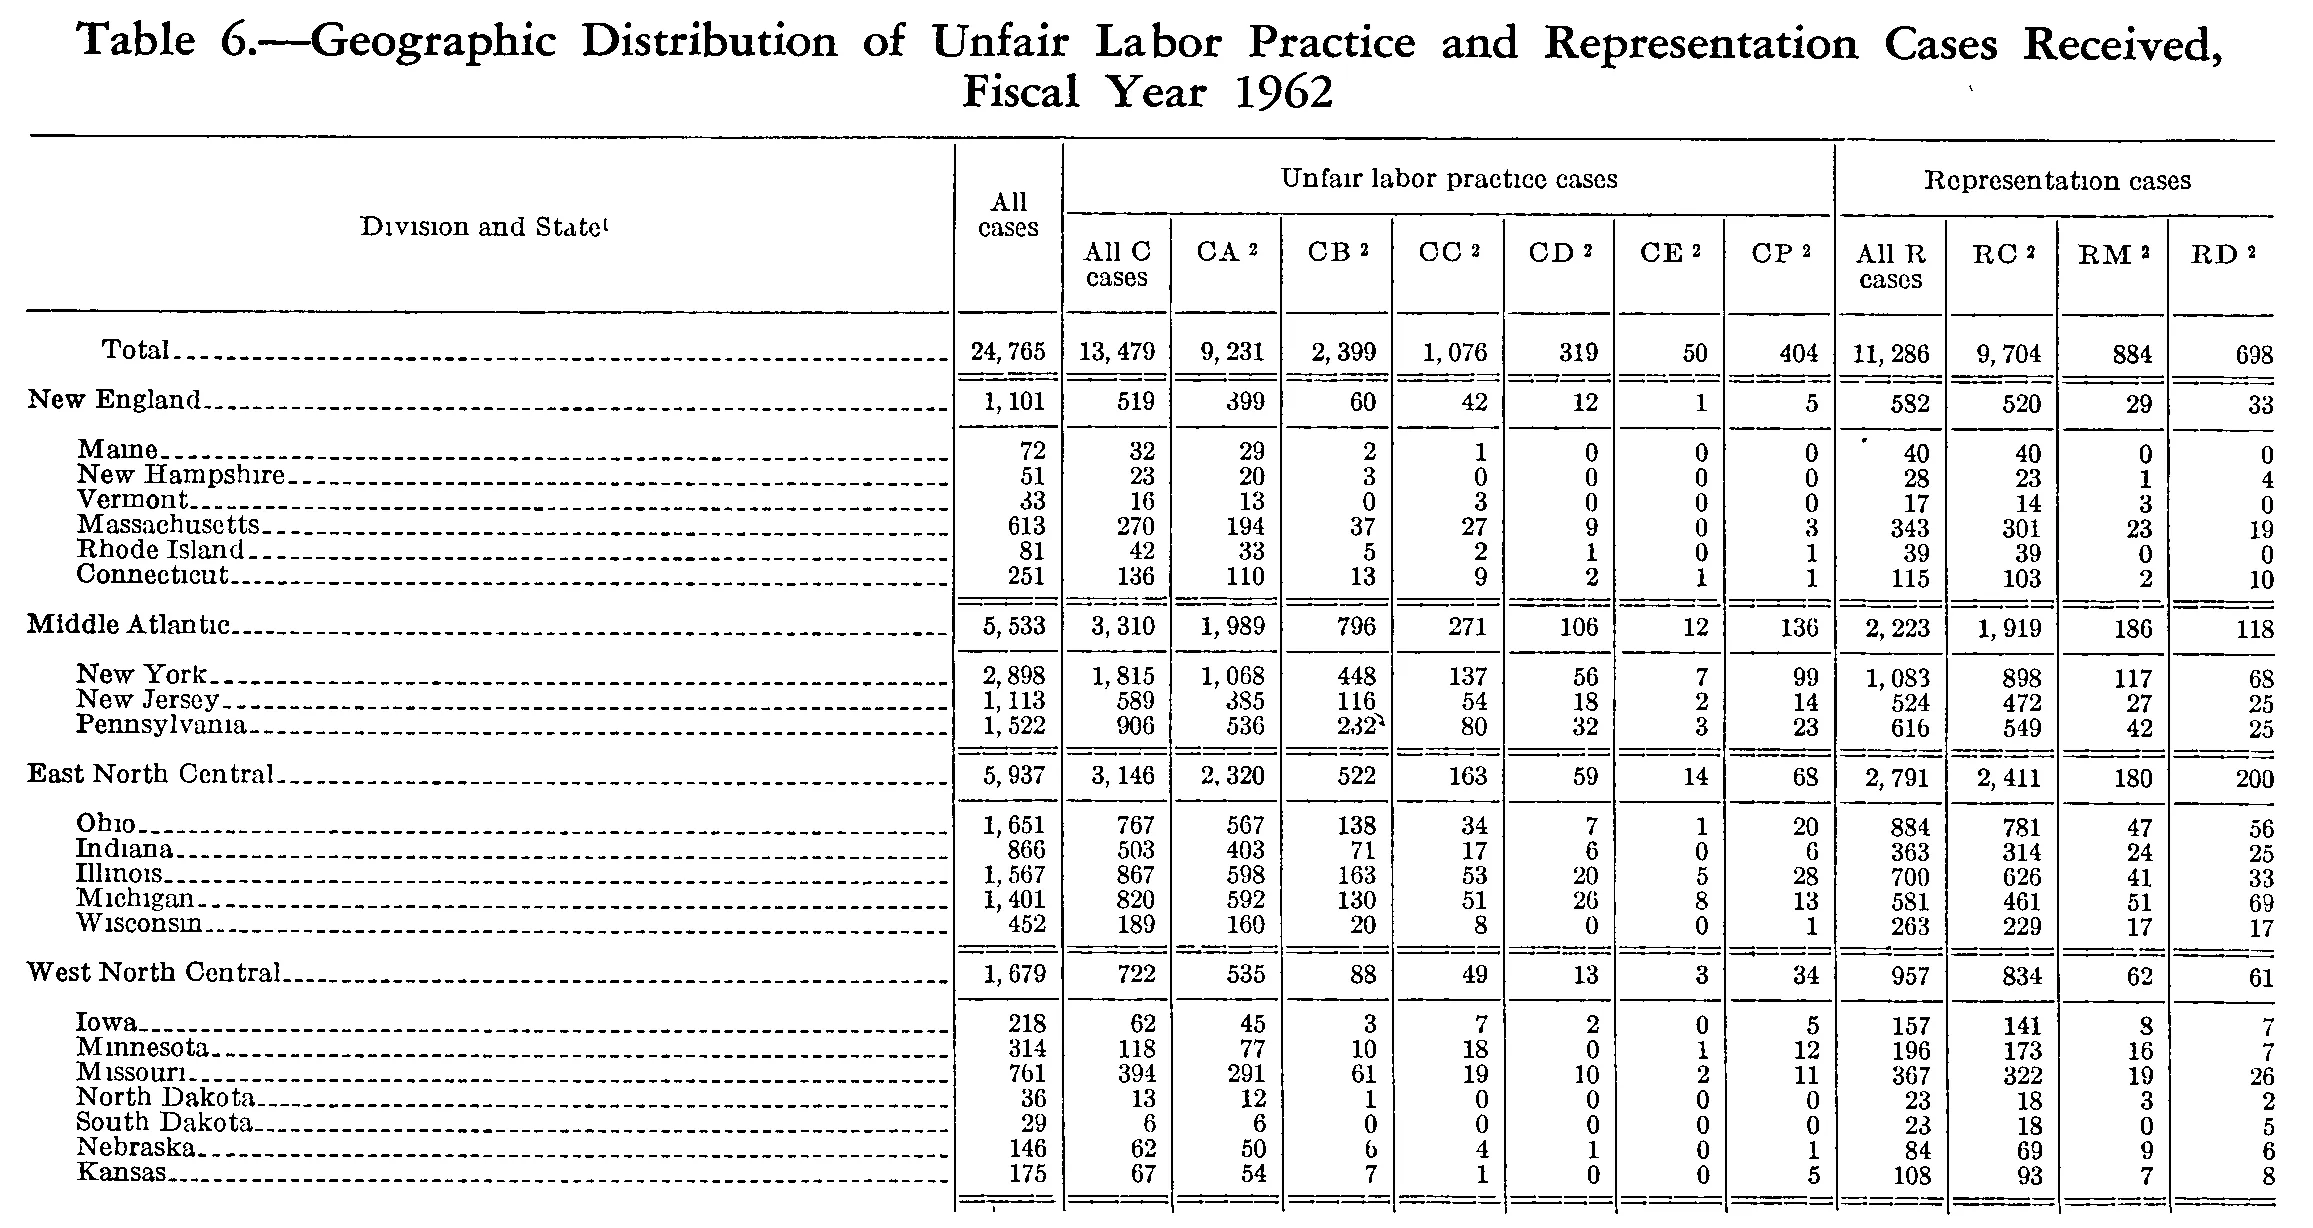
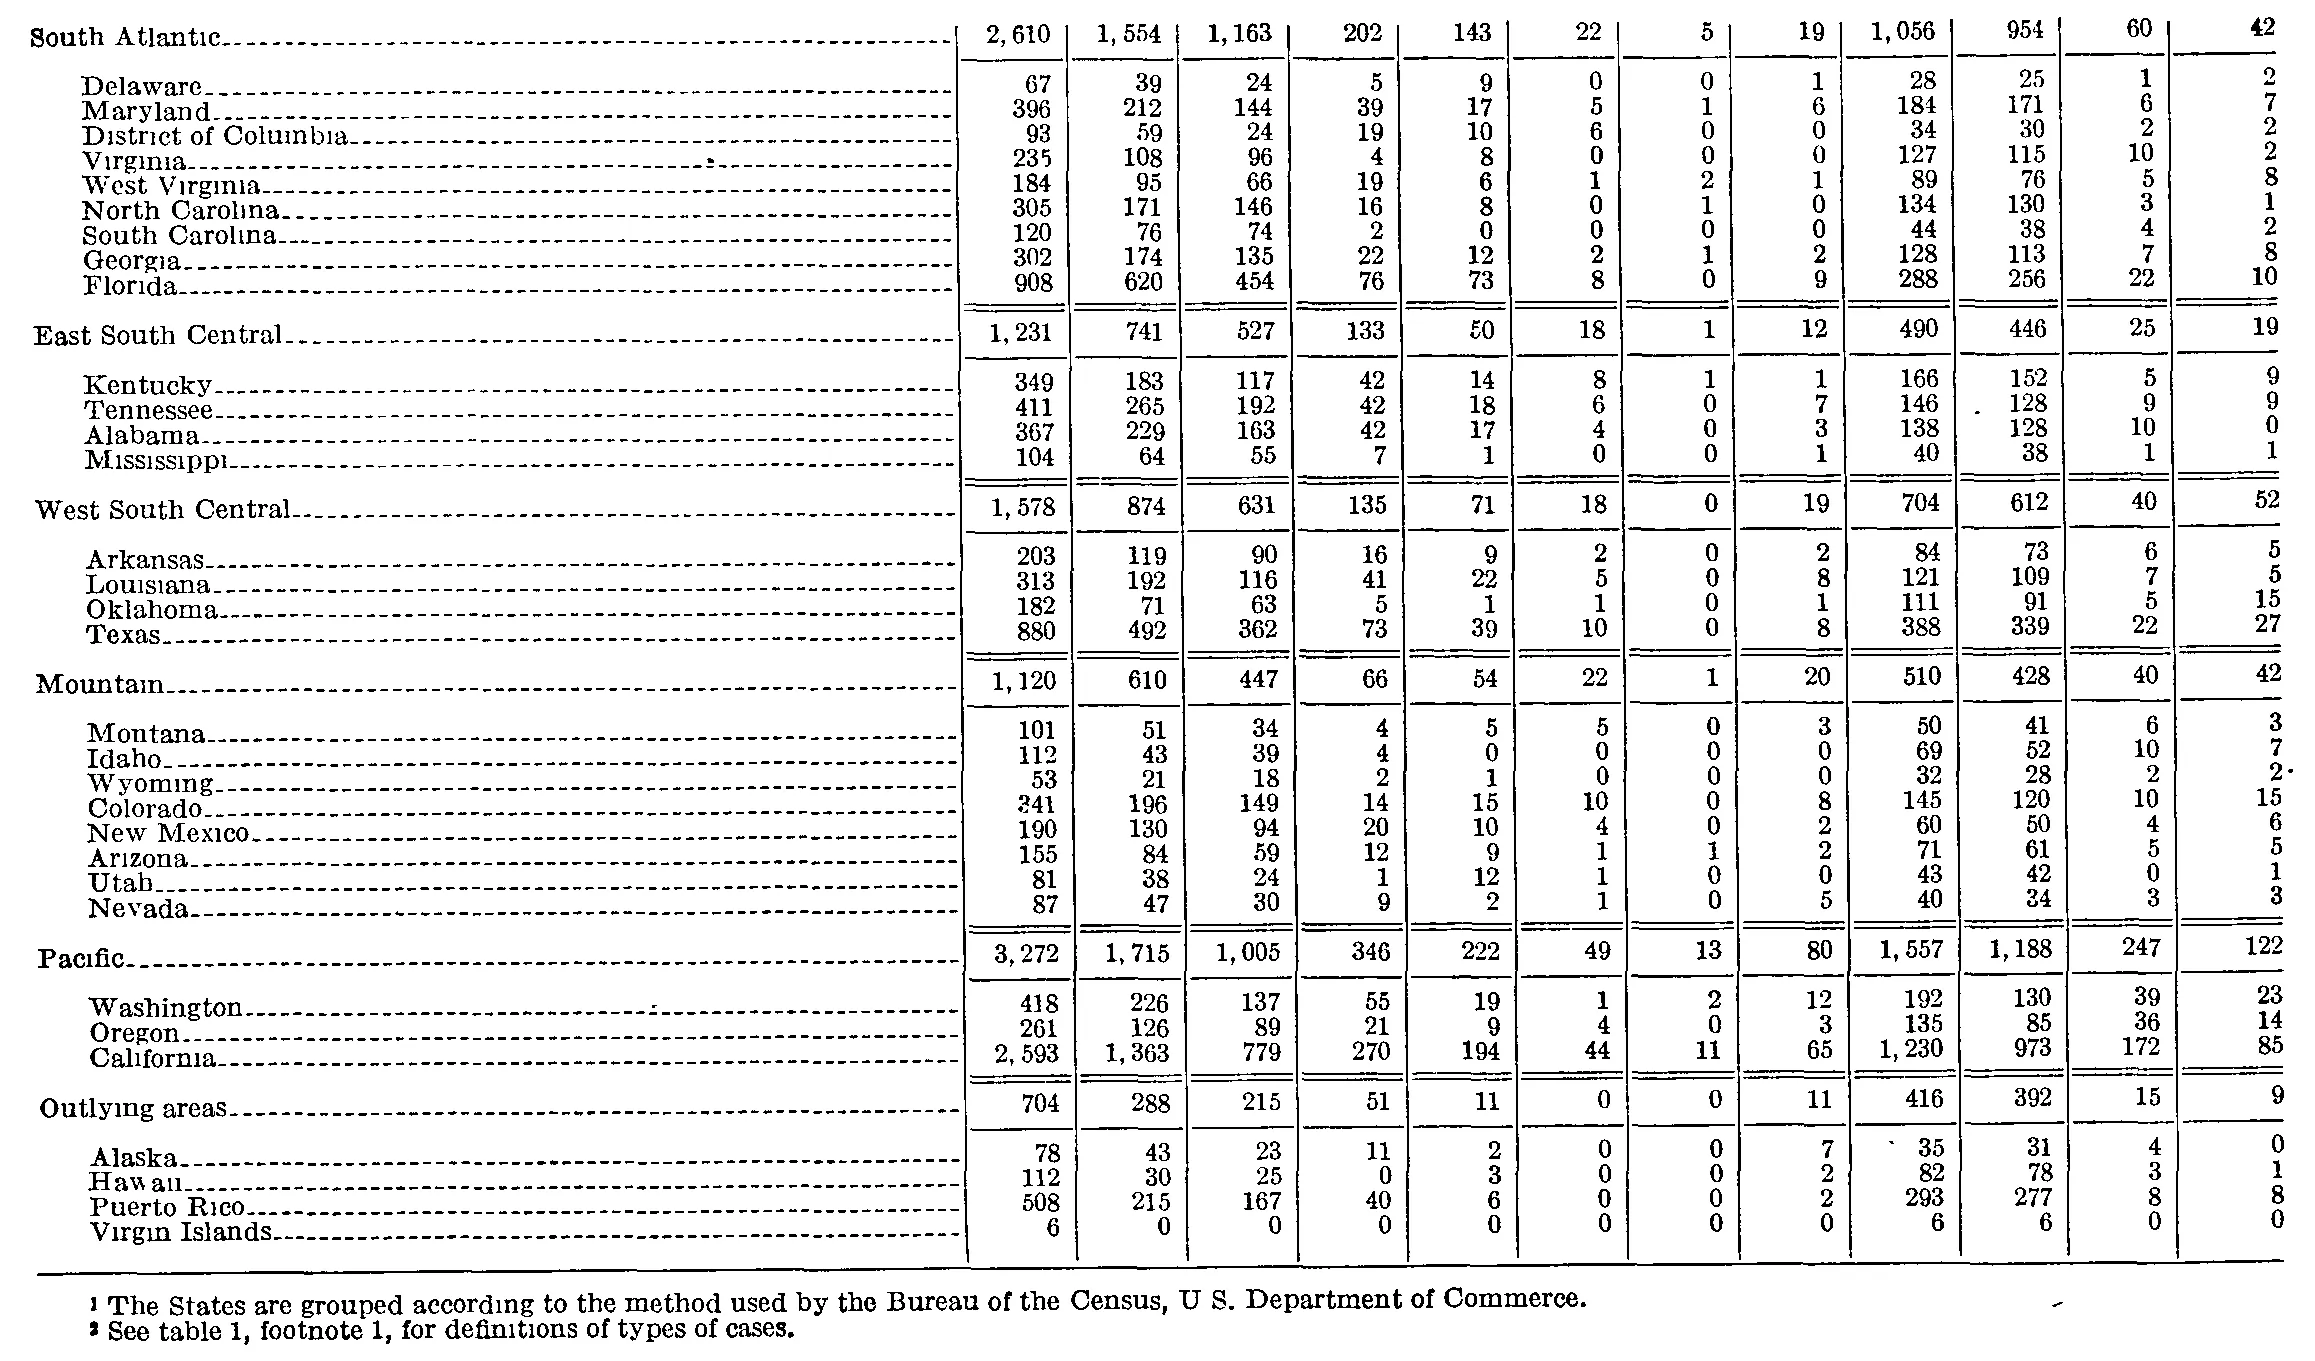
Geographic Distribution of Unfair Labor Practice and Representation Cases Received, Fiscal Year 1962
Stitched from pp. 281–282.
| Division and State | All cases | Unfair labor practice cases | Representation cases | |||||||||
|---|---|---|---|---|---|---|---|---|---|---|---|---|
| Division and State | All cases | All C cases | CA | CB | CC | CD | CE | CP | All R cases | RC | RM | RD |
| Total | 24,765 | 13,479 | 9,231 | 2,399 | 1,076 | 319 | 50 | 404 | 11,286 | 9,704 | 884 | 698 |
| New England | 1,101 | 519 | 399 | 60 | 42 | 12 | 1 | 5 | 582 | 520 | 29 | 33 |
| Maine | 72 | 32 | 29 | 2 | 1 | 0 | 0 | 0 | 40 | 40 | 0 | 0 |
| New Hampshire | 51 | 23 | 20 | 3 | 0 | 0 | 0 | 0 | 28 | 23 | 1 | 4 |
| Vermont | 33 | 16 | 13 | 0 | 3 | 0 | 0 | 0 | 17 | 14 | 3 | 0 |
| Massachusetts | 613 | 270 | 194 | 37 | 27 | 9 | 0 | 3 | 343 | 301 | 23 | 19 |
| Rhode Island | 81 | 42 | 33 | 5 | 2 | 1 | 0 | 1 | 39 | 39 | 0 | 0 |
| Connecticut | 251 | 136 | 110 | 13 | 9 | 2 | 1 | 1 | 115 | 103 | 2 | 10 |
| Middle Atlantic | 5,533 | 3,310 | 1,989 | 796 | 271 | 106 | 12 | 136 | 2,223 | 1,919 | 186 | 118 |
| New York | 2,898 | 1,815 | 1,068 | 448 | 137 | 56 | 7 | 99 | 1,083 | 898 | 117 | 68 |
| New Jersey | 1,113 | 589 | 385 | 116 | 54 | 18 | 2 | 14 | 524 | 472 | 27 | 25 |
| Pennsylvania | 1,522 | 906 | 536 | 232 | 80 | 32 | 3 | 23 | 616 | 549 | 42 | 25 |
| East North Central | 5,937 | 3,146 | 2,320 | 522 | 163 | 59 | 14 | 68 | 2,791 | 2,411 | 180 | 200 |
| Ohio | 1,651 | 767 | 567 | 138 | 34 | 7 | 1 | 20 | 884 | 781 | 47 | 56 |
| Indiana | 866 | 503 | 403 | 71 | 17 | 6 | 0 | 6 | 363 | 314 | 24 | 25 |
| Illinois | 1,567 | 867 | 598 | 163 | 53 | 20 | 5 | 28 | 700 | 626 | 41 | 33 |
| Michigan | 1,401 | 820 | 592 | 130 | 51 | 26 | 8 | 13 | 581 | 461 | 51 | 69 |
| Wisconsin | 452 | 189 | 160 | 20 | 8 | 0 | 0 | 1 | 263 | 229 | 17 | 17 |
| West North Central | 1,679 | 722 | 535 | 88 | 49 | 13 | 3 | 34 | 957 | 834 | 62 | 61 |
| Iowa | 218 | 62 | 45 | 3 | 7 | 2 | 0 | 5 | 157 | 141 | 8 | 7 |
| Minnesota | 314 | 118 | 77 | 10 | 18 | 0 | 1 | 12 | 196 | 173 | 16 | 7 |
| Missouri | 761 | 394 | 291 | 61 | 19 | 10 | 2 | 11 | 367 | 322 | 19 | 26 |
| North Dakota | 36 | 13 | 12 | 1 | 0 | 0 | 0 | 0 | 23 | 18 | 3 | 2 |
| South Dakota | 29 | 6 | 6 | 0 | 0 | 0 | 0 | 0 | 23 | 18 | 0 | 5 |
| Nebraska | 146 | 62 | 50 | 6 | 4 | 1 | 0 | 1 | 84 | 69 | 9 | 6 |
| Kansas | 175 | 67 | 54 | 7 | 1 | 0 | 0 | 5 | 108 | 93 | 7 | 8 |
| South Atlantic | 2,610 | 1,554 | 1,163 | 202 | 143 | 22 | 5 | 19 | 1,056 | 954 | 60 | 42 |
| Delaware | 67 | 39 | 24 | 5 | 9 | 0 | 0 | 1 | 28 | 25 | 1 | 2 |
| Maryland | 396 | 212 | 144 | 39 | 17 | 5 | 1 | 6 | 184 | 171 | 6 | 7 |
| District of Columbia | 93 | 59 | 24 | 19 | 10 | 6 | 0 | 0 | 34 | 30 | 2 | 2 |
| Virginia | 235 | 108 | 96 | 4 | 8 | 0 | 0 | 0 | 127 | 115 | 10 | 2 |
| West Virginia | 184 | 95 | 66 | 19 | 6 | 1 | 2 | 1 | 89 | 76 | 5 | 8 |
| North Carolina | 305 | 171 | 146 | 16 | 8 | 0 | 1 | 0 | 134 | 130 | 3 | 1 |
| South Carolina | 120 | 76 | 74 | 2 | 0 | 0 | 0 | 0 | 44 | 38 | 4 | 2 |
| Georgia | 302 | 174 | 135 | 22 | 12 | 2 | 1 | 2 | 128 | 113 | 7 | 8 |
| Florida | 908 | 620 | 454 | 76 | 73 | 8 | 0 | 9 | 288 | 256 | 22 | 10 |
| East South Central | 1,231 | 741 | 527 | 133 | 50 | 18 | 1 | 12 | 490 | 446 | 25 | 19 |
| Kentucky | 349 | 183 | 117 | 42 | 14 | 8 | 1 | 1 | 166 | 152 | 5 | 9 |
| Tennessee | 411 | 265 | 192 | 42 | 18 | 6 | 0 | 7 | 146 | 128 | 9 | 9 |
| Alabama | 367 | 229 | 163 | 42 | 17 | 4 | 0 | 3 | 138 | 128 | 10 | 0 |
| Mississippi | 104 | 64 | 55 | 7 | 1 | 0 | 0 | 1 | 40 | 38 | 1 | 1 |
| West South Central | 1,578 | 874 | 631 | 135 | 71 | 18 | 0 | 19 | 704 | 612 | 40 | 52 |
| Arkansas | 203 | 119 | 90 | 16 | 9 | 2 | 0 | 2 | 84 | 73 | 6 | 5 |
| Louisiana | 313 | 192 | 116 | 41 | 22 | 5 | 0 | 8 | 121 | 109 | 7 | 5 |
| Oklahoma | 182 | 71 | 63 | 5 | 1 | 1 | 0 | 1 | 111 | 91 | 5 | 15 |
| Texas | 880 | 492 | 362 | 73 | 39 | 10 | 0 | 8 | 388 | 339 | 22 | 27 |
| Mountain | 1,120 | 610 | 447 | 66 | 54 | 22 | 1 | 20 | 510 | 428 | 40 | 42 |
| Montana | 101 | 51 | 34 | 4 | 5 | 5 | 0 | 3 | 50 | 41 | 6 | 3 |
| Idaho | 112 | 43 | 39 | 4 | 0 | 0 | 0 | 0 | 69 | 52 | 10 | 7 |
| Wyoming | 53 | 21 | 18 | 2 | 1 | 0 | 0 | 0 | 32 | 28 | 2 | 2 |
| Colorado | 341 | 196 | 149 | 14 | 15 | 10 | 0 | 8 | 145 | 120 | 10 | 15 |
| New Mexico | 190 | 130 | 94 | 20 | 10 | 4 | 0 | 2 | 60 | 50 | 4 | 6 |
| Arizona | 155 | 84 | 59 | 12 | 9 | 1 | 1 | 2 | 71 | 61 | 5 | 5 |
| Utah | 81 | 38 | 24 | 1 | 12 | 1 | 0 | 0 | 43 | 42 | 0 | 1 |
| Nevada | 87 | 47 | 30 | 9 | 2 | 1 | 0 | 5 | 40 | 34 | 3 | 3 |
| Pacific | 3,272 | 1,715 | 1,005 | 346 | 222 | 49 | 13 | 80 | 1,557 | 1,188 | 247 | 122 |
| Washington | 418 | 226 | 137 | 55 | 19 | 1 | 2 | 12 | 192 | 130 | 39 | 23 |
| Oregon | 261 | 126 | 89 | 21 | 9 | 4 | 0 | 3 | 135 | 85 | 36 | 14 |
| California | 2,593 | 1,363 | 779 | 270 | 194 | 44 | 11 | 65 | 1,230 | 973 | 172 | 85 |
| Outlying areas | 704 | 288 | 215 | 51 | 11 | 0 | 0 | 11 | 416 | 392 | 15 | 9 |
| Alaska | 78 | 43 | 23 | 11 | 2 | 0 | 0 | 7 | 35 | 31 | 4 | 0 |
| Hawaii | 112 | 30 | 25 | 0 | 3 | 0 | 0 | 2 | 82 | 78 | 3 | 1 |
| Puerto Rico | 508 | 215 | 167 | 40 | 6 | 0 | 0 | 2 | 293 | 277 | 8 | 8 |
| Virgin Islands | 6 | 0 | 0 | 0 | 0 | 0 | 0 | 0 | 6 | 6 | 0 | 0 |
- 1 The States are grouped according to the method used by the Bureau of the Census, U.S. Department of Commerce.
- 2 See table 1, footnote 1, for definitions of types of cases.
673 of 674 figures sit in a row or column sum that works out. 3 cells break a sum: 'Iowa', column 10: prints 157, columns 11 to 13 add to 156; 'Iowa', column 2: prints 218, the subtotals in columns 3 to 10 add to 219; 'West North Central', column 10: prints 957, rows 'Iowa' to 'Kansas' add to 958.
Reader’s notes
p. 281. 13 columns: stub, "All cases", seven unfair-labor-practice columns, four representation columns. Crop is cut off at the bottom: the body ends with Kansas (last row of the West North Central division) and a partial rule is visible below it, so the remaining divisions (South Atlantic onward) and any footnote text continue on the next page/crop. The footnote markers 1 (on "Division and State") and 2 (on CA, CB, CC, CD, CE, CP, RC, RM, RD) are printed in the headings, but the footnote texts themselves are not on this image, so `footnotes` is empty. Doubtful cell — Iowa, "All R cases": the glyph reads as 157 at the available resolution and is transcribed as printed, but arithmetic says it should be 156 (RC 141 + RM 8 + RD 7 = 156; All cases 218 - All C 62 = 156; and the West North Central All R total of 957 less the other six states equals 156). This is either a misprint or a 6 that scans like a 7; every other cell in the table is internally consistent (all row sums and all division/column sums check out). Pennsylvania, CB column: a small stray mark sits at the upper right of "232" and could be mistaken for a superscript footnote marker; no other data cell in the table carries a marker, and the column and row sums confirm the value is 232, so it is treated as a scan artifact and not transcribed. A small stray dot appears just left of "40" in the Maine / "All R cases" cell; treated as a speck, not a marker.
p. 282. This crop is a continuation page: no column headings are printed on it, so header_rows is empty. The grid has 13 columns (stub + 12 numeric columns, read off the column rules); the last numeric column has no rule on its right-hand side but is a separate printed column. Doubtful cell: Colorado, column 1 (the first numeric column). The leading digit is broken in the scan and can be read as either 2 (241) or 3 (341); I transcribed 341 because two independent arithmetic checks require it — Colorado's own parts (196 + 145 = 341) and the Mountain division line, whose column-1 total of 1,120 is reached only with 341 (101+112+53+341+190+155+81+87). All of Colorado's other cells are confirmed by the Mountain column sums (e.g. column 3: 34+39+18+149+94+59+24+30 = 447). If a faithful-to-the-ink reading is needed, this is the one cell to re-check at full resolution. Every other row and every division subtotal cross-foots exactly (columns 3-8 sum to column 2, columns 10-12 sum to column 9, and columns 2 + 9 sum to column 1; the state lines sum to each division line in all twelve columns), so no misprints are suspected elsewhere. Minor scan artefacts that are not part of any value: a stray dot between the Tennessee entries in columns 9 and 10, a stray tick just left of 35 in the Alaska row (column 9), and a stray dot after the Wyoming entry in the last column. The table is bounded above by the start of the crop (the South Atlantic division line is the first printed row here) and ends below the Virgin Islands row with the two footnotes.
Source image
Source data: U.S. NLRB Annual Reports (public domain). Reconstruction by NLRB Stats Archive. Read by claude-opus-5 (effort max, prompt extract_v1) from the 300-dpi scan; stitched by page. Updated October 2026.