NLRB Stats Archive › Annual Reports › FY1962 › Industrial Distribution of Unfair Labor Practice and Representation Cases Received, Fiscal Year 1962
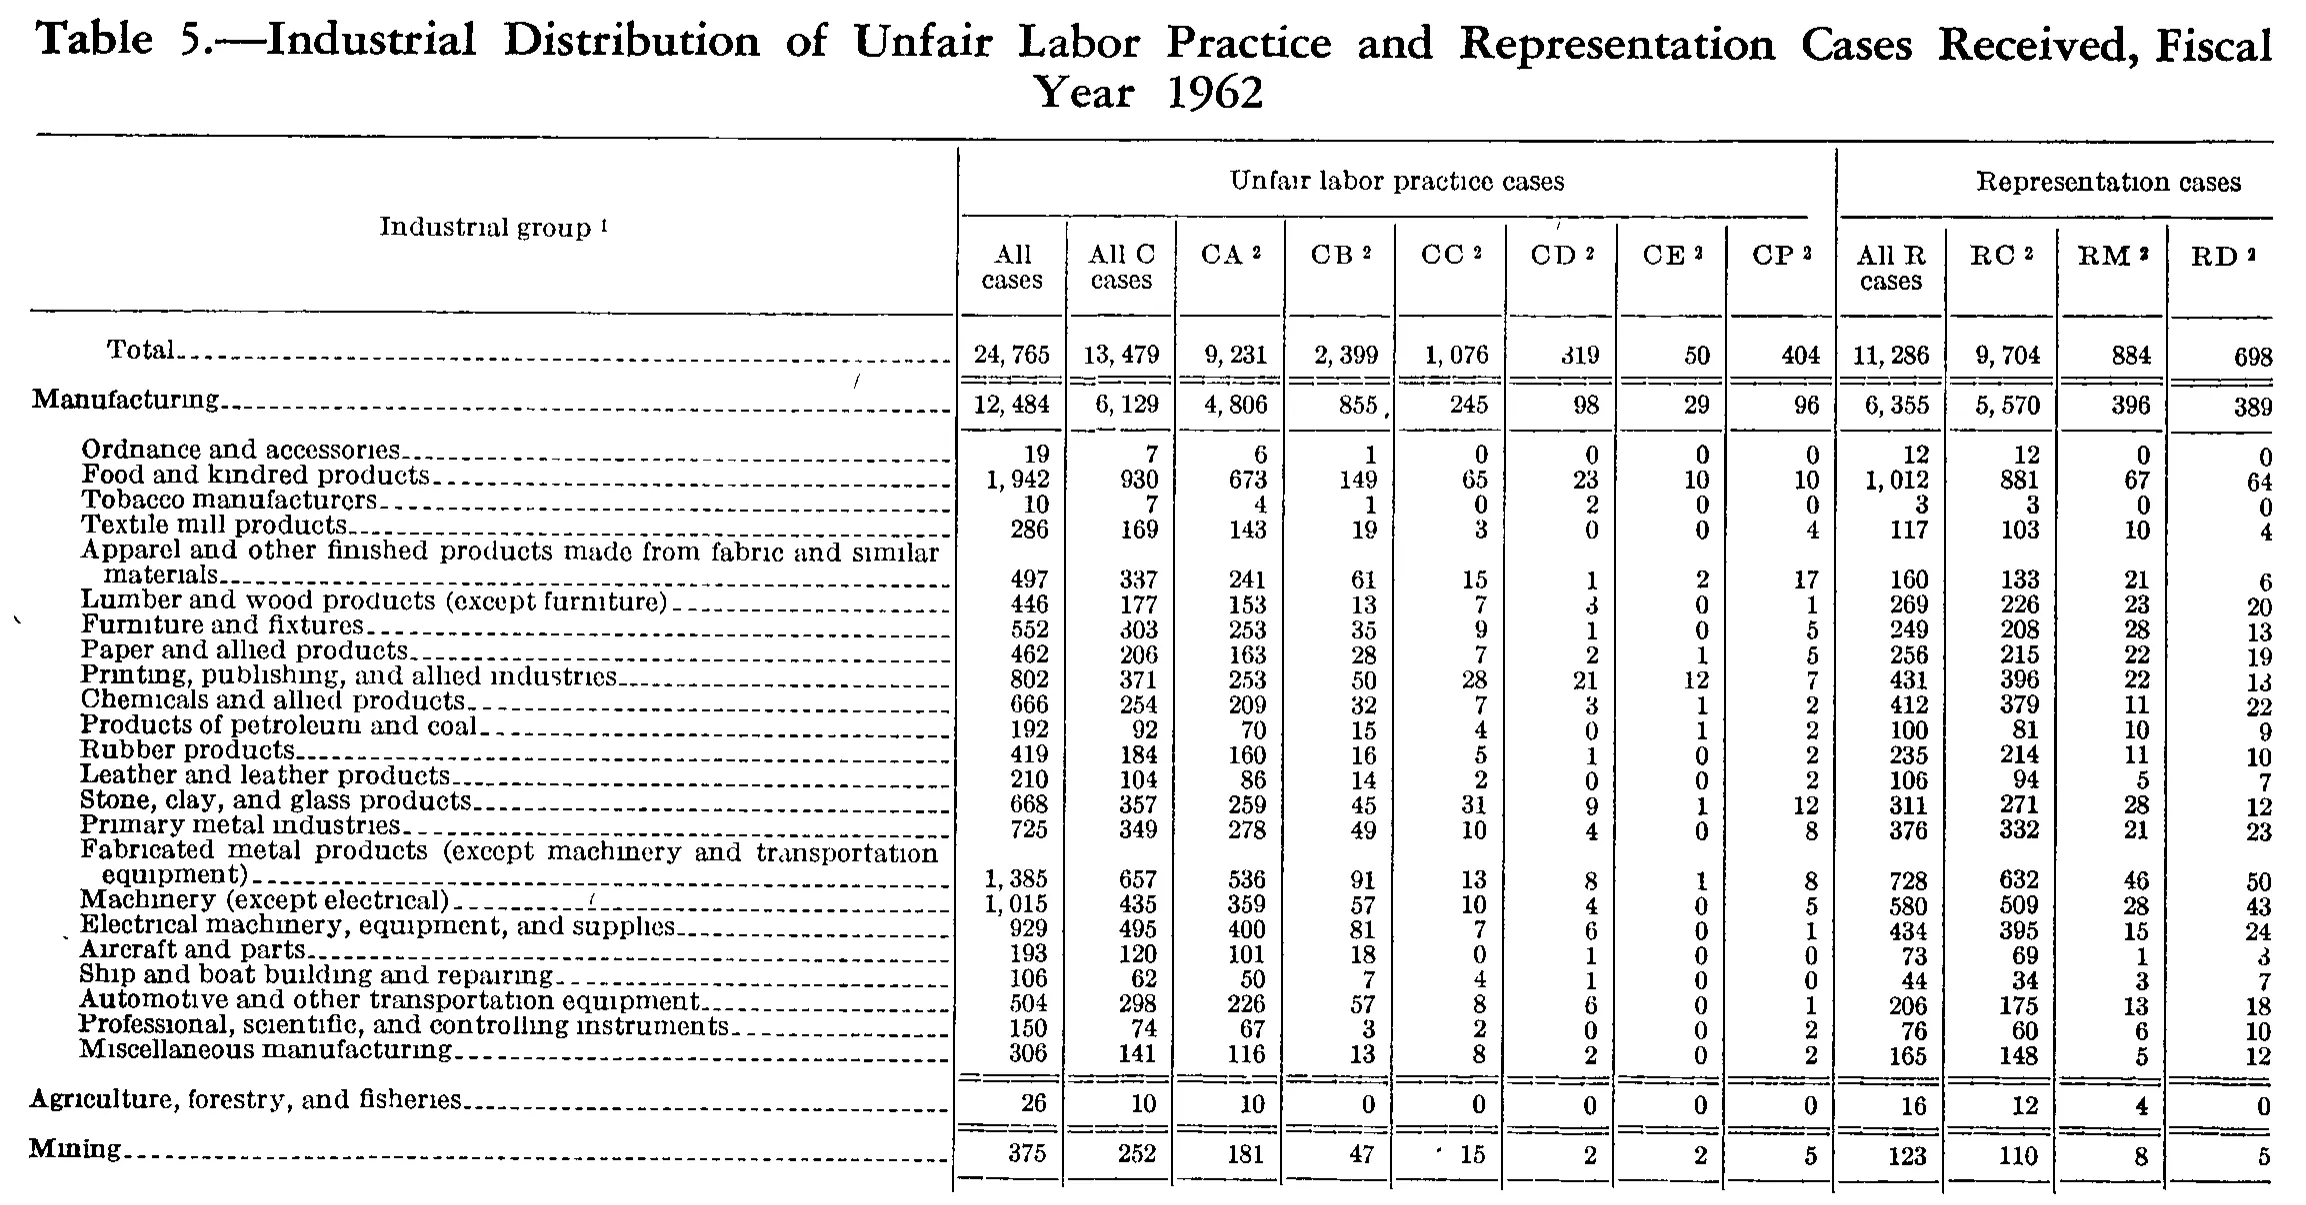
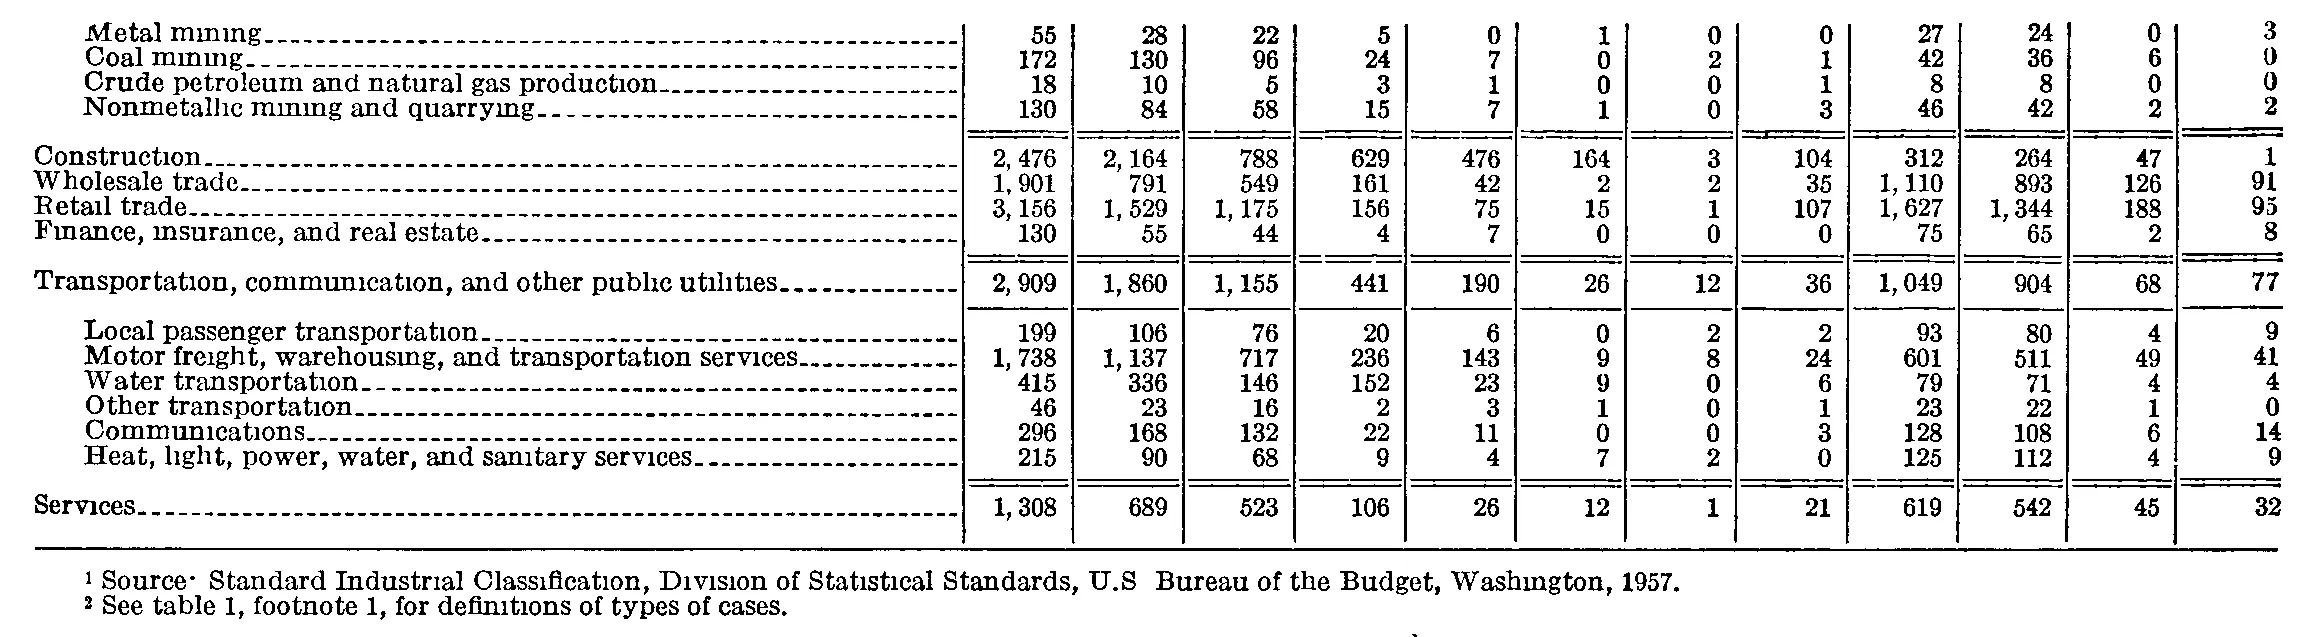
Industrial Distribution of Unfair Labor Practice and Representation Cases Received, Fiscal Year 1962
Stitched from pp. 279–280.
| Industrial group | Unfair labor practice cases | Representation cases | ||||||||||
|---|---|---|---|---|---|---|---|---|---|---|---|---|
| Industrial group | All cases | All C cases | CA | CB | CC | CD | CE | CP | All R cases | RC | RM | RD |
| Total | 24,765 | 13,479 | 9,231 | 2,399 | 1,076 | 319 | 50 | 404 | 11,286 | 9,704 | 884 | 698 |
| Manufacturing | 12,484 | 6,129 | 4,806 | 855 | 245 | 98 | 29 | 96 | 6,355 | 5,570 | 396 | 389 |
| Ordnance and accessories | 19 | 7 | 6 | 1 | 0 | 0 | 0 | 0 | 12 | 12 | 0 | 0 |
| Food and kindred products | 1,942 | 930 | 673 | 149 | 65 | 23 | 10 | 10 | 1,012 | 881 | 67 | 64 |
| Tobacco manufacturers | 10 | 7 | 4 | 1 | 0 | 2 | 0 | 0 | 3 | 3 | 0 | 0 |
| Textile mill products | 286 | 169 | 143 | 19 | 3 | 0 | 0 | 4 | 117 | 103 | 10 | 4 |
| Apparel and other finished products made from fabric and similar materials | 497 | 337 | 241 | 61 | 15 | 1 | 2 | 17 | 160 | 133 | 21 | 6 |
| Lumber and wood products (except furniture) | 446 | 177 | 153 | 13 | 7 | 3 | 0 | 1 | 269 | 226 | 23 | 20 |
| Furniture and fixtures | 552 | 303 | 253 | 35 | 9 | 1 | 0 | 5 | 249 | 208 | 28 | 13 |
| Paper and allied products | 462 | 206 | 163 | 28 | 7 | 2 | 1 | 5 | 256 | 215 | 22 | 19 |
| Printing, publishing, and allied industries | 802 | 371 | 253 | 50 | 28 | 21 | 12 | 7 | 431 | 396 | 22 | 13 |
| Chemicals and allied products | 666 | 254 | 209 | 32 | 7 | 3 | 1 | 2 | 412 | 379 | 11 | 22 |
| Products of petroleum and coal | 192 | 92 | 70 | 15 | 4 | 0 | 1 | 2 | 100 | 81 | 10 | 9 |
| Rubber products | 419 | 184 | 160 | 16 | 5 | 1 | 0 | 2 | 235 | 214 | 11 | 10 |
| Leather and leather products | 210 | 104 | 86 | 14 | 2 | 0 | 0 | 2 | 106 | 94 | 5 | 7 |
| Stone, clay, and glass products | 668 | 357 | 259 | 45 | 31 | 9 | 1 | 12 | 311 | 271 | 28 | 12 |
| Primary metal industries | 725 | 349 | 278 | 49 | 10 | 4 | 0 | 8 | 376 | 332 | 21 | 23 |
| Fabricated metal products (except machinery and transportation equipment) | 1,385 | 657 | 536 | 91 | 13 | 8 | 1 | 8 | 728 | 632 | 46 | 50 |
| Machinery (except electrical) | 1,015 | 435 | 359 | 57 | 10 | 4 | 0 | 5 | 580 | 509 | 28 | 43 |
| Electrical machinery, equipment, and supplies | 929 | 495 | 400 | 81 | 7 | 6 | 0 | 1 | 434 | 395 | 15 | 24 |
| Aircraft and parts | 193 | 120 | 101 | 18 | 0 | 1 | 0 | 0 | 73 | 69 | 1 | 3 |
| Ship and boat building and repairing | 106 | 62 | 50 | 7 | 4 | 1 | 0 | 0 | 44 | 34 | 3 | 7 |
| Automotive and other transportation equipment | 504 | 298 | 226 | 57 | 8 | 6 | 0 | 1 | 206 | 175 | 13 | 18 |
| Professional, scientific, and controlling instruments | 150 | 74 | 67 | 3 | 2 | 0 | 0 | 2 | 76 | 60 | 6 | 10 |
| Miscellaneous manufacturing | 306 | 141 | 116 | 13 | 8 | 2 | 0 | 2 | 165 | 148 | 5 | 12 |
| Agriculture, forestry, and fisheries | 26 | 10 | 10 | 0 | 0 | 0 | 0 | 0 | 16 | 12 | 4 | 0 |
| Mining | 375 | 252 | 181 | 47 | 15 | 2 | 2 | 5 | 123 | 110 | 8 | 5 |
| Metal mining | 55 | 28 | 22 | 5 | 0 | 1 | 0 | 0 | 27 | 24 | 0 | 3 |
| Coal mining | 172 | 130 | 96 | 24 | 7 | 0 | 2 | 1 | 42 | 36 | 6 | 0 |
| Crude petroleum and natural gas production | 18 | 10 | 5 | 3 | 1 | 0 | 0 | 1 | 8 | 8 | 0 | 0 |
| Nonmetallic mining and quarrying | 130 | 84 | 58 | 15 | 7 | 1 | 0 | 3 | 46 | 42 | 2 | 2 |
| Construction | 2,476 | 2,164 | 788 | 629 | 476 | 164 | 3 | 104 | 312 | 264 | 47 | 1 |
| Wholesale trade | 1,901 | 791 | 549 | 161 | 42 | 2 | 2 | 35 | 1,110 | 893 | 126 | 91 |
| Retail trade | 3,156 | 1,529 | 1,175 | 156 | 75 | 15 | 1 | 107 | 1,627 | 1,344 | 188 | 95 |
| Finance, insurance, and real estate | 130 | 55 | 44 | 4 | 7 | 0 | 0 | 0 | 75 | 65 | 2 | 8 |
| Transportation, communication, and other public utilities | 2,909 | 1,860 | 1,155 | 441 | 190 | 26 | 12 | 36 | 1,049 | 904 | 68 | 77 |
| Local passenger transportation | 199 | 106 | 76 | 20 | 6 | 0 | 2 | 2 | 93 | 80 | 4 | 9 |
| Motor freight, warehousing, and transportation services | 1,738 | 1,137 | 717 | 236 | 143 | 9 | 8 | 24 | 601 | 511 | 49 | 41 |
| Water transportation | 415 | 336 | 146 | 152 | 23 | 9 | 0 | 6 | 79 | 71 | 4 | 4 |
| Other transportation | 46 | 23 | 16 | 2 | 3 | 1 | 0 | 1 | 23 | 22 | 1 | 0 |
| Communications | 296 | 168 | 132 | 22 | 11 | 0 | 0 | 3 | 128 | 108 | 6 | 14 |
| Heat, light, power, water, and sanitary services | 215 | 90 | 68 | 9 | 4 | 7 | 2 | 0 | 125 | 112 | 4 | 9 |
| Services | 1,308 | 689 | 523 | 106 | 26 | 12 | 1 | 21 | 619 | 542 | 45 | 32 |
- 1 Source: Standard Industrial Classification, Division of Statistical Standards, U.S. Bureau of the Budget, Washington, 1957.
- 2 See table 1, footnote 1, for definitions of types of cases.
458 of 458 figures sit in a row or column sum that works out.
Reader’s notes
p. 279. The crop ends after the "Mining" row; the table clearly continues onto the next page (further industrial groups) and the footnote texts for markers 1, 2 and 3 cited in the headings are not printed on this image, so `footnotes` is empty. Footnote markers in the column headings are small and partly broken by the scan. "CA", "CB", "CC", "CD", "CP", "RC", "RM" and "RD" all appear to carry a raised 2; the marker over "CE" reads as a raised 3 to me (it is shaped differently from the others) and is transcribed as CE^3, but a 2 cannot be ruled out. The marker on "RD" is the faintest of the group; I read it as 2. All 27 body rows cross-foot exactly: in every row the six C-case columns (CA through CP) sum to "All C cases", the three R columns (RC, RM, RD) sum to "All R cases", and those two sum to "All cases"; the 23 manufacturing subgroup rows also sum down to the "Manufacturing" line in the "All cases" column (12,484). No misprints detected. Minor stray marks in the scan (a tick above the Total row near the CD column, a mark left of the "Lumber" row label, and a mark before the "15" in the CC column of the Mining row) are scan artifacts, not digits or footnote markers.
p. 280. Continuation page: no column headings are printed on this crop, so header_rows is empty. The grid has 13 columns (stub + 12 numeric), counted from the column rules; every numeric cell is filled on every row. Internal consistency: on all 16 rows column 1 equals column 2 + column 9, column 2 equals the sum of columns 3-8, and column 9 equals the sum of columns 10-12. No printed value appears to be a misprint, and the arithmetic independently confirms the column assignment of each figure (e.g. Construction's last cell really is 1: 264 + 47 + 1 = 312). Indentation preserved in the source but not in the grid: the first four rows (Metal mining through Nonmetallic mining and quarrying) and rows 10-15 (Local passenger transportation through Heat, light, power, water, and sanitary services) are printed indented as sub-industries; the mining group's heading row lies on the preceding page, above this crop. Double horizontal rules separate the industry groups (after Nonmetallic mining and quarrying, after Finance, around the Transportation line, and after Heat, light, power); they carry no data. The scan drops some faint periods — footnote 1 reads "Source·" with a weak colon and "U.S" with a faint second period; both are transcribed in their normal form. A small stray ink mark sits below the footnotes at the bottom centre of the crop and is not text.
Source image
Source data: U.S. NLRB Annual Reports (public domain). Reconstruction by NLRB Stats Archive. Read by claude-opus-5 (effort max, prompt extract_v1) from the 300-dpi scan; stitched by page. Updated October 2026.