NLRB Stats Archive › Annual Reports › FY1961 › Size of Units in Collective-Bargaining and Decertification Elections, Fiscal Year 1961
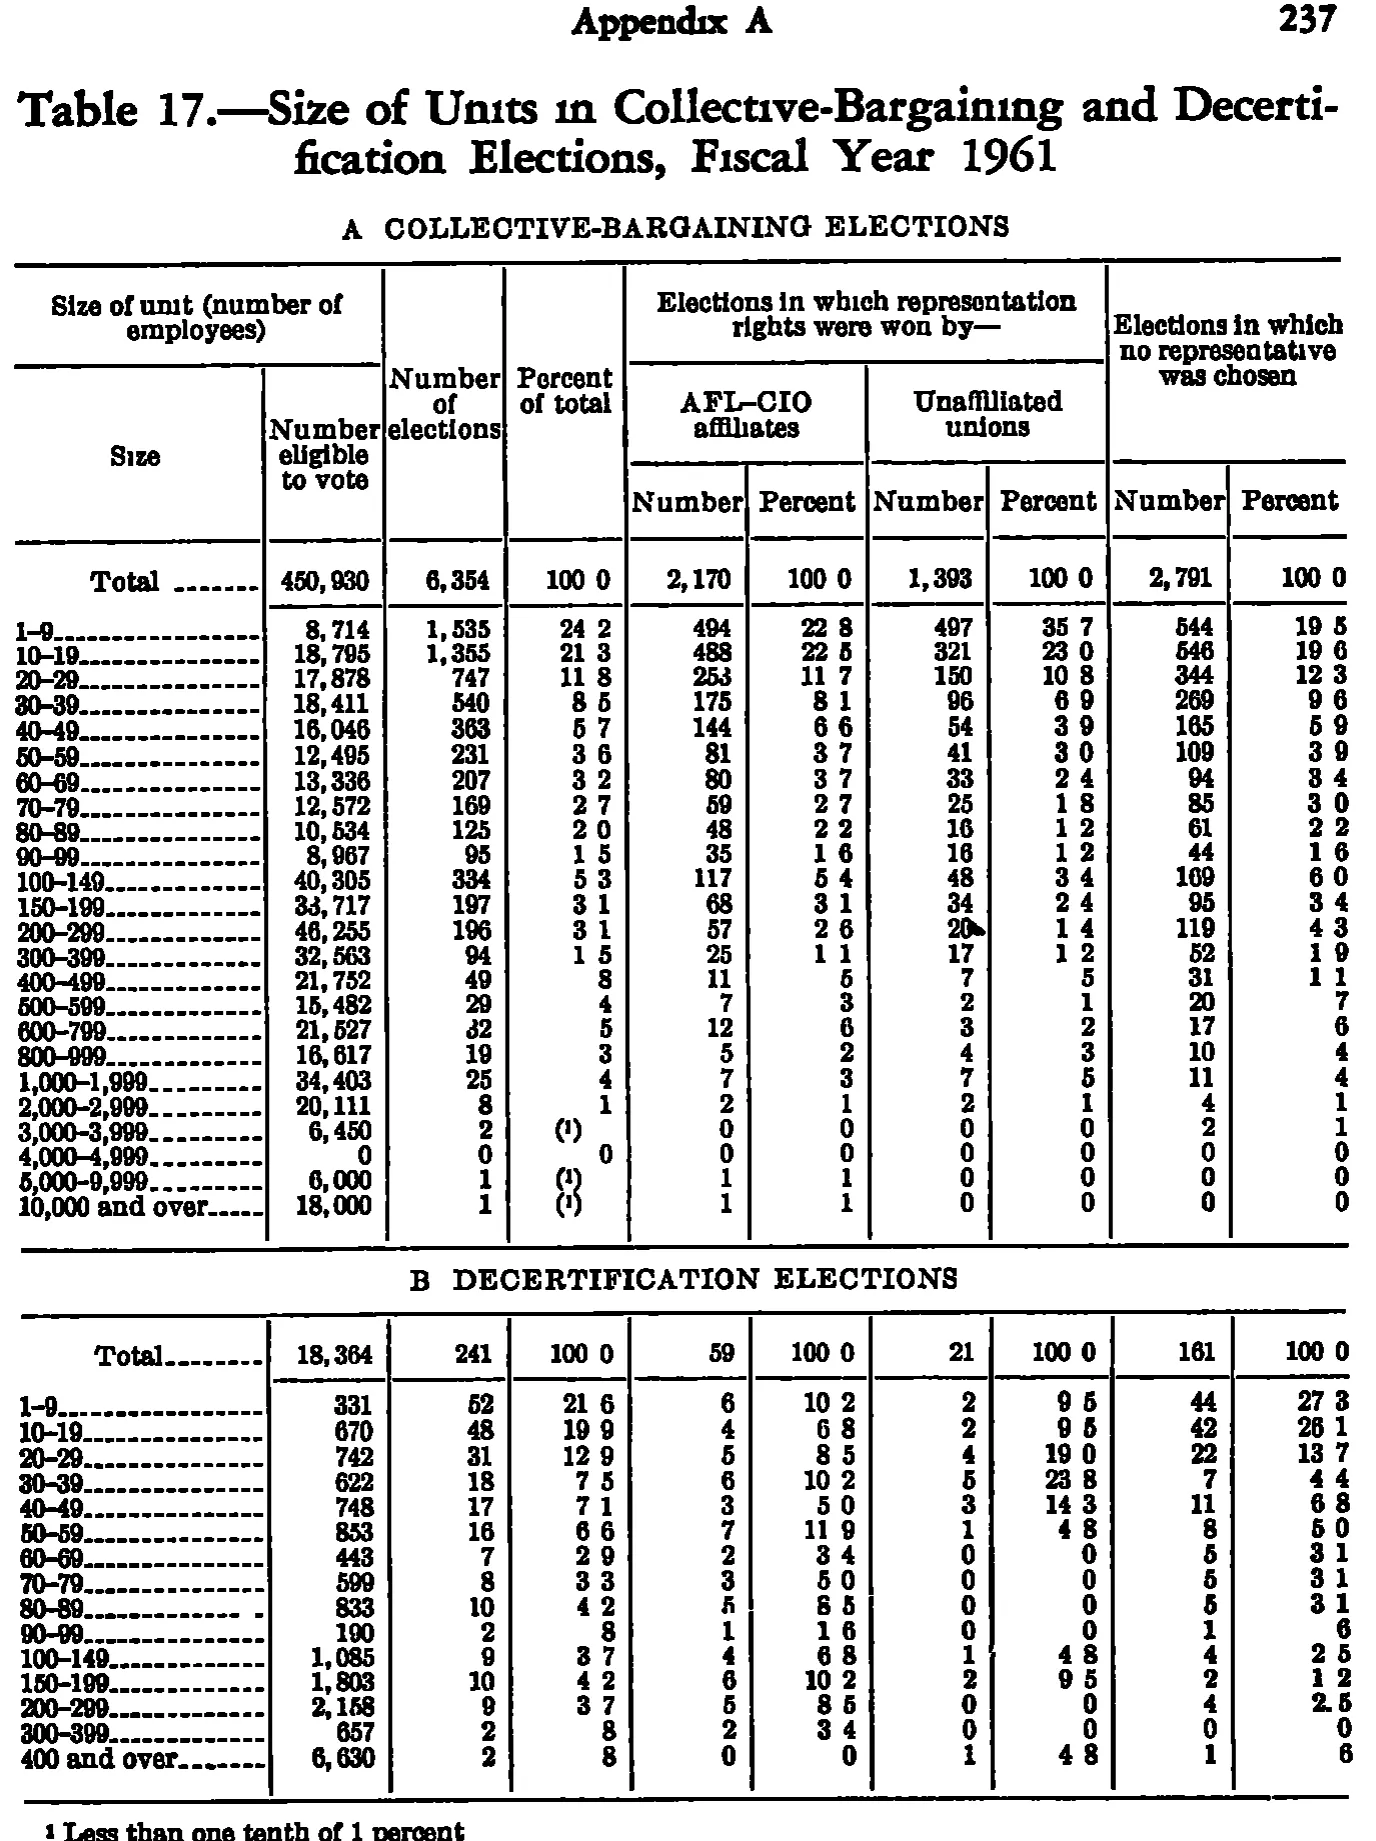
Size of Units in Collective-Bargaining and Decertification Elections, Fiscal Year 1961
| Size of unit (number of employees) | Size of unit (number of employees) | Number of elections | Percent of total | Elections in which representation rights were won by— | Elections in which no representative was chosen | ||||
|---|---|---|---|---|---|---|---|---|---|
| Size | Number eligible to vote | Number of elections | Percent of total | AFL-CIO affiliates | Unaffiliated unions | Elections in which no representative was chosen | |||
| Size | Number eligible to vote | Number of elections | Percent of total | Number | Percent | Number | Percent | Number | Percent |
| A. COLLECTIVE-BARGAINING ELECTIONS | |||||||||
| Total | 450,930 | 6,354 | 100.0 | 2,170 | 100.0 | 1,393 | 100.0 | 2,791 | 100.0 |
| 1-9 | 8,714 | 1,535 | 24.2 | 494 | 22.8 | 497 | 35.7 | 544 | 19.5 |
| 10-19 | 18,795 | 1,355 | 21.3 | 488 | 22.5 | 321 | 23.0 | 546 | 19.6 |
| 20-29 | 17,878 | 747 | 11.8 | 253 | 11.7 | 150 | 10.8 | 344 | 12.3 |
| 30-39 | 18,411 | 540 | 8.5 | 175 | 8.1 | 96 | 6.9 | 269 | 9.6 |
| 40-49 | 16,046 | 363 | 5.7 | 144 | 6.6 | 54 | 3.9 | 165 | 5.9 |
| 50-59 | 12,495 | 231 | 3.6 | 81 | 3.7 | 41 | 3.0 | 109 | 3.9 |
| 60-69 | 13,336 | 207 | 3.2 | 80 | 3.7 | 33 | 2.4 | 94 | 3.4 |
| 70-79 | 12,572 | 169 | 2.7 | 59 | 2.7 | 25 | 1.8 | 85 | 3.0 |
| 80-89 | 10,534 | 125 | 2.0 | 48 | 2.2 | 16 | 1.2 | 61 | 2.2 |
| 90-99 | 8,967 | 95 | 1.5 | 35 | 1.6 | 16 | 1.2 | 44 | 1.6 |
| 100-149 | 40,305 | 334 | 5.3 | 117 | 5.4 | 48 | 3.4 | 169 | 6.0 |
| 150-199 | 33,717 | 197 | 3.1 | 68 | 3.1 | 34 | 2.4 | 95 | 3.4 |
| 200-299 | 46,255 | 196 | 3.1 | 57 | 2.6 | 20 | 1.4 | 119 | 4.3 |
| 300-399 | 32,563 | 94 | 1.5 | 25 | 1.1 | 17 | 1.2 | 52 | 1.9 |
| 400-499 | 21,752 | 49 | .8 | 11 | .5 | 7 | .5 | 31 | 1.1 |
| 500-599 | 15,482 | 29 | .4 | 7 | .3 | 2 | .1 | 20 | .7 |
| 600-799 | 21,527 | 32 | .5 | 12 | .6 | 3 | .2 | 17 | .6 |
| 800-999 | 16,617 | 19 | .3 | 5 | .2 | 4 | .3 | 10 | .4 |
| 1,000-1,999 | 34,403 | 25 | .4 | 7 | .3 | 7 | .5 | 11 | .4 |
| 2,000-2,999 | 20,111 | 8 | .1 | 2 | .1 | 2 | .1 | 4 | .1 |
| 3,000-3,999 | 6,450 | 2 | [1] | 0 | 0 | 0 | 0 | 2 | .1 |
| 4,000-4,999 | 0 | 0 | 0 | 0 | 0 | 0 | 0 | 0 | 0 |
| 5,000-9,999 | 6,000 | 1 | [1] | 1 | .1 | 0 | 0 | 0 | 0 |
| 10,000 and over | 18,000 | 1 | [1] | 1 | .1 | 0 | 0 | 0 | 0 |
| B. DECERTIFICATION ELECTIONS | |||||||||
| Total | 18,364 | 241 | 100.0 | 59 | 100.0 | 21 | 100.0 | 161 | 100.0 |
| 1-9 | 331 | 52 | 21.6 | 6 | 10.2 | 2 | 9.5 | 44 | 27.3 |
| 10-19 | 670 | 48 | 19.9 | 4 | 6.8 | 2 | 9.5 | 42 | 26.1 |
| 20-29 | 742 | 31 | 12.9 | 5 | 8.5 | 4 | 19.0 | 22 | 13.7 |
| 30-39 | 622 | 18 | 7.5 | 6 | 10.2 | 5 | 23.8 | 7 | 4.4 |
| 40-49 | 748 | 17 | 7.1 | 3 | 5.0 | 3 | 14.3 | 11 | 6.8 |
| 50-59 | 853 | 16 | 6.6 | 7 | 11.9 | 1 | 4.8 | 8 | 5.0 |
| 60-69 | 443 | 7 | 2.9 | 2 | 3.4 | 0 | 0 | 5 | 3.1 |
| 70-79 | 599 | 8 | 3.3 | 3 | 5.0 | 0 | 0 | 5 | 3.1 |
| 80-89 | 833 | 10 | 4.2 | 5 | 8.5 | 0 | 0 | 5 | 3.1 |
| 90-99 | 190 | 2 | .8 | 1 | 1.6 | 0 | 0 | 1 | .6 |
| 100-149 | 1,085 | 9 | 3.7 | 4 | 6.8 | 1 | 4.8 | 4 | 2.5 |
| 150-199 | 1,803 | 10 | 4.2 | 6 | 10.2 | 2 | 9.5 | 2 | 1.2 |
| 200-299 | 2,158 | 9 | 3.7 | 5 | 8.5 | 0 | 0 | 4 | 2.5 |
| 300-399 | 657 | 2 | .8 | 2 | 3.4 | 0 | 0 | 0 | 0 |
| 400 and over | 6,630 | 2 | .8 | 0 | 0 | 1 | 4.8 | 1 | .6 |
- 1 Less than one tenth of 1 percent.
186 of 186 figures sit in a row or column sum that works out.
Reader’s notes
p. 250. DECIMAL POINTS RESTORED. This scan systematically drops small isolated dots: the running head prints as "Appendıx", the caption as "Fıscal", and the i-dots are gone throughout. The same loss removes the decimal points in every percent column, which print on the image as e.g. "100 0", "24 2", "22 8". I have written them as 100.0, 24.2, 22.8 etc. Evidence: (a) one decimal point survived the scan — "2.5" in the last column of the 200-299 row of panel B; (b) every percent reproduces the corresponding count divided by its column total to one decimal place. Percent cells printed as a single right-aligned digit have no leading zero on the page, so they are transcribed ".8", ".5", ".1" and so on. True zeros print as a plain "0" and are transcribed "0". PANEL/SECTION LABELS. The two panels are stacked, not side by side, and share one set of column headings printed above panel A only; I have given the headings once and run panel B's rows under panel A's. The section lines "A COLLECTIVE-BARGAINING ELECTIONS" and "B DECERTIFICATION ELECTIONS" are printed centred (the first one above the column headings, the second between the panels); I have carried them as label-only body rows. Their periods after the A and the B are inferred from the same dot-loss — the image shows a gap wide enough for one but no visible dot. FOOTNOTE MARKER CELLS. In the "Percent of total" column the rows 3,000-3,999, 5,000-9,999 and 10,000 and over hold a parenthesised raised 1, "(1)", standing in place of a value (meaning less than one tenth of 1 percent). I have kept it as the literal cell text rather than as a caret marker, since it is the whole cell and is not attached to a number. The trailing period of the footnote text itself is also inferred. DOUBTFUL CELLS, all resolved against the printed column totals, which every column reproduces exactly: - Panel A, 50-59, "Elections in which no representative was chosen / Number": the glyph could read 109 or 169; 109 is required by the column total 2,791 and by the printed 3.9 percent. - Panel A, 100-149, same column: 169 (not 109), required by the same total and by the printed 6.0 percent. - Panel A, 150-199, "Number eligible to vote": the second digit is broken; 33,717 is required by the column total 450,930. - Panel A, 600-799, "Number of elections": the leading digit is broken; 32 is required by the column total 6,354. - Panel A, 200-299, "Unaffiliated unions / Number": an ink blot sits to the right of the figure; the value is 20, required by the column total 1,393. - Panel A, 10-19, "AFL-CIO affiliates / Percent": the final digit is filled in; 22.5 follows from 488/2,170. - Panel B, 80-89, "AFL-CIO affiliates / Number" and "/ Percent": both figures are filled in; 5 and 8.5 follow from the column total 59. PRINTED FIGURES THAT DO NOT RECOMPUTE EXACTLY, transcribed as printed and not corrected: panel A, 500-599, "Percent of total" prints .4 where 29/6,354 is .46; panel A, 60-69, "Percent of total" prints 3.2 where 207/6,354 is 3.26; panel A, 5,000-9,999 and 10,000 and over, "AFL-CIO affiliates / Percent" print .1 where 1/2,170 is .05 (the same magnitude is footnoted as "(1)" in the "Percent of total" column of those rows); panel B, 40-49 and 70-79, "AFL-CIO affiliates / Percent" print 5.0 and 90-99 prints 1.6 where 3/59 is 5.08 and 1/59 is 1.69, suggesting truncation in places where other cells round. The crop clips the bottom of the footnote line but it remains legible. The caption, the running head "Appendix A" and the page number 237 are omitted as instructed.
Source image
Source data: U.S. NLRB Annual Reports (public domain). Reconstruction by NLRB Stats Archive. Read by claude-opus-5 (effort max, prompt extract_v1) from the 300-dpi scan; stitched by page. Updated October 2026.