NLRB Stats Archive › Annual Reports › FY1961 › Geographic Distribution of Unfair Labor Practice and Representation Cases Received, Fiscal Year 1961
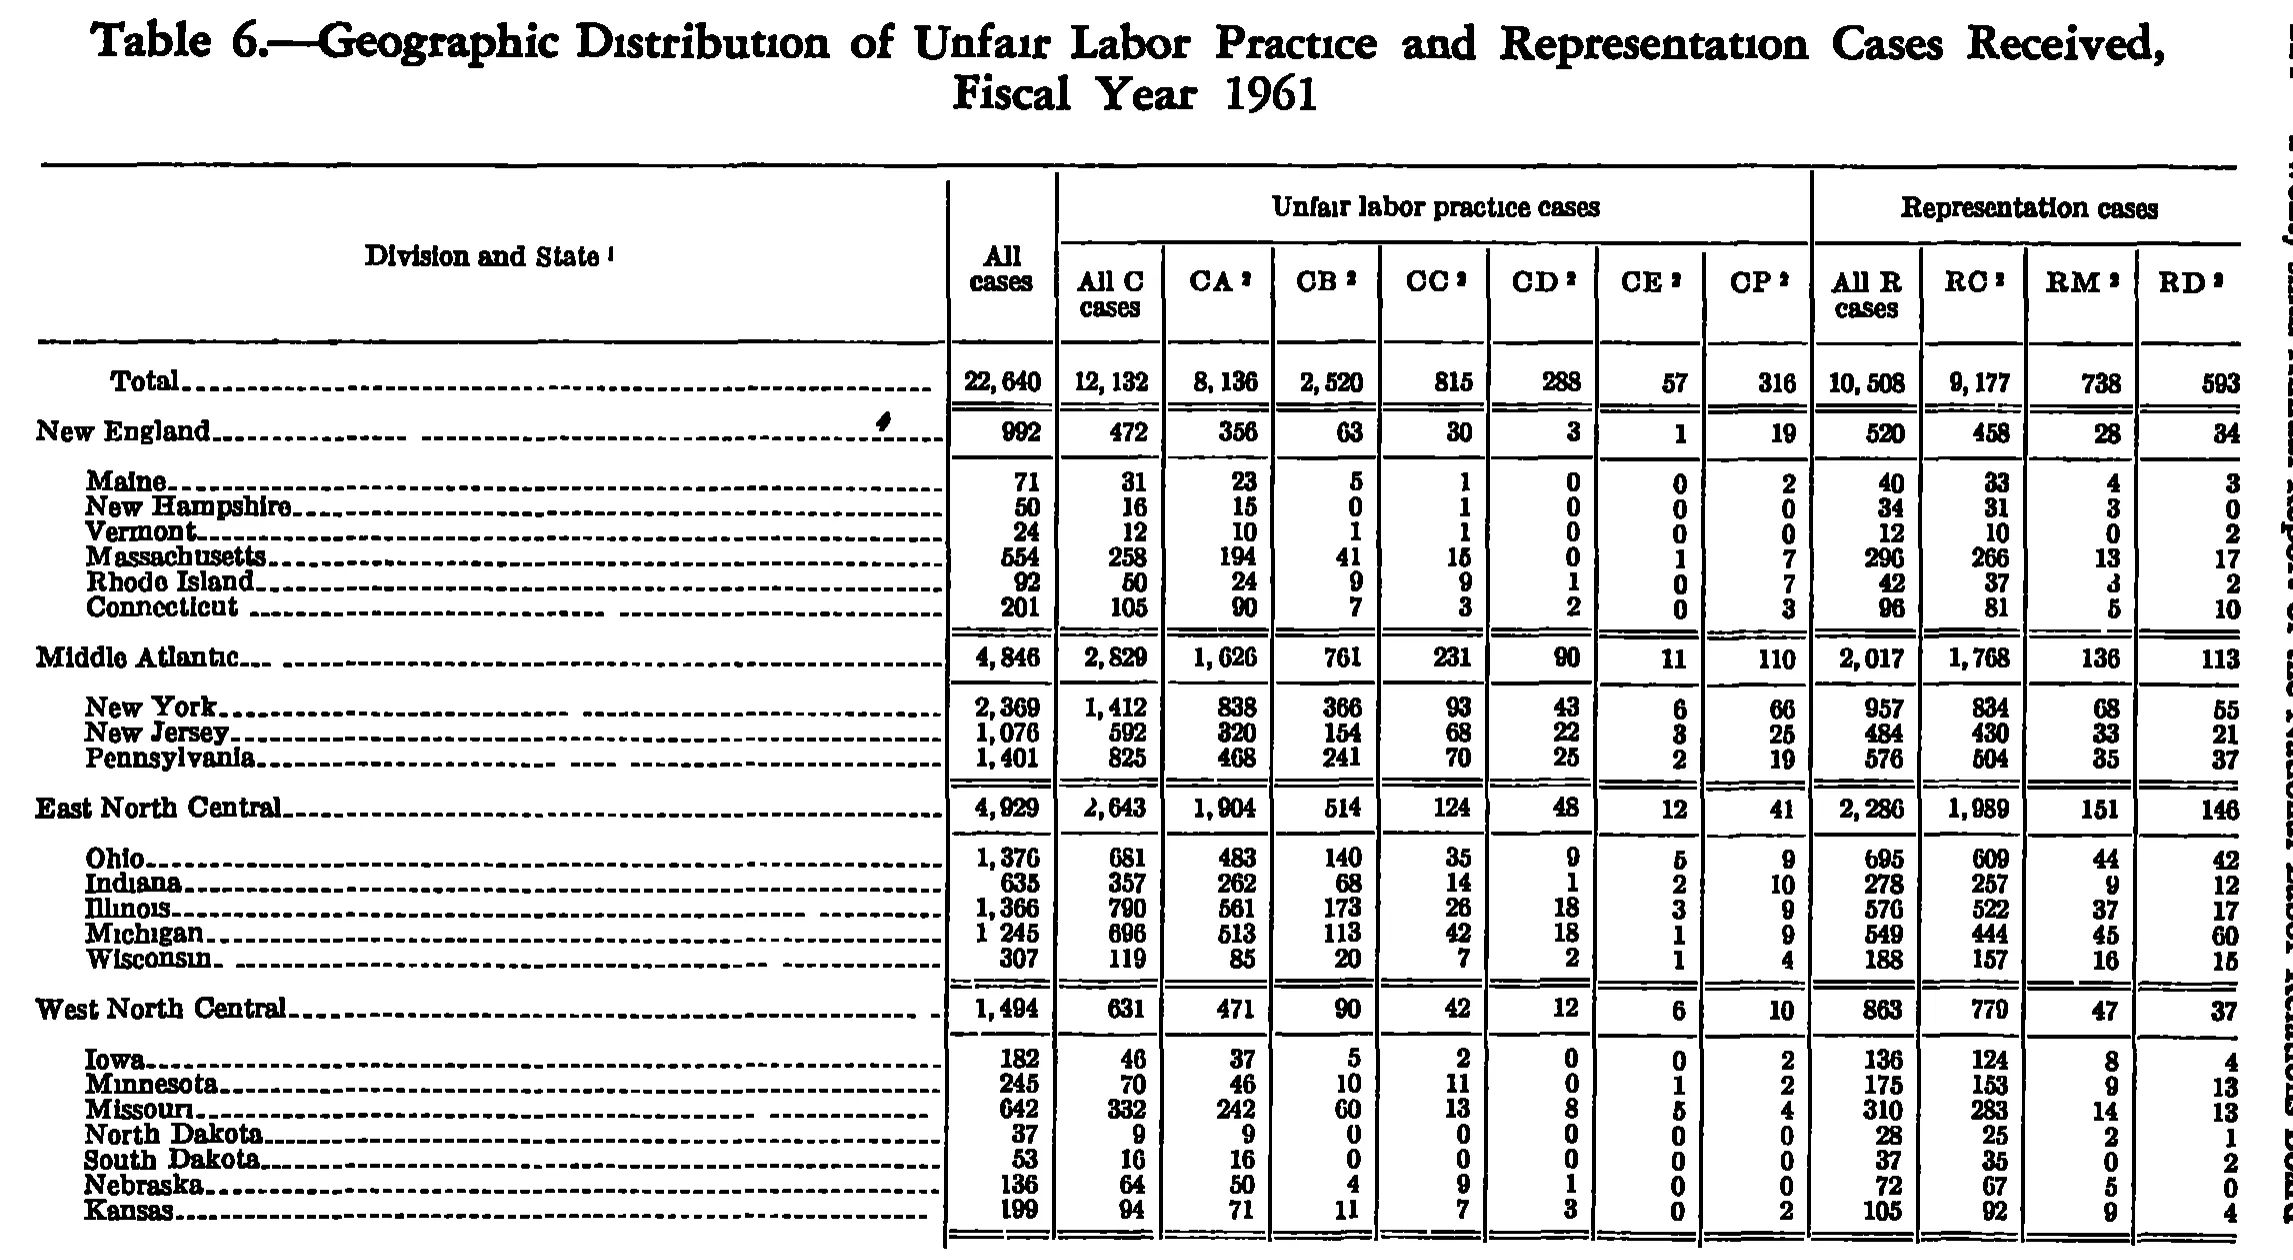
Geographic Distribution of Unfair Labor Practice and Representation Cases Received, Fiscal Year 1961
Stitched from pp. 237–238.
| Division and State | All cases | Unfair labor practice cases | Representation cases | |||||||||
|---|---|---|---|---|---|---|---|---|---|---|---|---|
| Division and State | All cases | All C cases | CA | CB | CC | CD | CE | CP | All R cases | RC | RM | RD |
| Total | 22,640 | 12,132 | 8,136 | 2,520 | 815 | 288 | 57 | 316 | 10,508 | 9,177 | 738 | 593 |
| New England | 992 | 472 | 356 | 63 | 30 | 3 | 1 | 19 | 520 | 458 | 28 | 34 |
| Maine | 71 | 31 | 23 | 5 | 1 | 0 | 0 | 2 | 40 | 33 | 4 | 3 |
| New Hampshire | 50 | 16 | 15 | 0 | 1 | 0 | 0 | 0 | 34 | 31 | 3 | 0 |
| Vermont | 24 | 12 | 10 | 1 | 1 | 0 | 0 | 0 | 12 | 10 | 0 | 2 |
| Massachusetts | 554 | 258 | 194 | 41 | 15 | 0 | 1 | 7 | 296 | 266 | 13 | 17 |
| Rhode Island | 92 | 50 | 24 | 9 | 9 | 1 | 0 | 7 | 42 | 37 | 3 | 2 |
| Connecticut | 201 | 105 | 90 | 7 | 3 | 2 | 0 | 3 | 96 | 81 | 5 | 10 |
| Middle Atlantic | 4,846 | 2,829 | 1,626 | 761 | 231 | 90 | 11 | 110 | 2,017 | 1,768 | 136 | 113 |
| New York | 2,369 | 1,412 | 838 | 366 | 93 | 43 | 6 | 66 | 957 | 834 | 68 | 55 |
| New Jersey | 1,076 | 592 | 320 | 154 | 68 | 22 | 3 | 25 | 484 | 430 | 33 | 21 |
| Pennsylvania | 1,401 | 825 | 468 | 241 | 70 | 25 | 2 | 19 | 576 | 504 | 35 | 37 |
| East North Central | 4,929 | 2,643 | 1,904 | 514 | 124 | 48 | 12 | 41 | 2,286 | 1,989 | 151 | 146 |
| Ohio | 1,376 | 681 | 483 | 140 | 35 | 9 | 5 | 9 | 695 | 609 | 44 | 42 |
| Indiana | 635 | 357 | 262 | 68 | 14 | 1 | 2 | 10 | 278 | 257 | 9 | 12 |
| Illinois | 1,366 | 790 | 561 | 173 | 26 | 18 | 3 | 9 | 576 | 522 | 37 | 17 |
| Michigan | 1,245 | 696 | 513 | 113 | 42 | 18 | 1 | 9 | 549 | 444 | 45 | 60 |
| Wisconsin | 307 | 119 | 85 | 20 | 7 | 2 | 1 | 4 | 188 | 157 | 16 | 15 |
| West North Central | 1,494 | 631 | 471 | 90 | 42 | 12 | 6 | 10 | 863 | 779 | 47 | 37 |
| Iowa | 182 | 46 | 37 | 5 | 2 | 0 | 0 | 2 | 136 | 124 | 8 | 4 |
| Minnesota | 245 | 70 | 46 | 10 | 11 | 0 | 1 | 2 | 175 | 153 | 9 | 13 |
| Missouri | 642 | 332 | 242 | 60 | 13 | 8 | 5 | 4 | 310 | 283 | 14 | 13 |
| North Dakota | 37 | 9 | 9 | 0 | 0 | 0 | 0 | 0 | 28 | 25 | 2 | 1 |
| South Dakota | 53 | 16 | 16 | 0 | 0 | 0 | 0 | 0 | 37 | 35 | 0 | 2 |
| Nebraska | 136 | 64 | 50 | 4 | 9 | 1 | 0 | 0 | 72 | 67 | 5 | 0 |
| Kansas | 199 | 94 | 71 | 11 | 7 | 3 | 0 | 2 | 105 | 92 | 9 | 4 |
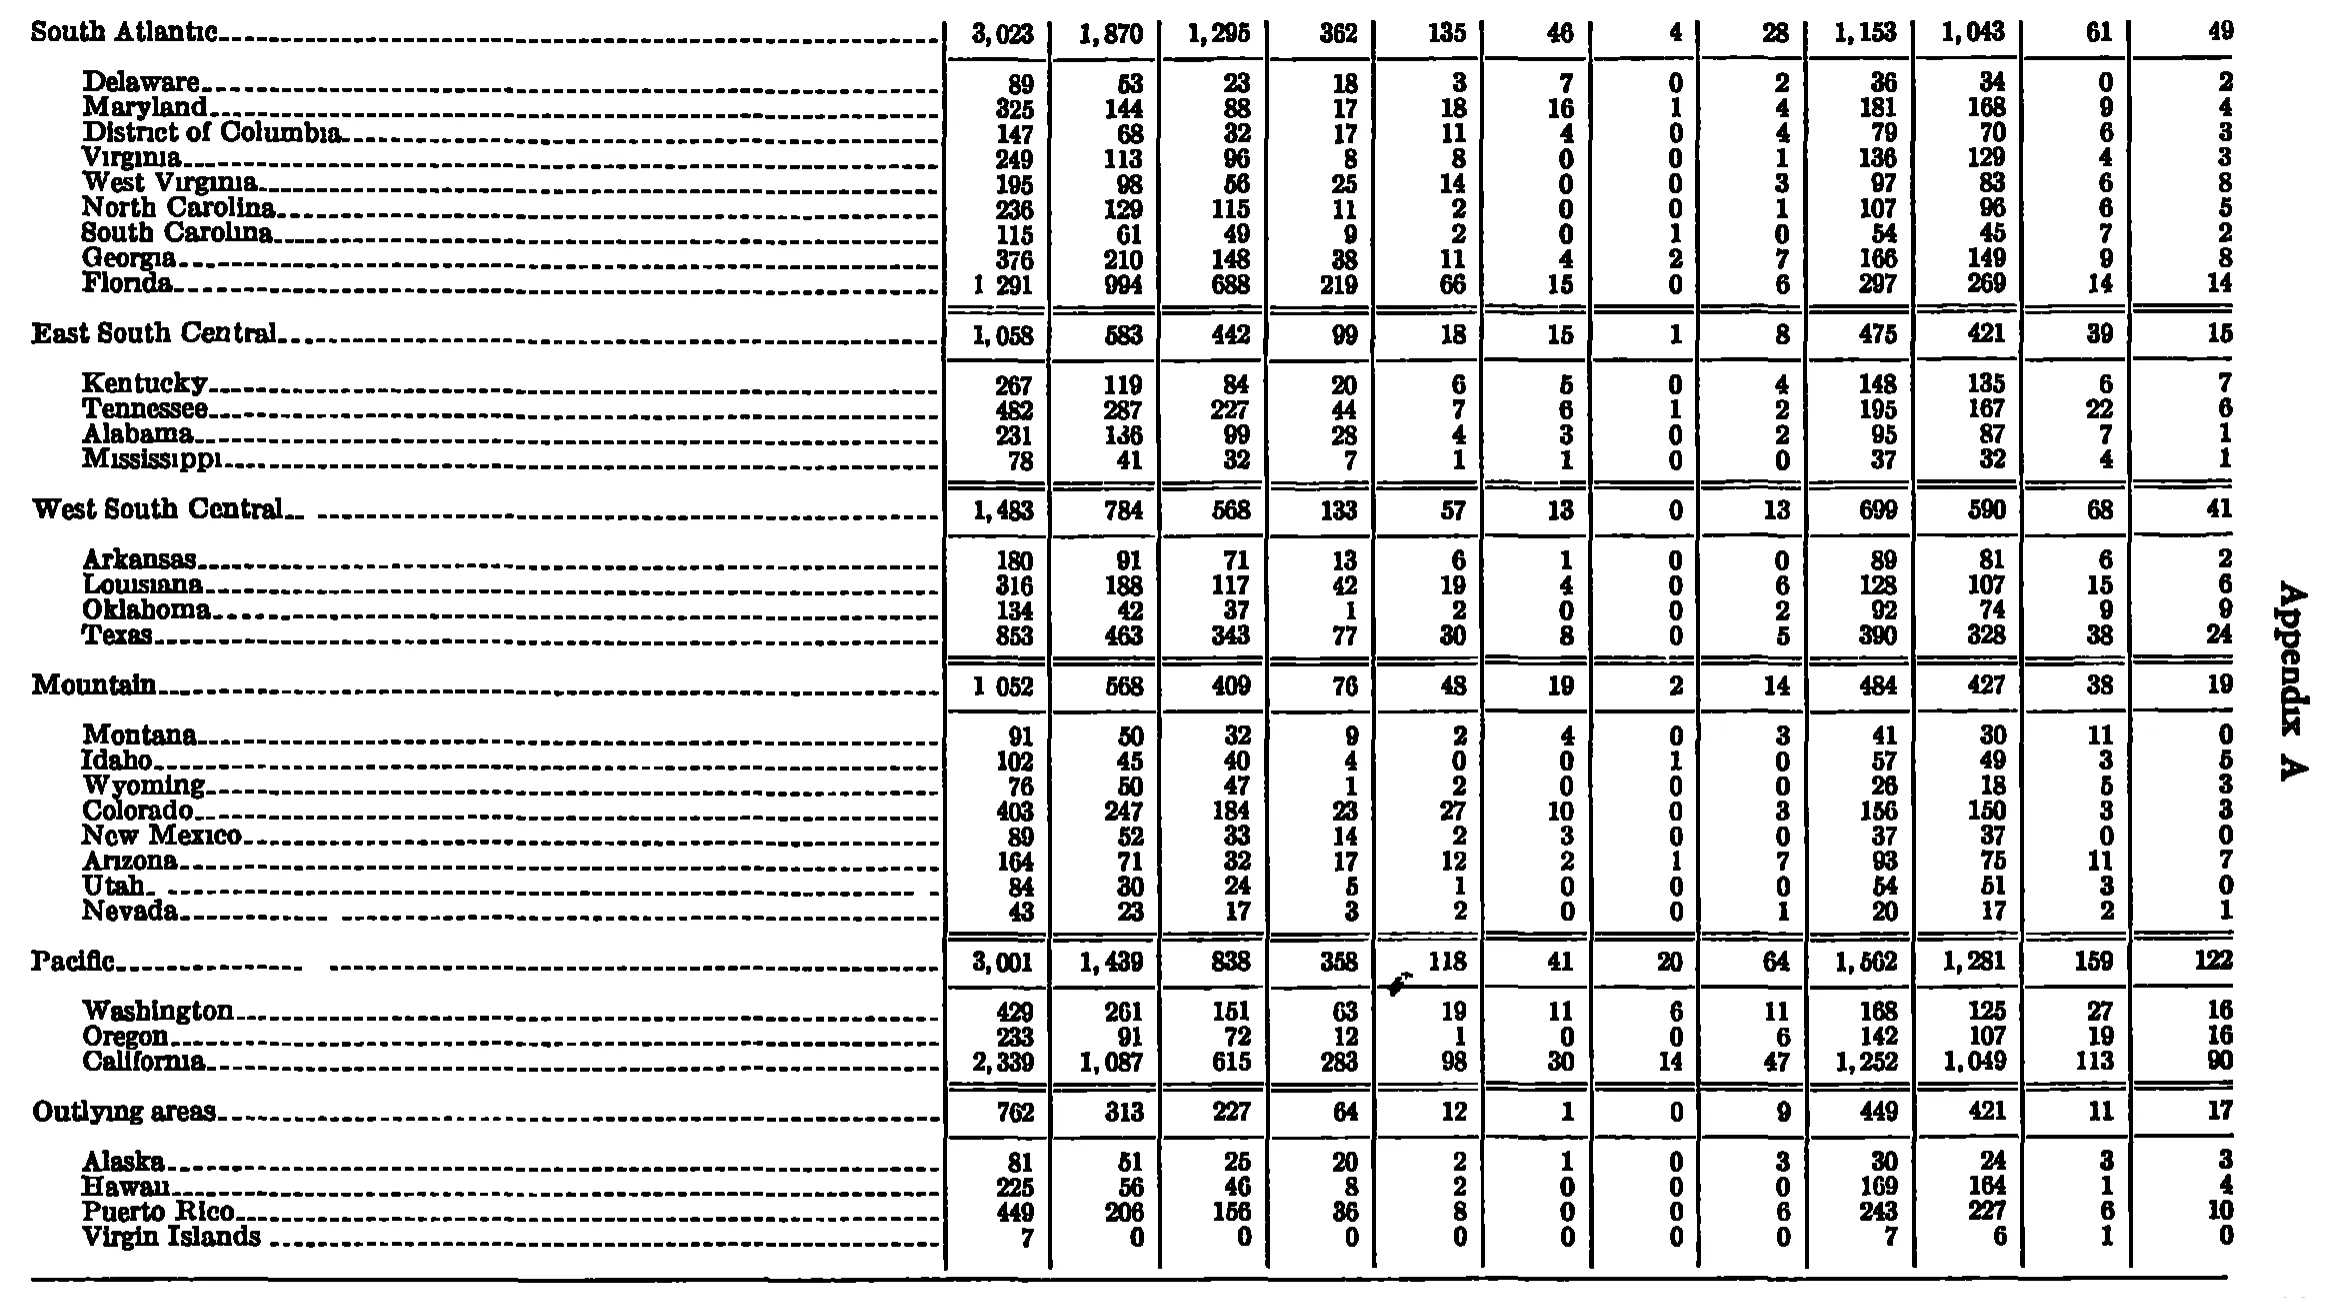
| South Atlantic | 3,023 | 1,870 | 1,295 | 362 | 135 | 46 | 4 | 28 | 1,153 | 1,043 | 61 | 49 |
| Delaware | 89 | 53 | 23 | 18 | 3 | 7 | 0 | 2 | 36 | 34 | 0 | 2 |
| Maryland | 325 | 144 | 88 | 17 | 18 | 16 | 1 | 4 | 181 | 168 | 9 | 4 |
| District of Columbia | 147 | 68 | 32 | 17 | 11 | 4 | 0 | 4 | 79 | 70 | 6 | 3 |
| Virginia | 249 | 113 | 96 | 8 | 8 | 0 | 0 | 1 | 136 | 129 | 4 | 3 |
| West Virginia | 195 | 98 | 56 | 25 | 14 | 0 | 0 | 3 | 97 | 83 | 6 | 8 |
| North Carolina | 236 | 129 | 115 | 11 | 2 | 0 | 0 | 1 | 107 | 96 | 6 | 5 |
| South Carolina | 115 | 61 | 49 | 9 | 2 | 0 | 1 | 0 | 54 | 45 | 7 | 2 |
| Georgia | 376 | 210 | 148 | 38 | 11 | 4 | 2 | 7 | 166 | 149 | 9 | 8 |
| Florida | 1,291 | 994 | 688 | 219 | 66 | 15 | 0 | 6 | 297 | 269 | 14 | 14 |
| East South Central | 1,058 | 583 | 442 | 99 | 18 | 15 | 1 | 8 | 475 | 421 | 39 | 15 |
| Kentucky | 267 | 119 | 84 | 20 | 6 | 5 | 0 | 4 | 148 | 135 | 6 | 7 |
| Tennessee | 482 | 287 | 227 | 44 | 7 | 6 | 1 | 2 | 195 | 167 | 22 | 6 |
| Alabama | 231 | 136 | 99 | 28 | 4 | 3 | 0 | 2 | 95 | 87 | 7 | 1 |
| Mississippi | 78 | 41 | 32 | 7 | 1 | 1 | 0 | 0 | 37 | 32 | 4 | 1 |
| West South Central | 1,483 | 784 | 568 | 133 | 57 | 13 | 0 | 13 | 699 | 590 | 68 | 41 |
| Arkansas | 180 | 91 | 71 | 13 | 6 | 1 | 0 | 0 | 89 | 81 | 6 | 2 |
| Louisiana | 316 | 188 | 117 | 42 | 19 | 4 | 0 | 6 | 128 | 107 | 15 | 6 |
| Oklahoma | 134 | 42 | 37 | 1 | 2 | 0 | 0 | 2 | 92 | 74 | 9 | 9 |
| Texas | 853 | 463 | 343 | 77 | 30 | 8 | 0 | 5 | 390 | 328 | 38 | 24 |
| Mountain | 1,052 | 568 | 409 | 76 | 48 | 19 | 2 | 14 | 484 | 427 | 38 | 19 |
| Montana | 91 | 50 | 32 | 9 | 2 | 4 | 0 | 3 | 41 | 30 | 11 | 0 |
| Idaho | 102 | 45 | 40 | 4 | 0 | 0 | 1 | 0 | 57 | 49 | 3 | 5 |
| Wyoming | 76 | 50 | 47 | 1 | 2 | 0 | 0 | 0 | 26 | 18 | 5 | 3 |
| Colorado | 403 | 247 | 184 | 23 | 27 | 10 | 0 | 3 | 156 | 150 | 3 | 3 |
| New Mexico | 89 | 52 | 33 | 14 | 2 | 3 | 0 | 0 | 37 | 37 | 0 | 0 |
| Arizona | 164 | 71 | 32 | 17 | 12 | 2 | 1 | 7 | 93 | 75 | 11 | 7 |
| Utah | 84 | 30 | 24 | 5 | 1 | 0 | 0 | 0 | 54 | 51 | 3 | 0 |
| Nevada | 43 | 23 | 17 | 3 | 2 | 0 | 0 | 1 | 20 | 17 | 2 | 1 |
| Pacific | 3,001 | 1,439 | 838 | 358 | 118 | 41 | 20 | 64 | 1,502 | 1,281 | 159 | 122 |
| Washington | 429 | 261 | 151 | 63 | 19 | 11 | 6 | 11 | 168 | 125 | 27 | 16 |
| Oregon | 233 | 91 | 72 | 12 | 1 | 0 | 0 | 6 | 142 | 107 | 19 | 16 |
| California | 2,339 | 1,087 | 615 | 283 | 98 | 30 | 14 | 47 | 1,252 | 1,049 | 113 | 90 |
| Outlying areas | 762 | 313 | 227 | 64 | 12 | 1 | 0 | 9 | 449 | 421 | 11 | 17 |
| Alaska | 81 | 51 | 25 | 20 | 2 | 1 | 0 | 3 | 30 | 24 | 3 | 3 |
| Hawaii | 225 | 56 | 46 | 8 | 2 | 0 | 0 | 0 | 169 | 164 | 1 | 4 |
| Puerto Rico | 449 | 206 | 156 | 36 | 8 | 0 | 0 | 6 | 243 | 227 | 6 | 10 |
| Virgin Islands | 7 | 0 | 0 | 0 | 0 | 0 | 0 | 0 | 7 | 6 | 1 | 0 |
676 of 677 figures sit in a row or column sum that works out. 4 cells break a sum: 'Pacific', column 10: prints 1,502, columns 11 to 13 add to 1,562; 'Pacific', column 2: prints 3,001, the subtotals in columns 3 to 10 add to 2,941; 'Pacific', column 10: prints 1,502, rows 'Washington' to 'California' add to 1,562; 'Total', column 10: prints 10,508, the subtotals in rows 'New England' to 'Outlying areas' add to 10,448.
Reader’s notes
p. 237. 13 columns: stub, "All cases", seven unfair-labor-practice columns, four representation columns. The crop ends after Kansas — the table continues on the following page (South Atlantic and later divisions are not shown), and the footnote texts for the markers ^1 (on the stub heading) and ^2 (on CA, CB, CC, CD, CE, CP, RC, RM, RD) are not printed on this crop, so `footnotes` is empty. Michigan, "All cases" column: printed as "1 245" — the thousands comma did not ink in the scan; transcribed as "1,245", which the row's own components confirm (696 + 549 = 1,245). A small ink mark sits in the leader dots of the "New England" row label; it is a scan artifact, not a footnote marker. Narrow vertical running text along the right edge of the crop is from the facing page gutter, not part of the table. Arithmetic check: every state row (C components summing to All C, R components to All R, and All C + All R to All cases), every division subtotal, and the grand Total row all reconcile exactly as transcribed — no misprints detected.
p. 238. Continuation page: no column headings are printed on this crop, so header_rows is empty. The grid has 13 columns (stub + 12 numeric columns), read off the vertical rules; the running side-note "Appendix A" in the right margin is page furniture, not a column. The table continues from the preceding page (earlier regions and the US total are not on this crop). Doubtful cell: "Pacific", column 9 (the 9th numeric column, the one holding 1,153 / 475 / 699 / 484 / 449 in the other regional rows). I read the printed figure as 1,502, but the three Pacific state entries in that column (Washington 168, Oregon 142, California 1,252) sum to 1,562, and every other column in the Pacific block and in all five other regional blocks sums exactly to its regional line. The middle digit is most likely a 6 whose bowl has filled in this 1-bit scan; it is transcribed as read (1,502) rather than corrected. Two region/state totals are printed with the thousands comma missing or lost in the scan — Florida column 1 shows "1 291" and Mountain column 1 shows "1 052"; both are transcribed with the comma (1,291 and 1,052), and both are confirmed by their column sums (South Atlantic 3,023 and Mountain 1,052). A small stray ink/pen mark (an arrow-like flick) sits in the Pacific row just left of the 118 in column 5; it is a blemish on the page, not a footnote marker or a digit, and 118 is confirmed by the column sum 19+1+98. All other cells were verified by adding each region's state entries down all 12 numeric columns; every one of those 72 column sums matches the printed regional line, including several glyphs that are ambiguous at this resolution (Kentucky column 6 = 5, West Virginia column 3 = 56, Mountain column 2 = 568, Idaho column 12 = 5, Alaska column 2 = 51, Puerto Rico column 4 = 36). Row labels are set with leader dots, which have been dropped. No footnotes are printed under the table on this crop; the body ends at a plain horizontal rule.
Source image
Source data: U.S. NLRB Annual Reports (public domain). Reconstruction by NLRB Stats Archive. Read by claude-opus-5 (effort max, prompt extract_v1) from the 300-dpi scan; stitched by page. Updated October 2026.