NLRB Stats Archive › Annual Reports › FY1960 › Size of Units in Collective-Bargaining and Decertification Elections, Fiscal Year 1960
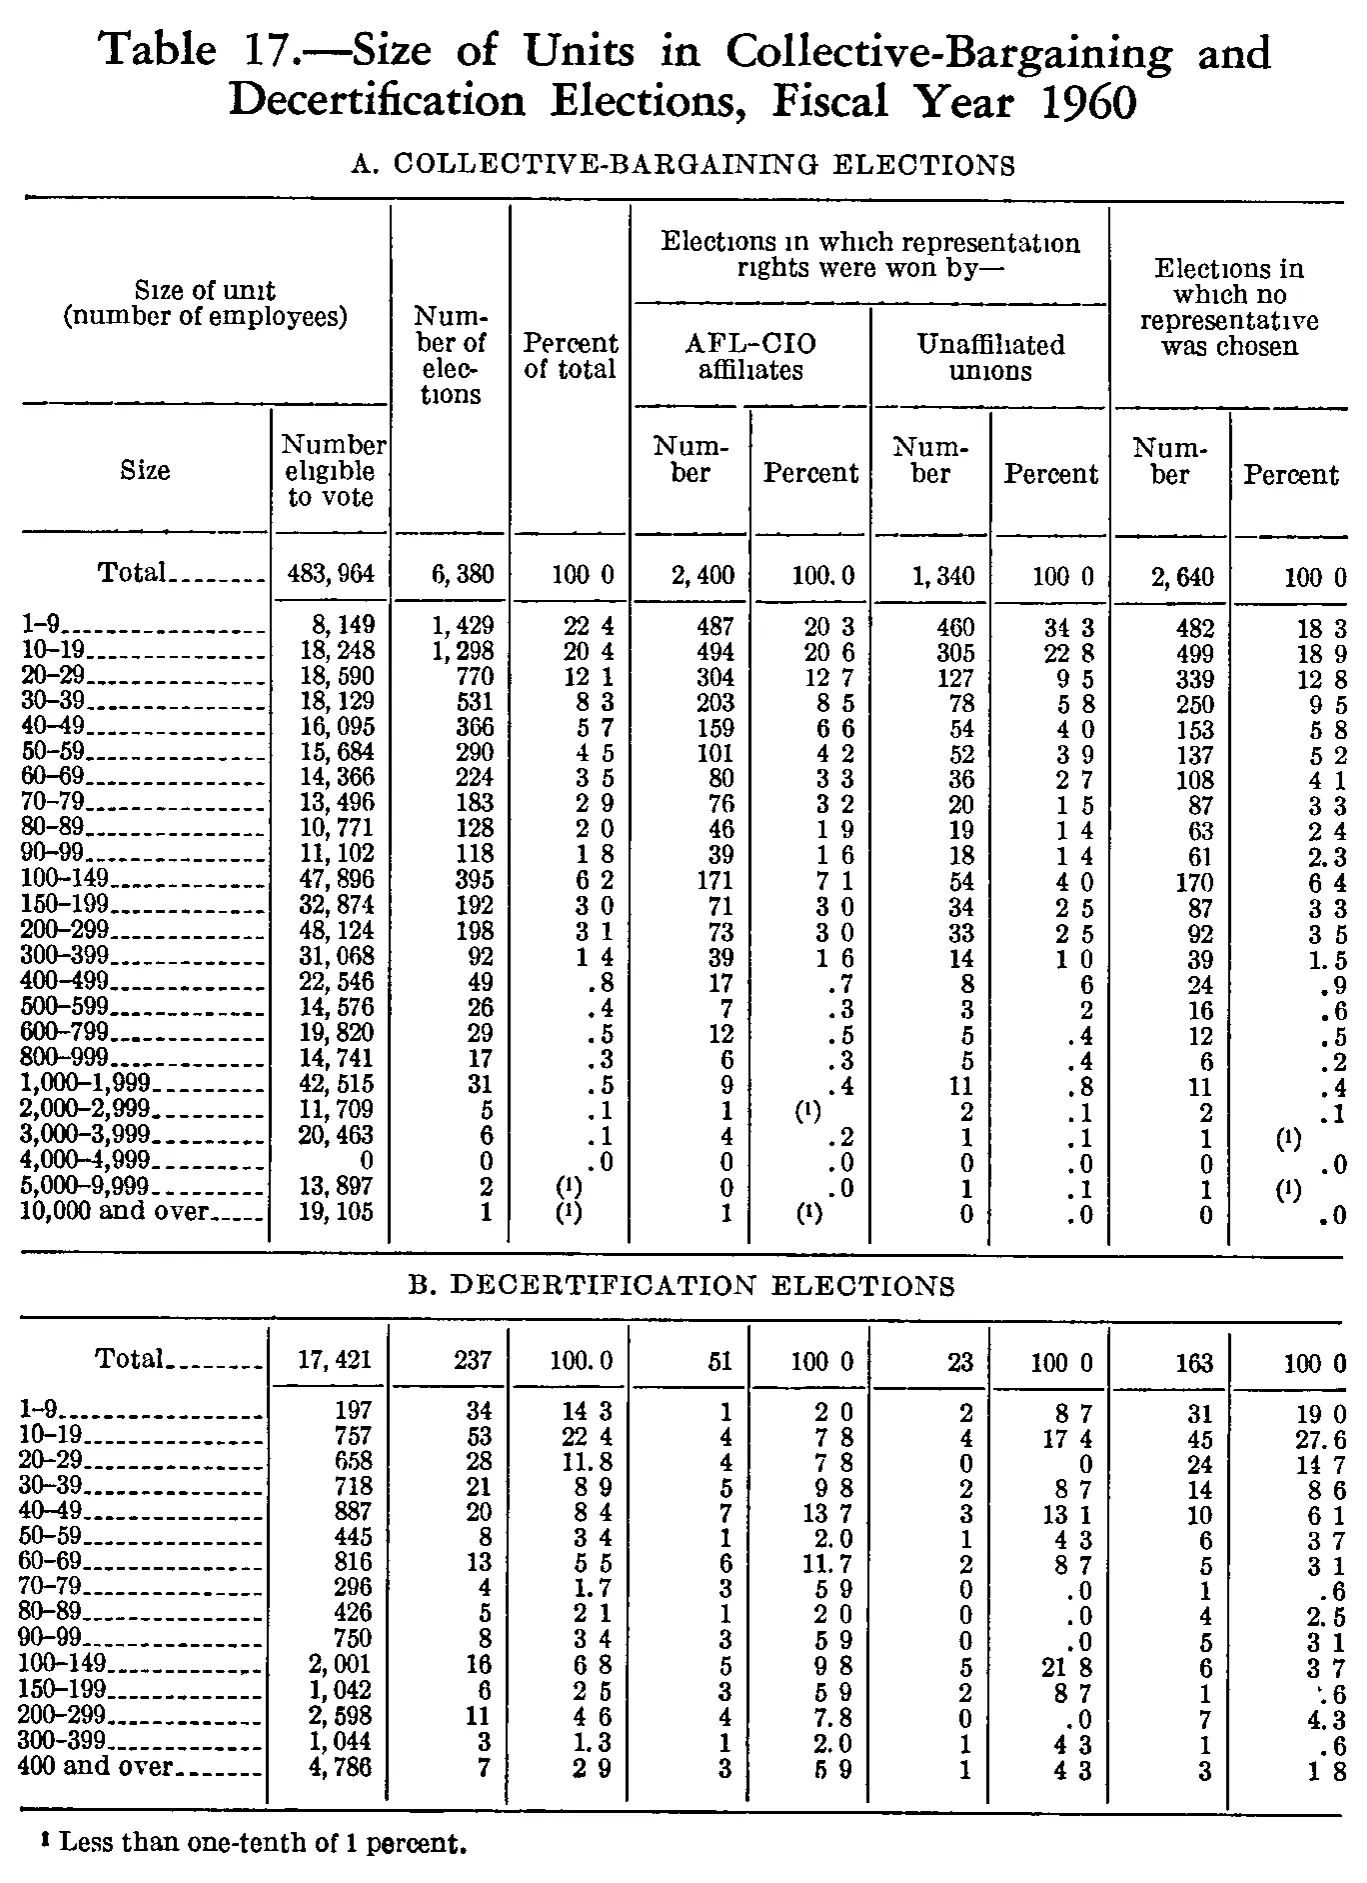
Size of Units in Collective-Bargaining and Decertification Elections, Fiscal Year 1960
| Size of unit (number of employees) | Size of unit (number of employees) | Number of elections | Percent of total | Elections in which representation rights were won by— | Elections in which no representative was chosen | ||||
|---|---|---|---|---|---|---|---|---|---|
| Size of unit (number of employees) | Size of unit (number of employees) | Number of elections | Percent of total | AFL-CIO affiliates | Unaffiliated unions | Elections in which no representative was chosen | |||
| Size | Number eligible to vote | Number of elections | Percent of total | Number | Percent | Number | Percent | Number | Percent |
| A. COLLECTIVE-BARGAINING ELECTIONS | |||||||||
| Total | 483,964 | 6,380 | 100.0 | 2,400 | 100.0 | 1,340 | 100.0 | 2,640 | 100.0 |
| 1-9 | 8,149 | 1,429 | 22.4 | 487 | 20.3 | 460 | 34.3 | 482 | 18.3 |
| 10-19 | 18,248 | 1,298 | 20.4 | 494 | 20.6 | 305 | 22.8 | 499 | 18.9 |
| 20-29 | 18,590 | 770 | 12.1 | 304 | 12.7 | 127 | 9.5 | 339 | 12.8 |
| 30-39 | 18,129 | 531 | 8.3 | 203 | 8.5 | 78 | 5.8 | 250 | 9.5 |
| 40-49 | 16,095 | 366 | 5.7 | 159 | 6.6 | 54 | 4.0 | 153 | 5.8 |
| 50-59 | 15,684 | 290 | 4.5 | 101 | 4.2 | 52 | 3.9 | 137 | 5.2 |
| 60-69 | 14,366 | 224 | 3.5 | 80 | 3.3 | 36 | 2.7 | 108 | 4.1 |
| 70-79 | 13,496 | 183 | 2.9 | 76 | 3.2 | 20 | 1.5 | 87 | 3.3 |
| 80-89 | 10,771 | 128 | 2.0 | 46 | 1.9 | 19 | 1.4 | 63 | 2.4 |
| 90-99 | 11,102 | 118 | 1.8 | 39 | 1.6 | 18 | 1.4 | 61 | 2.3 |
| 100-149 | 47,896 | 395 | 6.2 | 171 | 7.1 | 54 | 4.0 | 170 | 6.4 |
| 150-199 | 32,874 | 192 | 3.0 | 71 | 3.0 | 34 | 2.5 | 87 | 3.3 |
| 200-299 | 48,124 | 198 | 3.1 | 73 | 3.0 | 33 | 2.5 | 92 | 3.5 |
| 300-399 | 31,068 | 92 | 1.4 | 39 | 1.6 | 14 | 1.0 | 39 | 1.5 |
| 400-499 | 22,546 | 49 | .8 | 17 | .7 | 8 | .6 | 24 | .9 |
| 500-599 | 14,576 | 26 | .4 | 7 | .3 | 3 | .2 | 16 | .6 |
| 600-799 | 19,820 | 29 | .5 | 12 | .5 | 5 | .4 | 12 | .5 |
| 800-999 | 14,741 | 17 | .3 | 6 | .3 | 5 | .4 | 6 | .2 |
| 1,000-1,999 | 42,515 | 31 | .5 | 9 | .4 | 11 | .8 | 11 | .4 |
| 2,000-2,999 | 11,709 | 5 | .1 | 1 | 2 | .1 | 2 | .1 | |
| 3,000-3,999 | 20,463 | 6 | .1 | 4 | .2 | 1 | .1 | 1 | |
| 4,000-4,999 | 0 | 0 | .0 | 0 | .0 | 0 | .0 | 0 | .0 |
| 5,000-9,999 | 13,897 | 2 | 0 | .0 | 1 | .1 | 1 | ||
| 10,000 and over | 19,105 | 1 | 1 | 0 | .0 | 0 | .0 | ||
| B. DECERTIFICATION ELECTIONS | |||||||||
| Total | 17,421 | 237 | 100.0 | 51 | 100.0 | 23 | 100.0 | 163 | 100.0 |
| 1-9 | 197 | 34 | 14.3 | 1 | 2.0 | 2 | 8.7 | 31 | 19.0 |
| 10-19 | 757 | 53 | 22.4 | 4 | 7.8 | 4 | 17.4 | 45 | 27.6 |
| 20-29 | 658 | 28 | 11.8 | 4 | 7.8 | 0 | 0 | 24 | 14.7 |
| 30-39 | 718 | 21 | 8.9 | 5 | 9.8 | 2 | 8.7 | 14 | 8.6 |
| 40-49 | 887 | 20 | 8.4 | 7 | 13.7 | 3 | 13.1 | 10 | 6.1 |
| 50-59 | 445 | 8 | 3.4 | 1 | 2.0 | 1 | 4.3 | 6 | 3.7 |
| 60-69 | 816 | 13 | 5.5 | 6 | 11.7 | 2 | 8.7 | 5 | 3.1 |
| 70-79 | 296 | 4 | 1.7 | 3 | 5.9 | 0 | .0 | 1 | .6 |
| 80-89 | 426 | 5 | 2.1 | 1 | 2.0 | 0 | .0 | 4 | 2.5 |
| 90-99 | 750 | 8 | 3.4 | 3 | 5.9 | 0 | .0 | 5 | 3.1 |
| 100-149 | 2,001 | 16 | 6.8 | 5 | 9.8 | 5 | 21.8 | 6 | 3.7 |
| 150-199 | 1,042 | 6 | 2.5 | 3 | 5.9 | 2 | 8.7 | 1 | .6 |
| 200-299 | 2,598 | 11 | 4.6 | 4 | 7.8 | 0 | .0 | 7 | 4.3 |
| 300-399 | 1,044 | 3 | 1.3 | 1 | 2.0 | 1 | 4.3 | 1 | .6 |
| 400 and over | 4,786 | 7 | 2.9 | 3 | 5.9 | 1 | 4.3 | 3 | 1.8 |
- 1 Less than one-tenth of 1 percent.
192 of 192 figures sit in a row or column sum that works out.
Reader’s notes
p. 215. Ten columns: stub (size class), "Number eligible to vote", "Number of elections", "Percent of total", then Number/Percent pairs for AFL-CIO affiliates, Unaffiliated unions, and "Elections in which no representative was chosen". The stub heading "Size of unit (number of employees)" spans columns 0-1 over the lower-level cells "Size" and "Number eligible to vote"; "Number of elections" and "Percent of total" are tall single headings repeated in all three levels. The two panel titles "A. COLLECTIVE-BARGAINING ELECTIONS" (printed above the column head) and "B. DECERTIFICATION ELECTIONS" (printed between the two bodies) are carried as label-only section rows. Panel B repeats no headings of its own; it uses the same columns as panel A. Decimal points: this 1-bit scan drops many printed periods in the percent columns, leaving a gap (e.g. "22 4", "100 0"); the period is clearly visible in other cells of the same columns ("100. 0", "11.8", "2.3", "27.6"). I have restored the decimal point in every such cell, since each percent column is printed to one decimal place throughout. No other characters were altered. The footnote-1 reference is printed as a raised 1 inside parentheses standing alone as a cell value, meaning "less than one-tenth of 1 percent"; written here as (^1). Doubtful cell: panel B, row "20-29", Unaffiliated unions / Percent, printed as a bare "0" with no visible leading period, where every other zero in that column reads ".0". Transcribed as seen; it is almost certainly ".0". Arithmetic check (not applied to any cell, reported only): every numeric column in both panels sums exactly to its printed total — panel A columns sum to 483,964 / 6,380 / 2,400 / 1,340 / 2,640 and panel B to 17,421 / 237 / 51 / 23 / 163 — and in every row the three "won by" counts plus the "no representative" count equal the row's number of elections. Two printed percentages differ from the recomputed value in the last digit: panel A row "10-19" Percent of total prints 20.4 (1,298/6,380 = 20.35) and row "90-99" Unaffiliated Percent prints 1.4 (18/1,340 = 1.34). Both are transcribed as printed.
Source image
Source data: U.S. NLRB Annual Reports (public domain). Reconstruction by NLRB Stats Archive. Read by claude-opus-5 (effort max, prompt extract_v1) from the 300-dpi scan; stitched by page. Updated October 2026.