NLRB Stats Archive › Annual Reports › FY1960 › Industrial Distribution of Collective-Bargaining Elections, Fiscal Year 1960
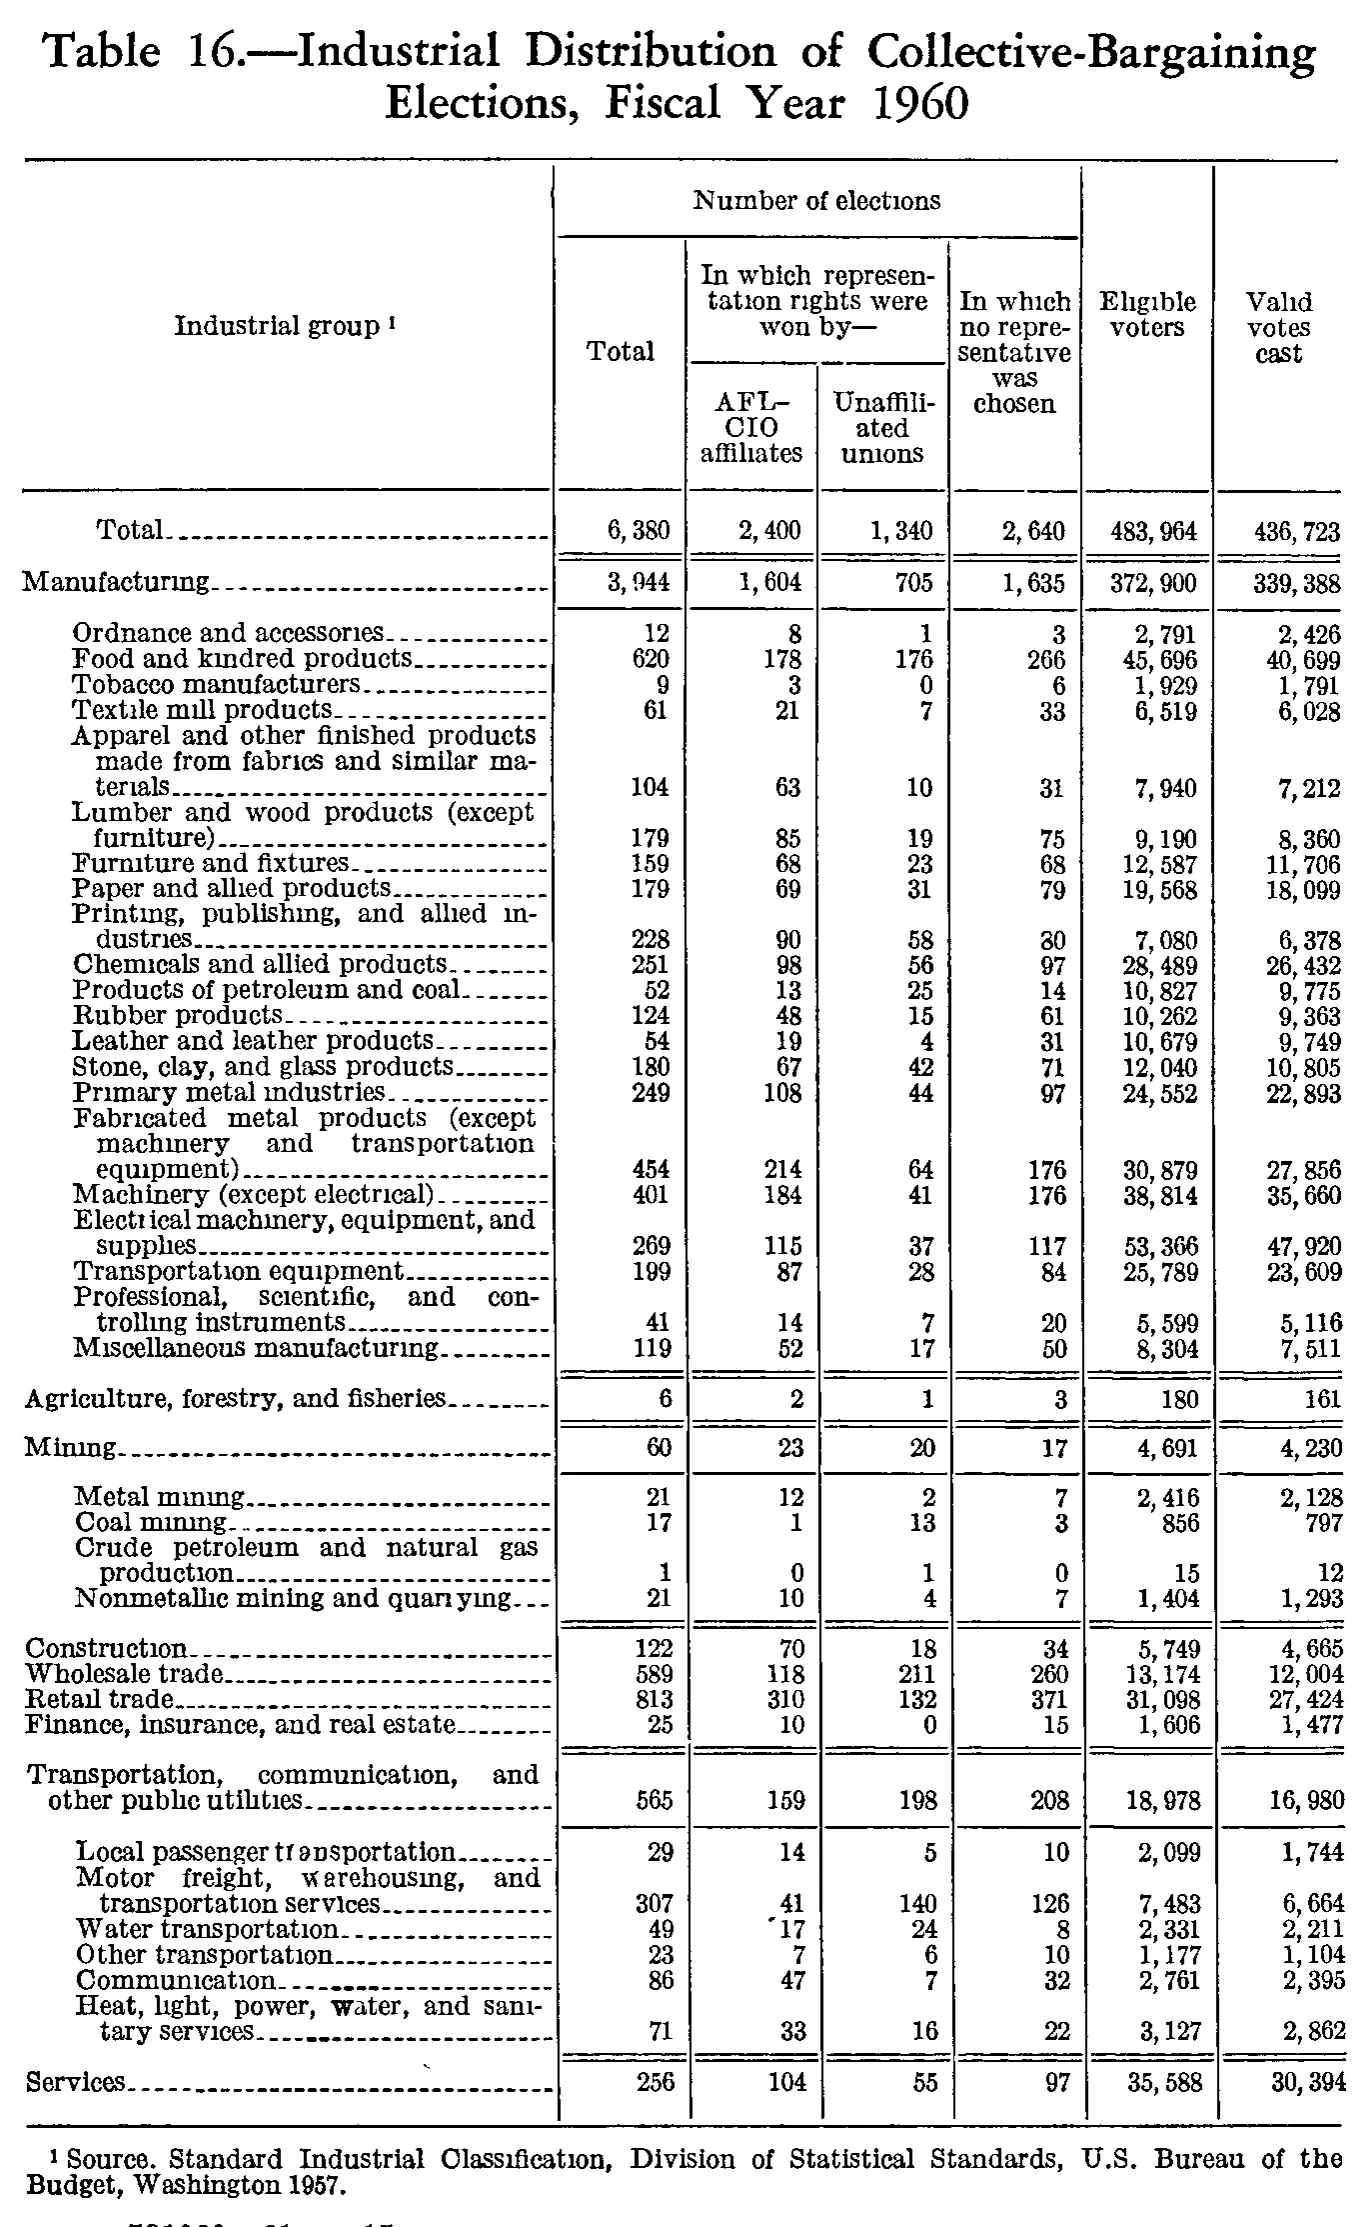
Industrial Distribution of Collective-Bargaining Elections, Fiscal Year 1960
| Industrial group | Number of elections | Eligible voters | Valid votes cast | |||
|---|---|---|---|---|---|---|
| Industrial group | Total | In which representation rights were won by— | In which no representative was chosen | Eligible voters | Valid votes cast | |
| Industrial group | Total | AFL-CIO affiliates | Unaffiliated unions | In which no representative was chosen | Eligible voters | Valid votes cast |
| Total | 6,380 | 2,400 | 1,340 | 2,640 | 483,964 | 436,723 |
| Manufacturing | 3,944 | 1,604 | 705 | 1,635 | 372,900 | 339,388 |
| Ordnance and accessories | 12 | 8 | 1 | 3 | 2,791 | 2,426 |
| Food and kindred products | 620 | 178 | 176 | 266 | 45,696 | 40,699 |
| Tobacco manufacturers | 9 | 3 | 0 | 6 | 1,929 | 1,791 |
| Textile mill products | 61 | 21 | 7 | 33 | 6,519 | 6,028 |
| Apparel and other finished products made from fabrics and similar materials | 104 | 63 | 10 | 31 | 7,940 | 7,212 |
| Lumber and wood products (except furniture) | 179 | 85 | 19 | 75 | 9,190 | 8,360 |
| Furniture and fixtures | 159 | 68 | 23 | 68 | 12,587 | 11,706 |
| Paper and allied products | 179 | 69 | 31 | 79 | 19,568 | 18,099 |
| Printing, publishing, and allied industries | 228 | 90 | 58 | 80 | 7,080 | 6,378 |
| Chemicals and allied products | 251 | 98 | 56 | 97 | 28,489 | 26,432 |
| Products of petroleum and coal | 52 | 13 | 25 | 14 | 10,827 | 9,775 |
| Rubber products | 124 | 48 | 15 | 61 | 10,262 | 9,363 |
| Leather and leather products | 54 | 19 | 4 | 31 | 10,679 | 9,749 |
| Stone, clay, and glass products | 180 | 67 | 42 | 71 | 12,040 | 10,805 |
| Primary metal industries | 249 | 108 | 44 | 97 | 24,552 | 22,893 |
| Fabricated metal products (except machinery and transportation equipment) | 454 | 214 | 64 | 176 | 30,879 | 27,856 |
| Machinery (except electrical) | 401 | 184 | 41 | 176 | 38,814 | 35,660 |
| Electrical machinery, equipment, and supplies | 269 | 115 | 37 | 117 | 53,366 | 47,920 |
| Transportation equipment | 199 | 87 | 28 | 84 | 25,789 | 23,609 |
| Professional, scientific, and controlling instruments | 41 | 14 | 7 | 20 | 5,599 | 5,116 |
| Miscellaneous manufacturing | 119 | 52 | 17 | 50 | 8,304 | 7,511 |
| Agriculture, forestry, and fisheries | 6 | 2 | 1 | 3 | 180 | 161 |
| Mining | 60 | 23 | 20 | 17 | 4,691 | 4,230 |
| Metal mining | 21 | 12 | 2 | 7 | 2,416 | 2,128 |
| Coal mining | 17 | 1 | 13 | 3 | 856 | 797 |
| Crude petroleum and natural gas production | 1 | 0 | 1 | 0 | 15 | 12 |
| Nonmetallic mining and quarrying | 21 | 10 | 4 | 7 | 1,404 | 1,293 |
| Construction | 122 | 70 | 18 | 34 | 5,749 | 4,665 |
| Wholesale trade | 589 | 118 | 211 | 260 | 13,174 | 12,004 |
| Retail trade | 813 | 310 | 132 | 371 | 31,098 | 27,424 |
| Finance, insurance, and real estate | 25 | 10 | 0 | 15 | 1,606 | 1,477 |
| Transportation, communication, and other public utilities | 565 | 159 | 198 | 208 | 18,978 | 16,980 |
| Local passenger transportation | 29 | 14 | 5 | 10 | 2,099 | 1,744 |
| Motor freight, warehousing, and transportation services | 307 | 41 | 140 | 126 | 7,483 | 6,664 |
| Water transportation | 49 | 17 | 24 | 8 | 2,331 | 2,211 |
| Other transportation | 23 | 7 | 6 | 10 | 1,177 | 1,104 |
| Communication | 86 | 47 | 7 | 32 | 2,761 | 2,395 |
| Heat, light, power, water, and sanitary services | 71 | 33 | 16 | 22 | 3,127 | 2,862 |
| Services | 256 | 104 | 55 | 97 | 35,588 | 30,394 |
- 1 Source. Standard Industrial Classification, Division of Statistical Standards, U.S. Bureau of the Budget, Washington 1957.
242 of 242 figures sit in a row or column sum that works out.
Reader’s notes
p. 214. Seven columns: stub plus four under the spanner "Number of elections" (Total; AFL-CIO affiliates and Unaffiliated unions under the sub-spanner "In which representation rights were won by—"; "In which no representative was chosen"), then "Eligible voters" and "Valid votes cast", which are tall single headings spanning all three heading levels. The table is internally consistent; every check I ran reconciles exactly, which is the main basis for the high confidence. In each row the three election columns sum to the Total column; the 21 manufacturing sub-industries sum to the Manufacturing line (3,944 / 372,900 / 339,388), the four mining sub-industries to the Mining line, and the six transportation sub-industries to the Transportation, communication, and other public utilities line, in all six columns; and the nine major groups (Manufacturing, Agriculture, Mining, Construction, Wholesale trade, Retail trade, Finance, Transportation, Services) sum to the Total row in all six columns (6,380 / 2,400 / 1,340 / 2,640 / 483,964 / 436,723). No printed figure appears to be a misprint. Scan artifacts that do not affect the reading: the stub labels print as "quarıying" (transcribed "quarrying"), "tı ansportation" ("transportation") and "w arehousing" ("warehousing") because of broken type and the dotless-i rendering common in this scan; a stray tick precedes the 17 in the AFL-CIO affiliates cell of "Water transportation" and is ink, not a digit or a footnote marker. In the footnote, the punctuation after "Source" reads as a period but is most likely a comma in the original setting; I transcribed what is visible. Indentation is not representable in the grid: the 21 industries after "Manufacturing", the four after "Mining", and the six after "Transportation, communication, and other public utilities" are indented sub-rows of those group lines, so summing the stub column indiscriminately would double-count. The crop ends just below the footnote; a partial printer's signature line ("581932—61——15" or similar) is visible at the very bottom edge and is not part of the table. "Services" carries no sub-industry breakdown here, but since the major groups already sum to the Total row the table is complete as printed, not cut off.
Source image
Source data: U.S. NLRB Annual Reports (public domain). Reconstruction by NLRB Stats Archive. Read by claude-opus-5 (effort max, prompt extract_v1) from the 300-dpi scan; stitched by page. Updated October 2026.