NLRB Stats Archive › Annual Reports › FY1960 › Representation elections held — by geographic division and State
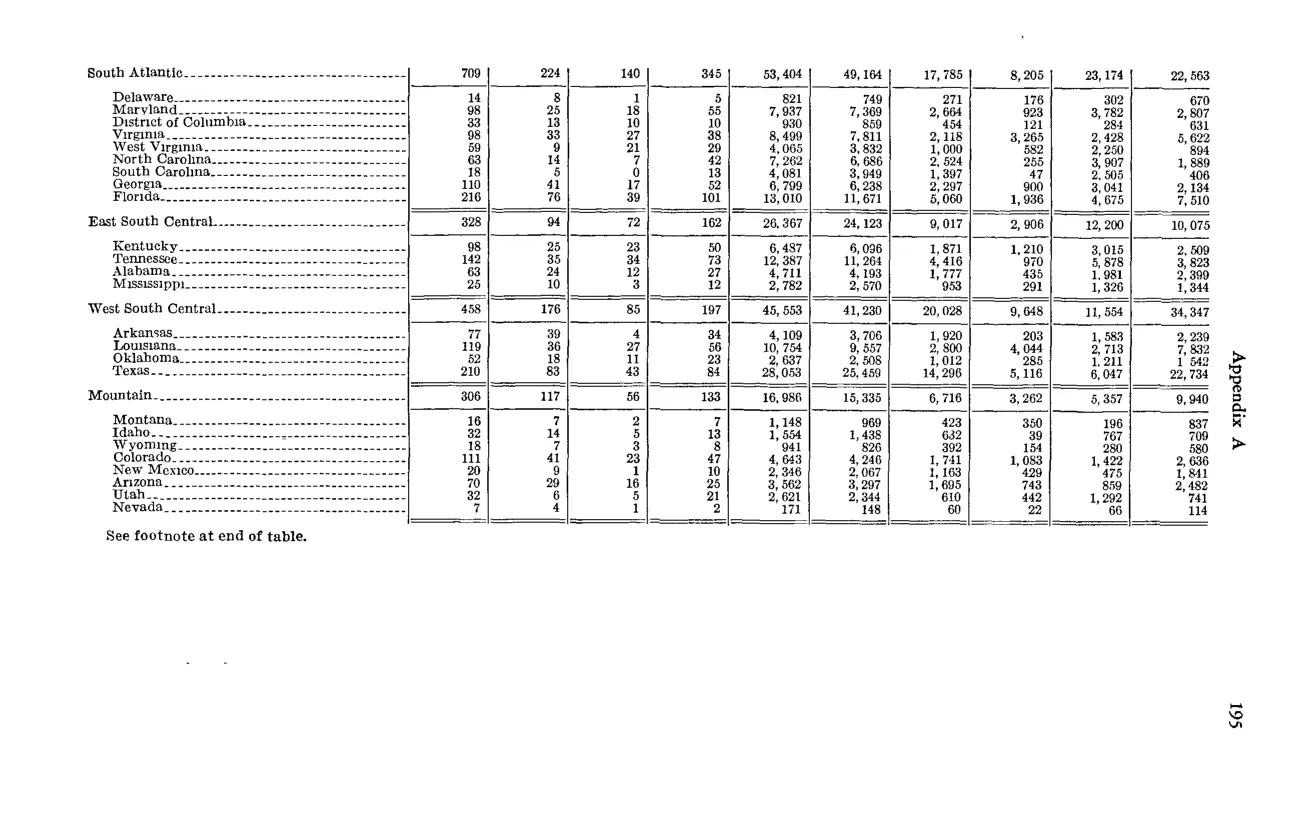
Representation elections held — by geographic division and State
| Division and State | Total | Number of elections in which representation rights were won by | Number of elections in which representation rights were won by | In which no representative was chosen | Employees eligible to vote | Total valid votes cast | Valid votes cast for | Valid votes cast for | Valid votes cast for | Employees in units choosing representation |
|---|---|---|---|---|---|---|---|---|---|---|
| AFL-CIO affiliates | Unaffiliated unions | AFL-CIO affiliates | Unaffiliated unions | No union | ||||||
| South Atlantic | 709 | 226 | 140 | 343 | 53,406 | 49,194 | 17,785 | 8,205 | 23,174 | 32,679 |
| East South Central | 328 | 94 | 72 | 162 | 26,367 | 24,123 | 9,017 | 2,936 | 12,200 | 16,073 |
| West South Central | 458 | 176 | 83 | 199 | 45,553 | 41,230 | 20,028 | 9,648 | 11,554 | 24,347 |
| Mountain | 306 | 117 | 56 | 133 | 16,486 | 15,335 | 6,716 | 3,262 | 5,337 | 9,940 |
| State |
Source image
Source data: U.S. NLRB Annual Reports (public domain). Reconstruction by NLRB Stats Archive. Updated June 2026.