NLRB Stats Archive › Annual Reports › FY1960 › Outcome of collective-bargaining elections
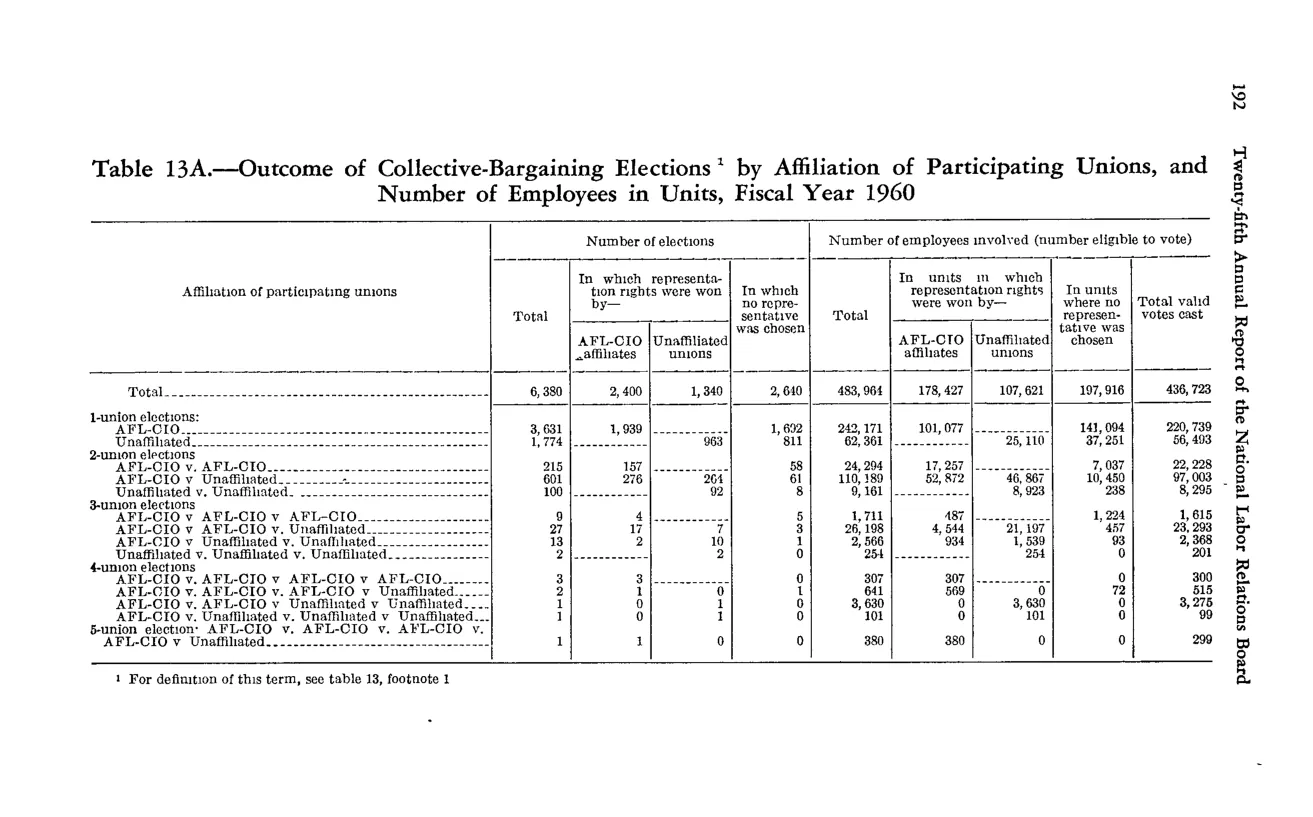
Outcome of collective-bargaining elections
| Affiliation of participating unions | Number of elections | Number of elections | Number of elections | Number of elections | Number of employees involved (number eligible to vote) | Number of employees involved (number eligible to vote) | Number of employees involved (number eligible to vote) | Number of employees involved (number eligible to vote) | Number of employees involved (number eligible to vote) |
|---|---|---|---|---|---|---|---|---|---|
| Total | In which representation rights were won by AFL-CIO affiliates | In which representation rights were won by Unaffiliated unions | In which no representative was chosen | Total | In units where representation rights were won by AFL-CIO affiliates | In units where representation rights were won by Unaffiliated unions | In units where no representative was chosen | Total valid votes cast | |
| Total | 6,380 | 2,400 | 1,340 | 2,640 | 483,964 | 178,427 | 107,621 | 197,916 | 436,723 |
| 1-union elections — AFL-CIO | 3,651 | 1,989 | 1,662 | 242,171 | 101,007 | 141,164 | 220,739 | ||
| 1-union elections — Unaffiliated | 1,774 | 955 | 819 | 62,361 | 34,734 | 27,627 | 56,403 | ||
| 2-union elections + 3-union + 4-union + 5-union |
Source image
Source data: U.S. NLRB Annual Reports (public domain). Reconstruction by NLRB Stats Archive. Updated June 2026.