NLRB Stats Archive › Annual Reports › FY1960 › Geographic distribution of cases received — by division and State
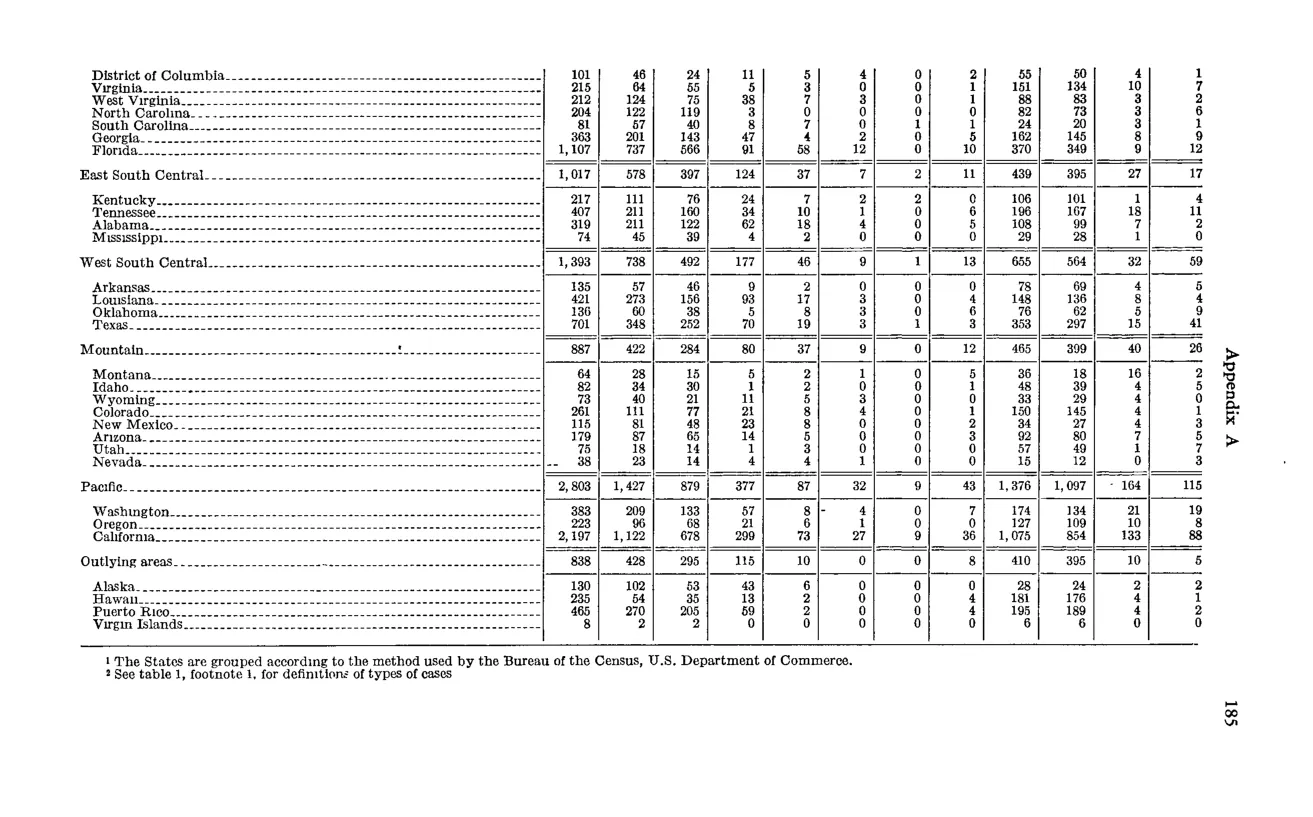
Geographic distribution of cases received — by division and State
| Division and State 1 | All cases | Unfair labor practice cases | Unfair labor practice cases | Unfair labor practice cases | Unfair labor practice cases | Unfair labor practice cases | Unfair labor practice cases | Representation cases | Representation cases | Representation cases | Representation cases | |
|---|---|---|---|---|---|---|---|---|---|---|---|---|
| All C cases | CA | CB | CC | CD | CE | CP | All R cases | RC | RM | RD | ||
| South Atlantic states (DC, VA, WV, NC, SC, GA, FL) | ||||||||||||
| East South Central | 1,017 | 578 | 397 | 124 | 37 | 7 | 2 | 11 | 439 | 395 | 27 | 17 |
| West South Central | 1,393 | 738 | 492 | 177 | 46 | 9 | 1 | 13 | 655 | 564 | 32 | 59 |
| Mountain | 887 | 422 | 284 | 80 | 37 | 9 | 0 | 12 | 465 | 399 | 40 | 23 |
| Pacific | 2,803 | 1,427 | 879 | 377 | 87 | 32 | 9 | 43 | 1,376 | 1,097 | 164 | 115 |
| Outlying areas | 838 | 428 | 295 | 115 | 10 | 0 | 0 | 8 | 410 | 395 | 10 | 5 |
| Additional |
Source image
Source data: U.S. NLRB Annual Reports (public domain). Reconstruction by NLRB Stats Archive. Updated June 2026.