NLRB Stats Archive › Annual Reports › FY1959 › Results of elections in which representation rights were won
Results of elections in which representation rights were won
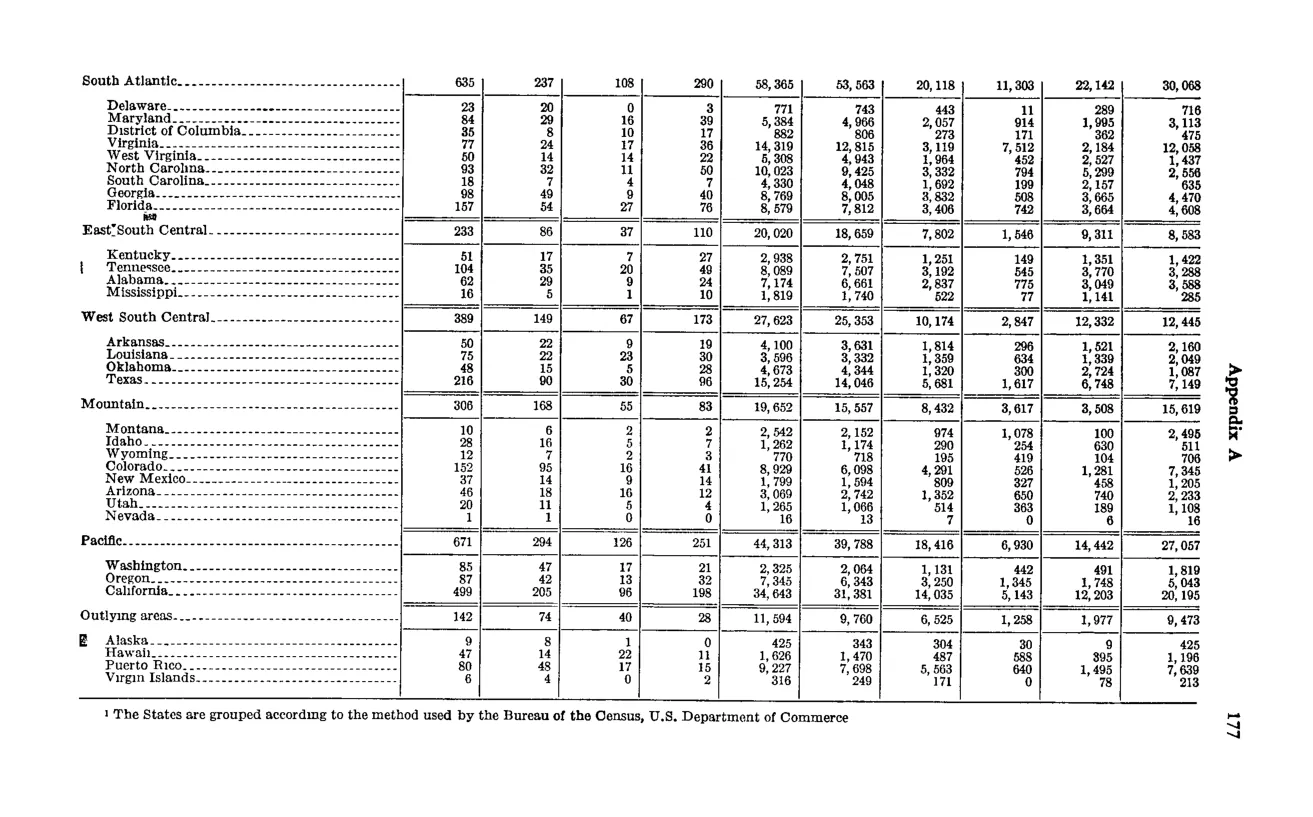
| Division and State 1 | Total | Number of elections in which representation rights were won by: | Number of elections in which representation rights were won by: | In which no representative was chosen | Employees eligible to vote | Total valid votes cast | Valid votes cast for — | Valid votes cast for — | Valid votes cast for — | Employees in units representation |
|---|---|---|---|---|---|---|---|---|---|---|
| AFL-CIO affiliates | Unaffiliated unions | AFL-CIO affiliates | Unaffiliated unions | No union | ||||||
| South Atlantic | 635 | 237 | 108 | 290 | 58,365 | 53,453 | 20,118 | 11,303 | 22,142 | 30,098 |
| Additional South Atlantic states (DE, MD, DC, VA, WV, NC, SC, GA, FL) | ||||||||||
| East South Central | 233 | 85 | 37 | 110 | 20,020 | 18,690 | 7,802 | 1,546 | 9,311 | 8,553 |
| Additional East South Central states (KY, TN, AL, MS) | ||||||||||
| West South Central | 389 | 149 | 67 | 173 | 27,623 | 25,330 | 10,174 | 2,847 | 12,332 | 12,445 |
| Additional West South Central states (AR, LA, OK, TX) | ||||||||||
| Mountain | 306 | 168 | 55 | 83 | 19,652 | 15,357 | 8,432 | 3,417 | 3,508 | 15,019 |
| Additional Mountain states (MT, ID, WY, CO, NM, AZ, UT, NV) | ||||||||||
| Pacific | 671 | 294 | 126 | 251 | 44,313 | 39,788 | 18,416 | 6,930 | 14,442 | 27,667 |
| Additional Pacific states (WA, OR, CA) | ||||||||||
| Outlying areas | 142 | 74 | 40 | 28 | 11,094 | 9,780 | 6,523 | 1,236 | 1,977 | 9,473 |
| Additional outlying area |
Source image
Source data: U.S. NLRB Annual Reports (public domain). Reconstruction by NLRB Stats Archive. Updated June 2026.