NLRB Stats Archive › Annual Reports › FY1959 › Disposition of Representation Cases Closed, Fiscal Year 1959
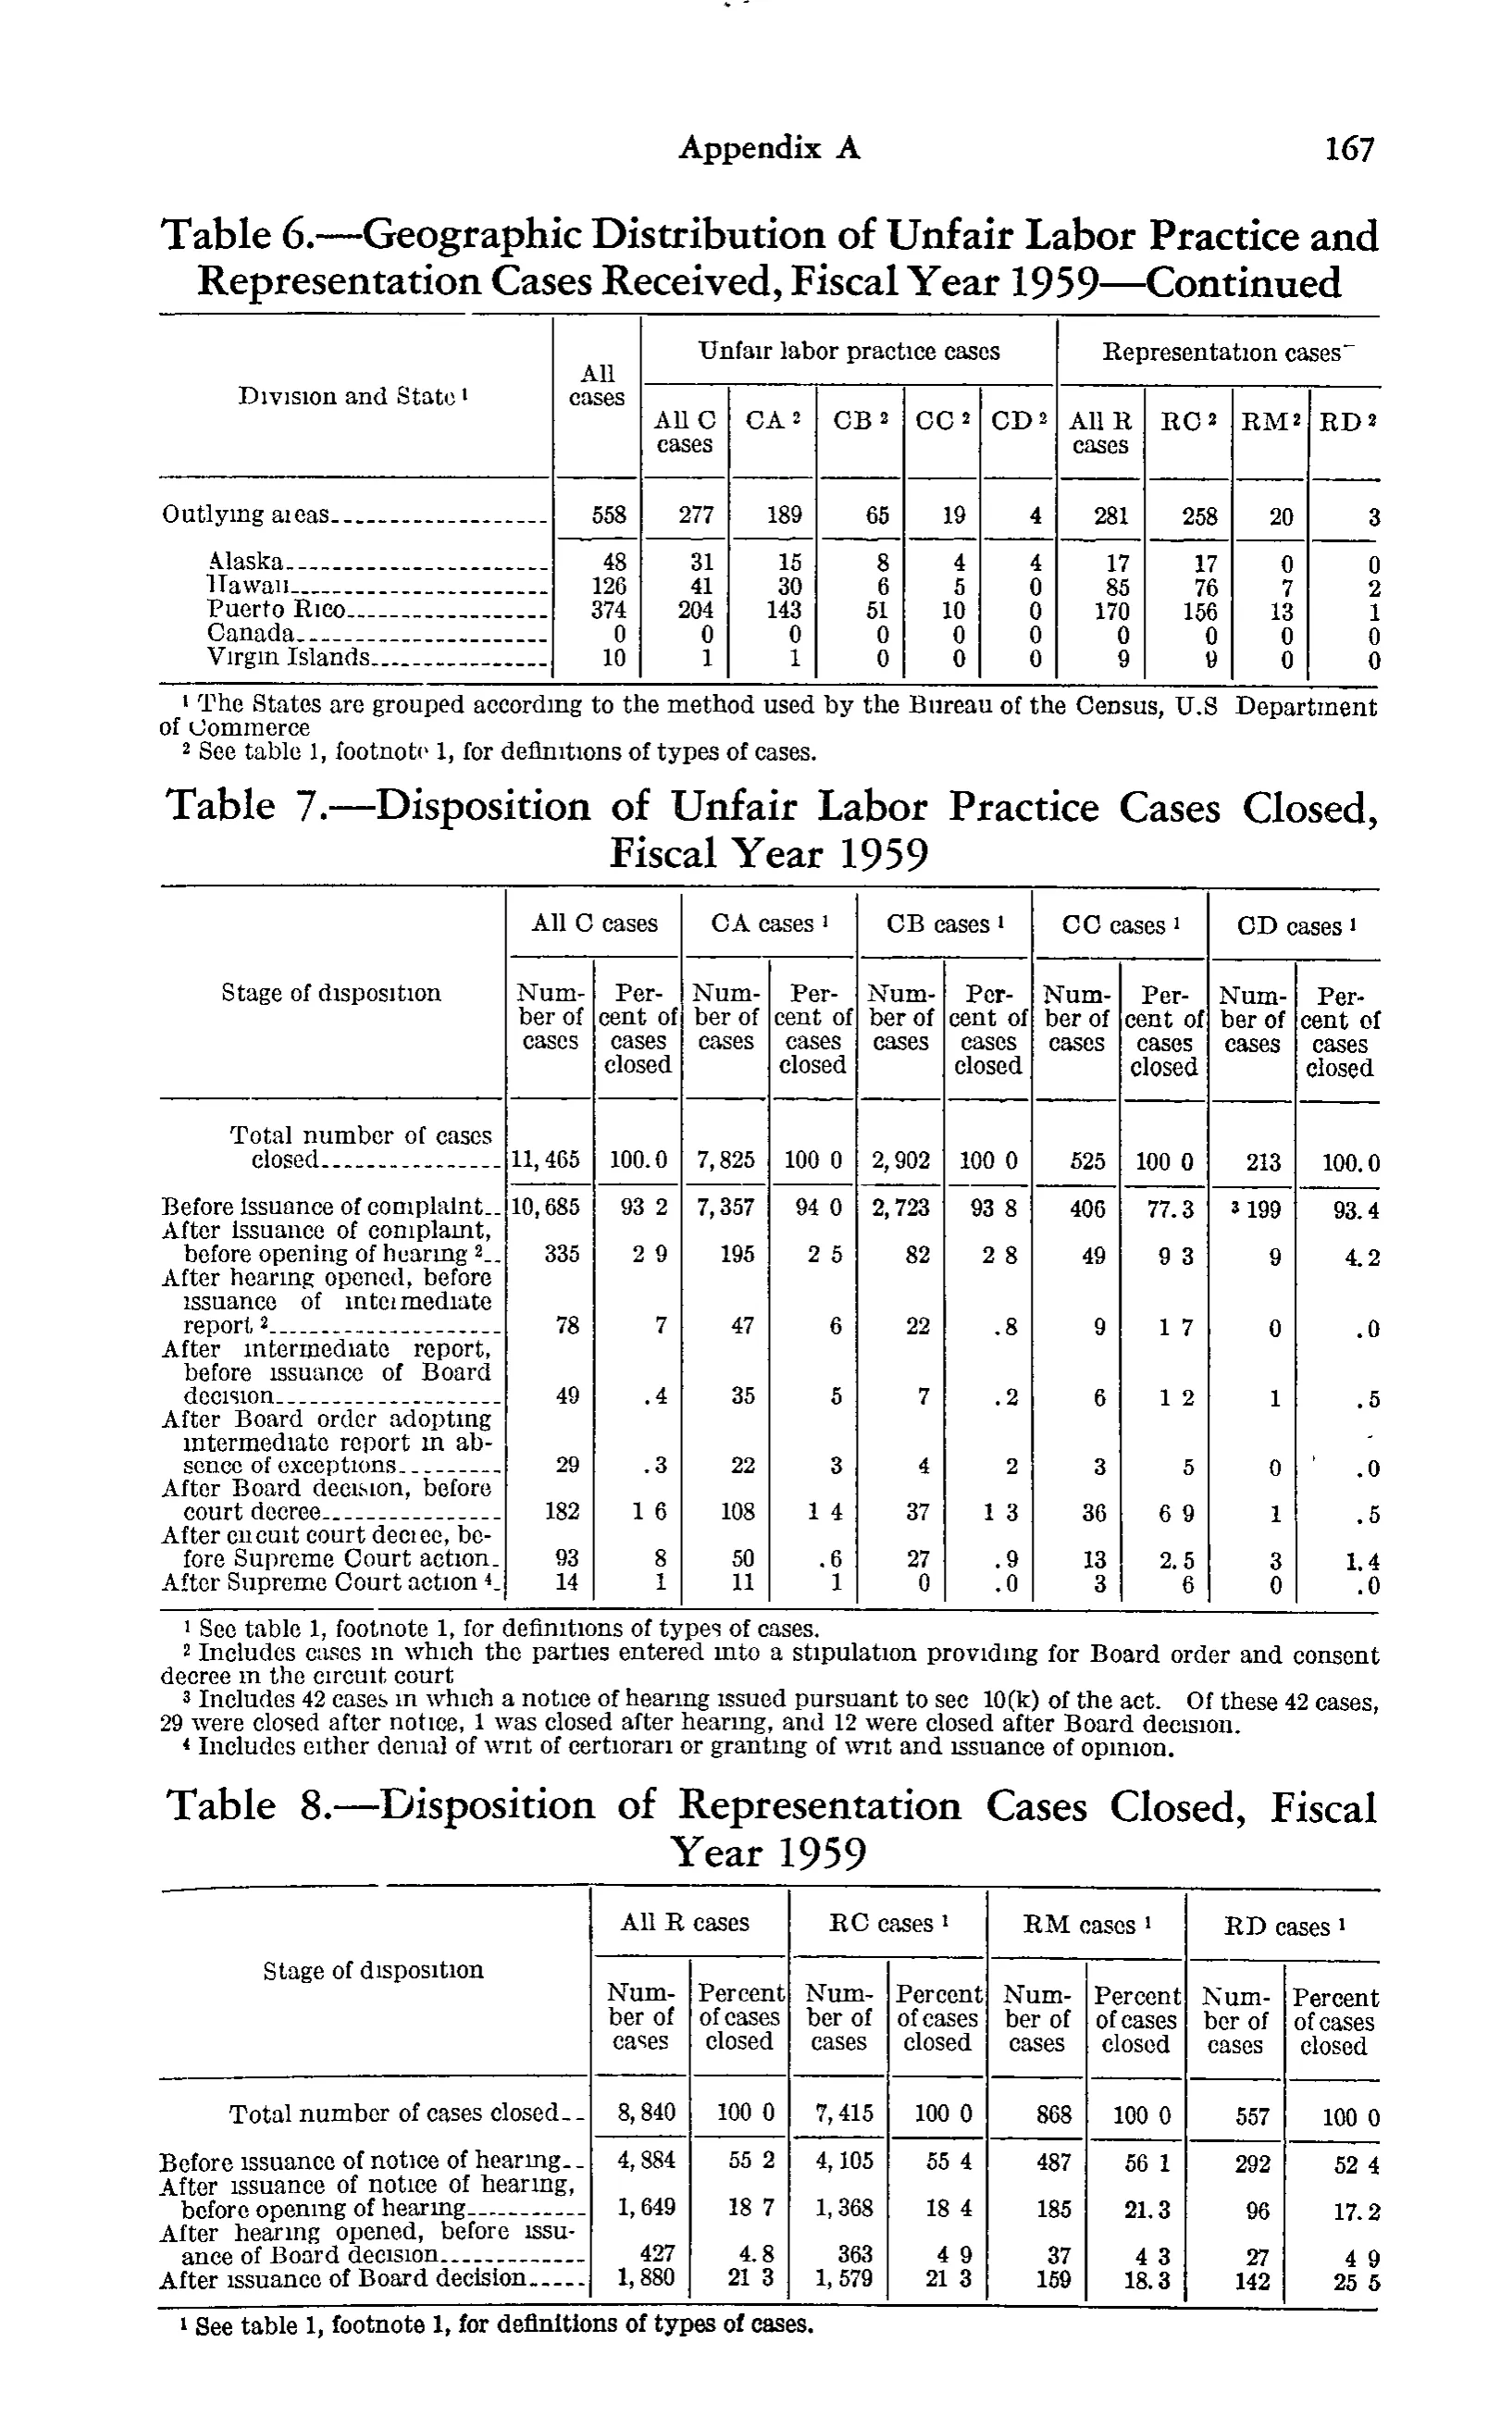
Disposition of Representation Cases Closed, Fiscal Year 1959
| Stage of disposition | All C cases | CA cases | CB cases | CC cases | CD cases | |||||
|---|---|---|---|---|---|---|---|---|---|---|
| Stage of disposition | Number of cases | Percent of cases closed | Number of cases | Percent of cases closed | Number of cases | Percent of cases closed | Number of cases | Percent of cases closed | Number of cases | Percent of cases closed |
| Total number of cases closed | 11,465 | 100.0 | 7,825 | 100.0 | 2,902 | 100.0 | 525 | 100.0 | 213 | 100.0 |
| Before issuance of complaint | 10,685 | 93.2 | 7,357 | 94.0 | 2,723 | 93.8 | 406 | 77.3 | 199 | 93.4 |
| After issuance of complaint, before opening of hearing | 335 | 2.9 | 195 | 2.5 | 82 | 2.8 | 49 | 9.3 | 9 | 4.2 |
| After hearing opened, before issuance of intermediate report | 78 | .7 | 47 | .6 | 22 | .8 | 9 | 1.7 | 0 | .0 |
| After intermediate report, before issuance of Board decision | 49 | .4 | 35 | .5 | 7 | .2 | 6 | 1.2 | 1 | .5 |
| After Board order adopting intermediate report in absence of exceptions | 29 | .3 | 22 | .3 | 4 | .2 | 3 | .5 | 0 | .0 |
| After Board decision, before court decree | 182 | 1.6 | 108 | 1.4 | 37 | 1.3 | 36 | 6.9 | 1 | .5 |
| After circuit court decree, before Supreme Court action | 93 | .8 | 50 | .6 | 27 | .9 | 13 | 2.5 | 3 | 1.4 |
| After Supreme Court action | 14 | .1 | 11 | .1 | 0 | .0 | 3 | .6 | 0 | .0 |
- 1 See table 1, footnote 1, for definitions of types of cases.
- 2 Includes cases in which the parties entered into a stipulation providing for Board order and consent decree in the circuit court
- 3 Includes 42 cases in which a notice of hearing issued pursuant to sec 10(k) of the act. Of these 42 cases, 29 were closed after notice, 1 was closed after hearing, and 12 were closed after Board decision.
- 4 Includes either denial of writ of certiorari or granting of writ and issuance of opinion.
41 of 41 figures sit in a row or column sum that works out.
Reader’s notes
p. 178. SCOPE: The image is not a single-table crop — it is the full printed page 167 (Appendix A) carrying three tables: the tail of "Table 6.—Geographic Distribution of Unfair Labor Practice and Representation Cases Received, Fiscal Year 1959—Continued" (rows Outlying areas, Alaska, Hawaii, Puerto Rico, Canada, Virgin Islands), then "Table 7.—Disposition of Unfair Labor Practice Cases Closed, Fiscal Year 1959", then "Table 8.—Disposition of Representation Cases Closed, Fiscal Year 1959". Following the crop's "t2" designation I transcribed the second table on the page, Table 7, with its own four footnotes. Tables 6 and 8 (and their footnotes) are NOT included above. DECIMAL POINTS: This is a coarse 1-bit scan in which many decimal points in the percent columns have dropped out, so cells print as e.g. "100 0", "93 2", "2 9", "1 6", or a bare "7"/"6"/"5"/"3"/"1". I restored the decimal point in every percent cell, exactly as for the comma-space artifact ("11, 465" -> "11,465"). Cells where the point is clearly visible on the image are: All C 100.0 and .4 and .3; CB .8 and .2 and .0; CC 77.3 and 2.5; CD 100.0, 93.4, 4.2, .0, .5, .5, 1.4, .0. All other percent cells had the point restored. Each column's number cells sum exactly to the printed total (All C 11,465; CA 7,825; CB 2,902; CC 525; CD 213), which supports the column assignment. DOUBTFUL CELL: Row "After Board order adopting intermediate report in absence of exceptions", column "CC cases^1 / Percent of cases closed" is printed as a bare "5", read as ".5"; 3 of 525 would round to .6, so this may be a misprint in the source. Transcribed as printed. The same row's CD percent cell has a stray ink mark to the left of ".0" in the margin of the column; I read the value as ".0". FOOTNOTE MARKER: In the "CD cases^1 / Number of cases" column of row "Before issuance of complaint" the superscript 3 is printed BEFORE the figure ("3 199"); per instructions it is written as "199^3". The marker is confirmed by footnote 3 and by the column summing to 213. Footnote 2's text ends without a period as printed. Headings "CA cases", "CB cases", "CC cases", "CD cases" each carry superscript 1; "All C cases" carries no marker.
Source image
Source data: U.S. NLRB Annual Reports (public domain). Reconstruction by NLRB Stats Archive. Read by claude-opus-5 (effort max, prompt extract_v1) from the 300-dpi scan; stitched by page. Updated October 2026.