NLRB Stats Archive › Annual Reports › FY1959 › Disposition of Representation Cases Closed, Fiscal Year 1959
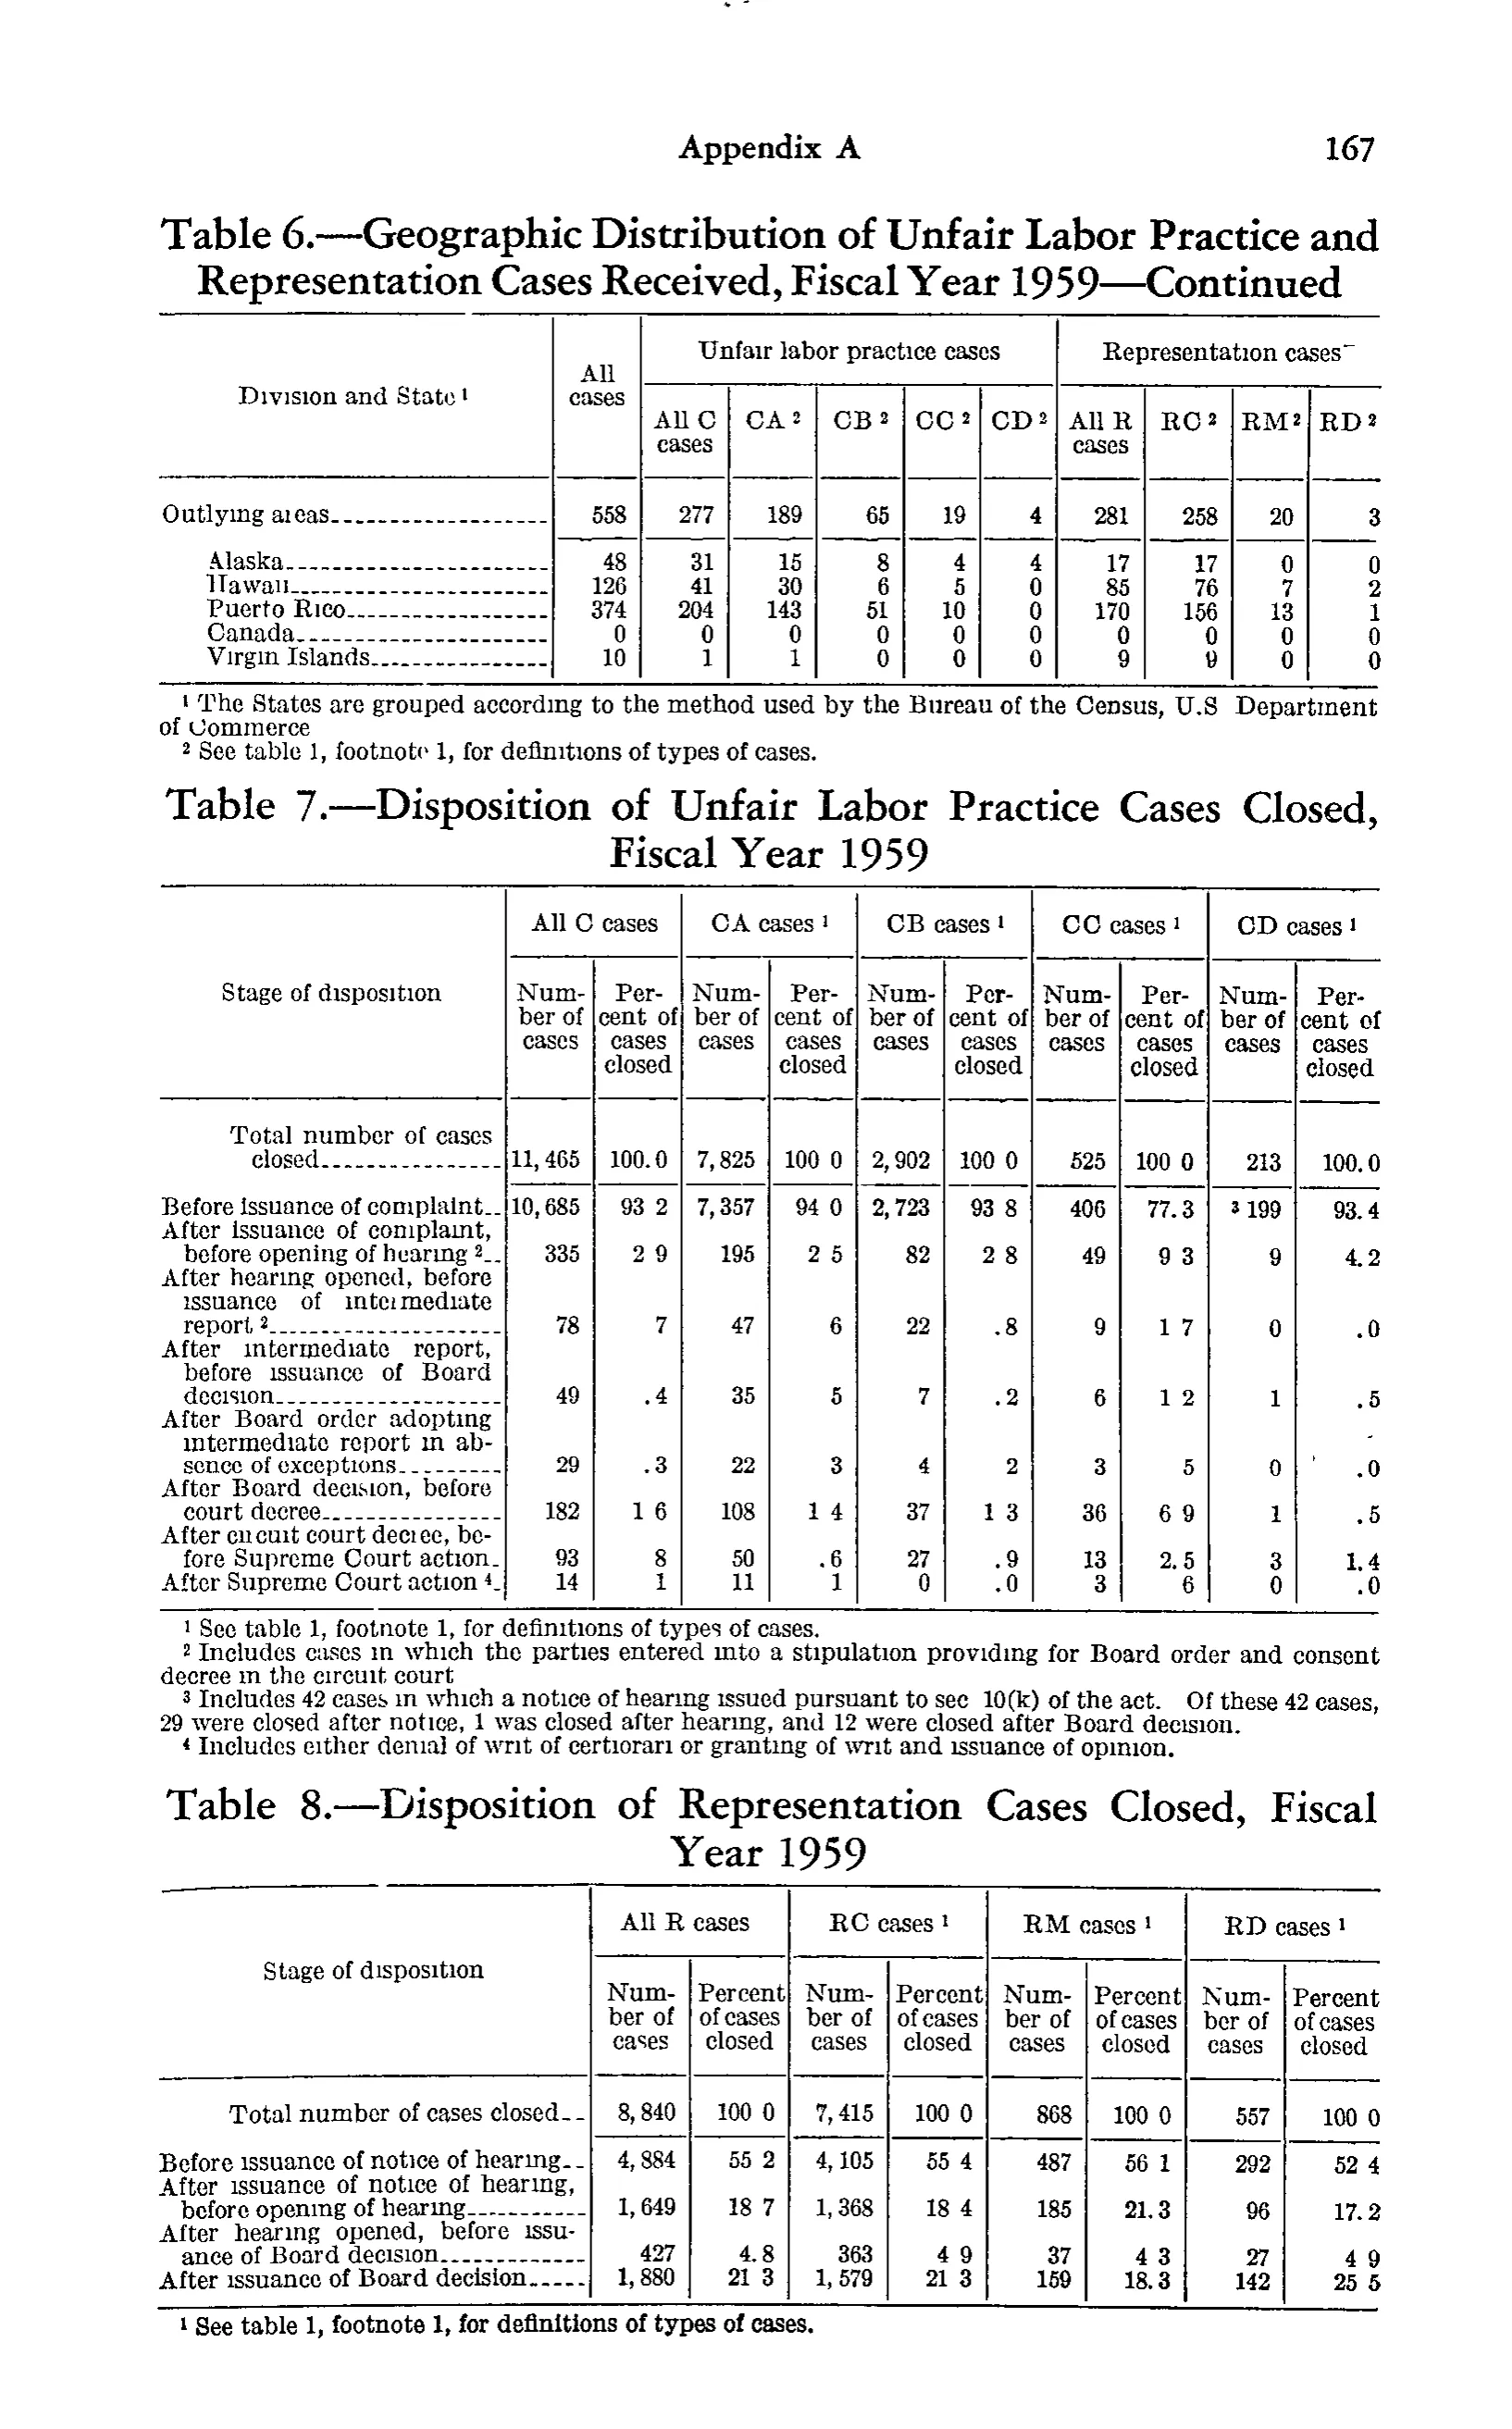
Disposition of Representation Cases Closed, Fiscal Year 1959
| Division and State | All cases | Unfair labor practice cases | Representation cases | |||||||
|---|---|---|---|---|---|---|---|---|---|---|
| Division and State | All cases | All C cases | CA | CB | CC | CD | All R cases | RC | RM | RD |
| Outlying areas | 558 | 277 | 189 | 65 | 19 | 4 | 281 | 258 | 20 | 3 |
| Alaska | 48 | 31 | 15 | 8 | 4 | 4 | 17 | 17 | 0 | 0 |
| Hawaii | 126 | 41 | 30 | 6 | 5 | 0 | 85 | 76 | 7 | 2 |
| Puerto Rico | 374 | 204 | 143 | 51 | 10 | 0 | 170 | 156 | 13 | 1 |
| Canada | 0 | 0 | 0 | 0 | 0 | 0 | 0 | 0 | 0 | 0 |
| Virgin Islands | 10 | 1 | 1 | 0 | 0 | 0 | 9 | 9 | 0 | 0 |
| Total number of cases closed | 11,465 | 100.0 | 7,825 | 100.0 | 2,902 | 100.0 | 525 | 100.0 | 213 | 100.0 |
| Before issuance of complaint | 10,685 | 93.2 | 7,357 | 94.0 | 2,723 | 93.8 | 406 | 77.3 | 199 | 93.4 |
| After issuance of complaint, before opening of hearing | 335 | 2.9 | 195 | 2.5 | 82 | 2.8 | 49 | 9.3 | 9 | 4.2 |
| After hearing opened, before issuance of intermediate report | 78 | .7 | 47 | .6 | 22 | .8 | 9 | 1.7 | 0 | .0 |
| After intermediate report, before issuance of Board decision | 49 | .4 | 35 | .5 | 7 | .2 | 6 | 1.2 | 1 | .5 |
| After Board order adopting intermediate report in absence of exceptions | 29 | .3 | 22 | .3 | 4 | .2 | 3 | .5 | 0 | .0 |
| After Board decision, before court decree | 182 | 1.6 | 108 | 1.4 | 37 | 1.3 | 36 | 6.9 | 1 | .5 |
| After circuit court decree, before Supreme Court action | 93 | .8 | 50 | .6 | 27 | .9 | 13 | 2.5 | 3 | 1.4 |
| After Supreme Court action | 14 | .1 | 11 | .1 | 0 | .0 | 3 | .6 | 0 | .0 |
| Total number of cases closed | 8,840 | 100.0 | 7,415 | 100.0 | 868 | 100.0 | 557 | 100.0 | ||
| Before issuance of notice of hearing | 4,884 | 55.2 | 4,105 | 55.4 | 487 | 56.1 | 292 | 52.4 | ||
| After issuance of notice of hearing, before opening of hearing | 1,649 | 18.7 | 1,368 | 18.4 | 185 | 21.3 | 96 | 17.2 | ||
| After hearing opened, before issuance of Board decision | 427 | 4.8 | 363 | 4.9 | 37 | 4.3 | 27 | 4.9 | ||
| After issuance of Board decision | 1,880 | 21.3 | 1,579 | 21.3 | 159 | 18.3 | 142 | 25.5 | ||
- 1 The States are grouped according to the method used by the Bureau of the Census, U.S. Department of Commerce
- 2 See table 1, footnote 1, for definitions of types of cases.
- 1 See table 1, footnote 1, for definitions of types of cases.
- 2 Includes cases in which the parties entered into a stipulation providing for Board order and consent decree in the circuit court
- 3 Includes 42 cases in which a notice of hearing issued pursuant to sec. 10(k) of the act. Of these 42 cases, 29 were closed after notice, 1 was closed after hearing, and 12 were closed after Board decision.
- 4 Includes either denial of writ of certiorari or granting of writ and issuance of opinion.
102 of 102 figures sit in a row or column sum that works out.
Reader’s notes
p. 178. CROP CONTENT: the image is a whole report page (printed page 167, running head "Appendix A") and carries THREE separate tables, not one: (a) the tail of Table 6, "Geographic Distribution of Unfair Labor Practice and Representation Cases Received, Fiscal Year 1959—Continued" (continued from the previous page; only the "Outlying areas" block is on this page); (b) all of Table 7, "Disposition of Unfair Labor Practice Cases Closed, Fiscal Year 1959"; (c) all of Table 8, "Disposition of Representation Cases Closed, Fiscal Year 1959". Following the rule for stacking panels, I transcribed them one under the other in a single 11-column grid in printed order — Table 6 rows 1-6, Table 7 rows 7-15, Table 8 rows 16-20 — and gave the heading rows once, from Table 6 (the topmost printed heading block). HEADINGS OF THE OTHER TWO TABLES (not reproducible in a single header block, recorded here instead). Table 7, 11 columns matching this grid: stub "Stage of disposition" (spans both levels); then paired spanner headings "All C cases", "CA cases^1", "CB cases^1", "CC cases^1", "CD cases^1", each spanning two columns, over the second-level pair "Number of cases" / "Percent of cases closed". So in this grid columns 1-2 = All C cases, 3-4 = CA cases^1, 5-6 = CB cases^1, 7-8 = CC cases^1, 9-10 = CD cases^1. Table 8 has only 9 printed columns: stub "Stage of disposition" plus "All R cases", "RC cases^1", "RM cases^1", "RD cases^1", each over "Number of cases" / "Percent of cases closed"; its values occupy columns 1-8 of this grid (1-2 All R, 3-4 RC, 5-6 RM, 7-8 RD) and columns 9-10 are left empty for rectangularity, not because anything is blank in the print. FOOTNOTES: the list is in printed order and the markers repeat across the three tables — entries 1-2 belong to Table 6, entries 3-6 to Table 7, and Table 8 carries a single footnote identical to entry 3 ("1 See table 1, footnote 1, for definitions of types of cases."), which I did not repeat a third time. DECIMAL POINTS: this scan drops many printed periods, so percentages print as e.g. "100 0", "93 2", "1 6", and bare "7"/"6"/"3" for ".7"/".6"/".3". I restored the decimal point in every percent cell (and in "U.S." and "sec." in the footnotes). The reading is confirmed arithmetically: each percent column of Table 7 and Table 8 sums to exactly 100.0 as transcribed, and every number column sums to its printed total (Table 7 All C 11,465; CA 7,825; CB 2,902; CC 525; CD 213; Table 8 8,840 / 7,415 / 868 / 557). Table 6's rows also cross-foot exactly. OTHER CELL NOTES: in Table 7, "Before issuance of complaint", CD number, the raised 3 is printed BEFORE the figure ("3 199"); transcribed as "199^3" per the marker rule. In the CD percent column beside "After Board order adopting intermediate report in absence of exceptions" there is a small stray dash above the ".0"; I read it as a speck, not a character. The Table 6 spanner "Representation cases" carries a short raised stroke after it in the scan that does not correspond to any footnote under that table; I treated it as a printing artifact and did not transcribe a marker. Row labels were cleaned of scan noise where the intended word is unambiguous ("Outlying areas", "Hawaii").
Source image
Source data: U.S. NLRB Annual Reports (public domain). Reconstruction by NLRB Stats Archive. Read by claude-opus-5 (effort max, prompt extract_v1) from the 300-dpi scan; stitched by page. Updated October 2026.