NLRB Stats Archive › Annual Reports › FY1959 › Disposition of Unfair Labor Practice Cases Closed, Fiscal Year 1959
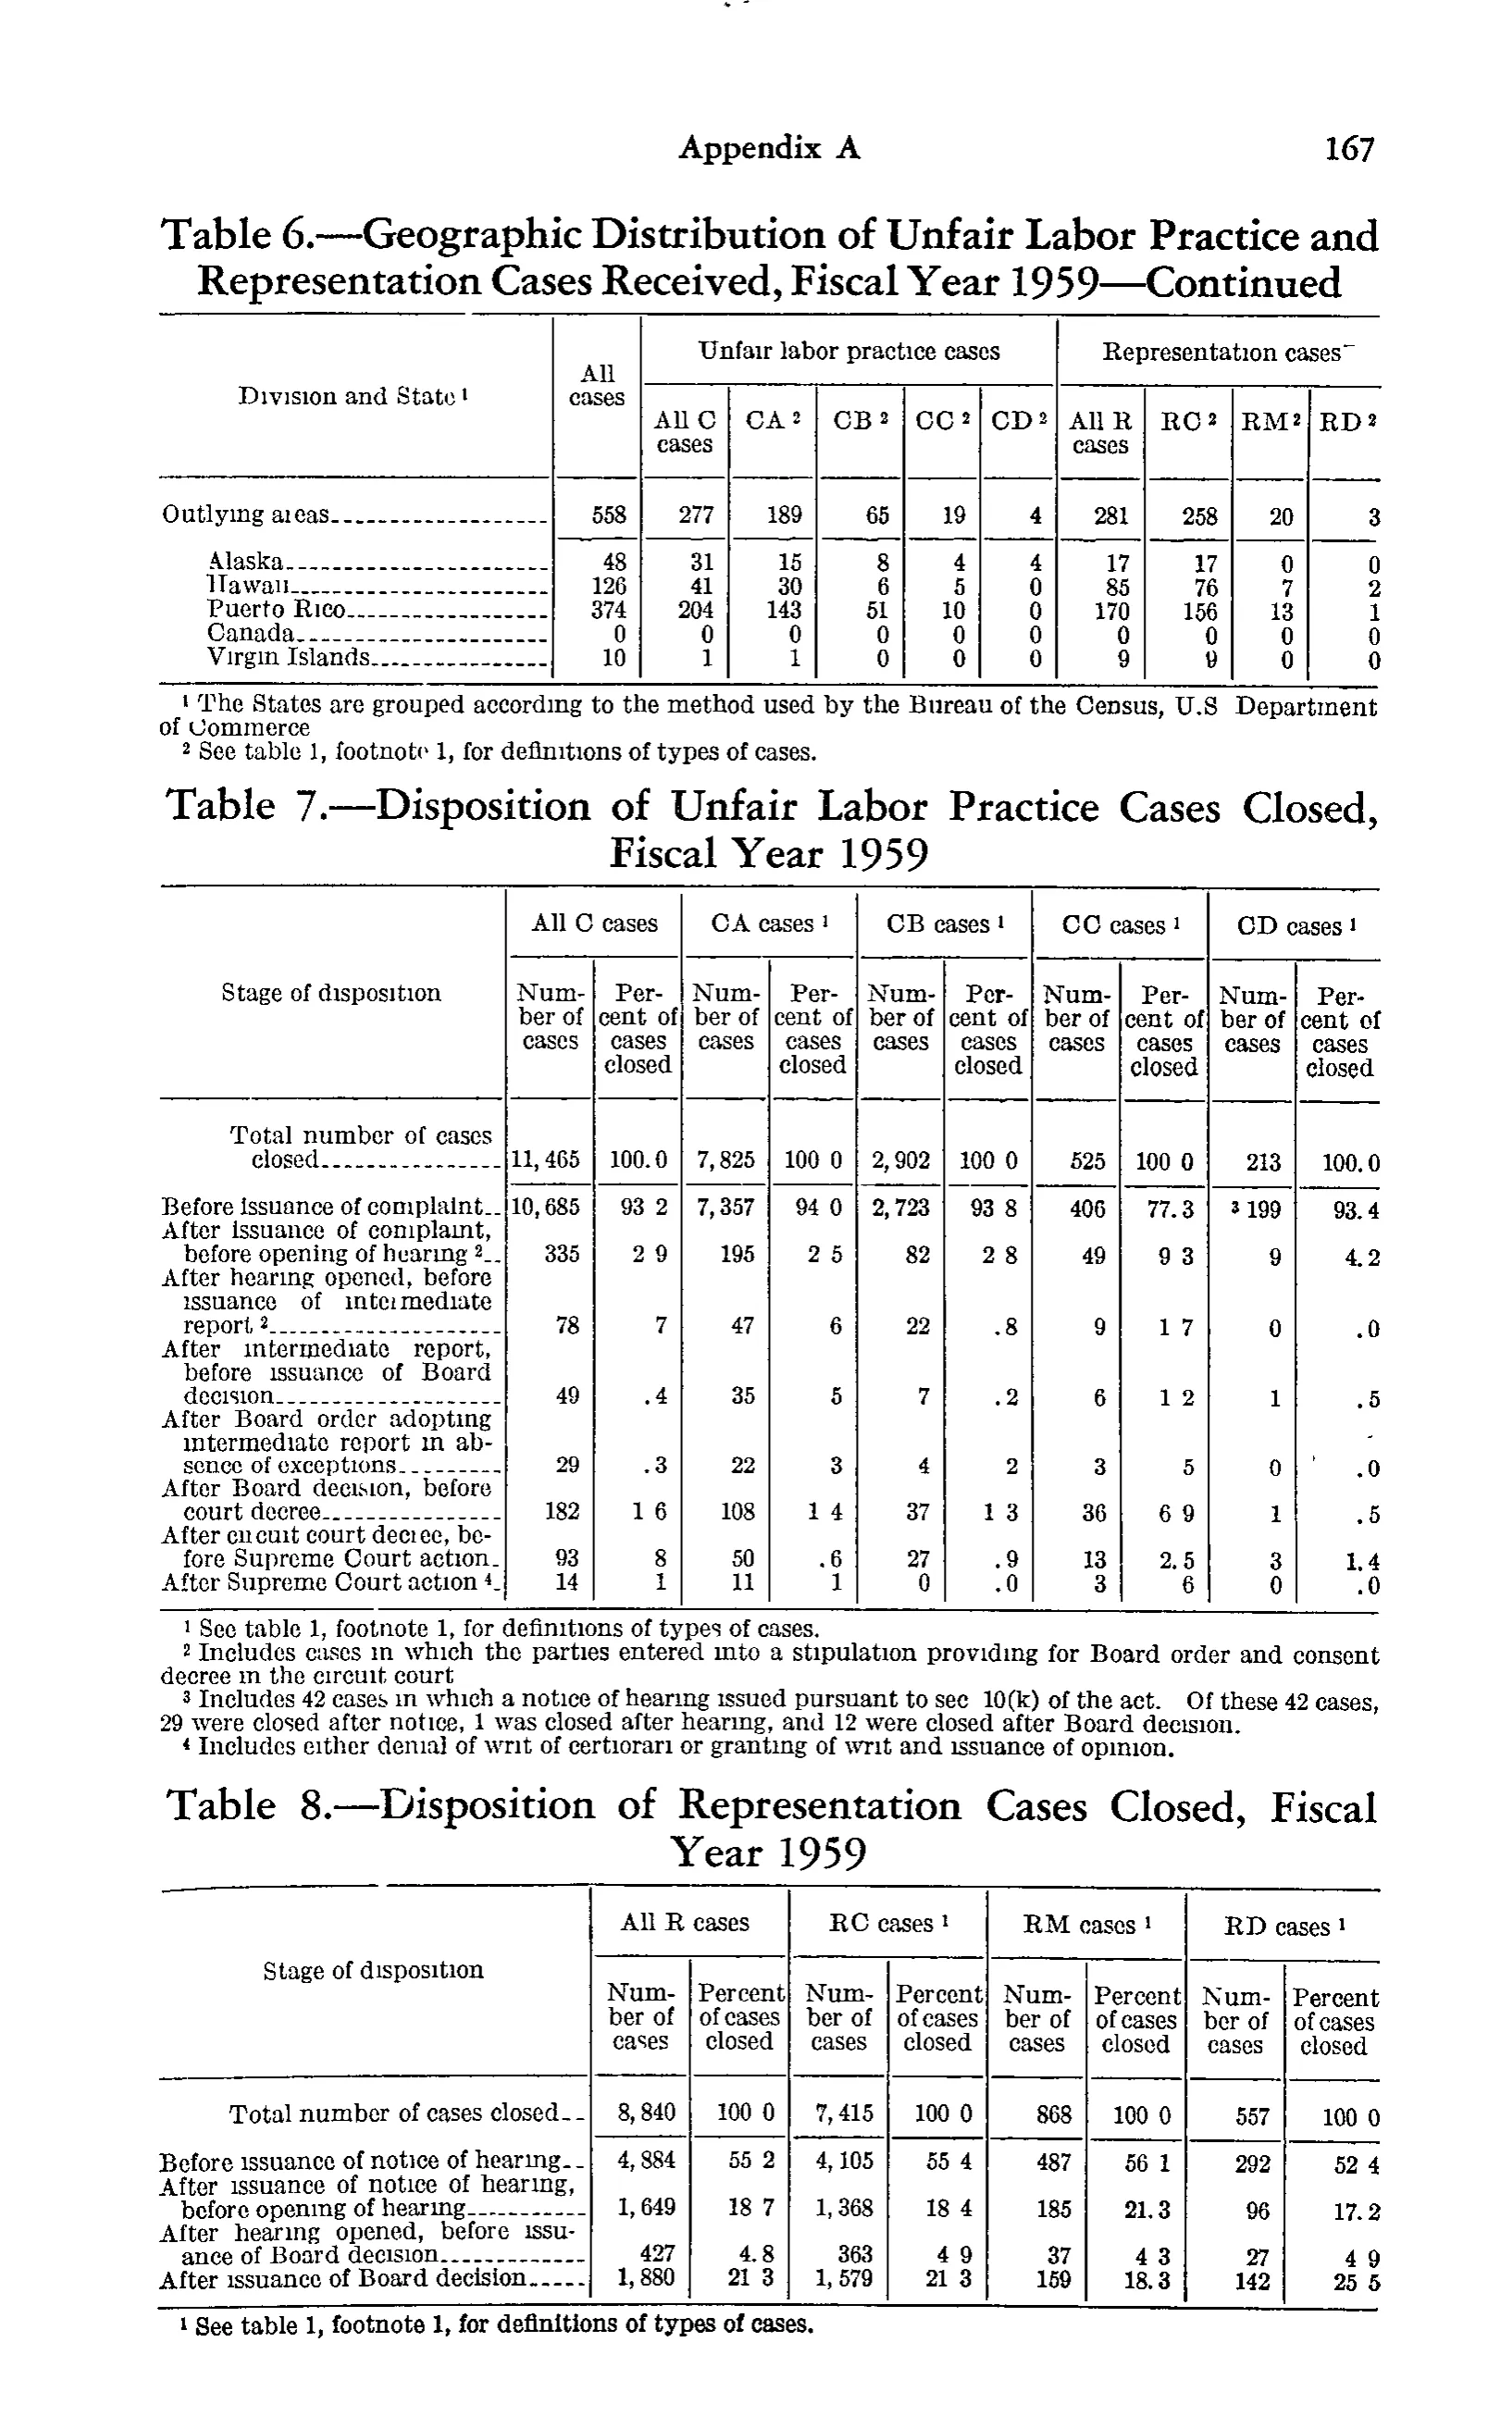
Disposition of Unfair Labor Practice Cases Closed, Fiscal Year 1959
| Division and State | All cases | Unfair labor practice cases | Representation cases | |||||||
|---|---|---|---|---|---|---|---|---|---|---|
| Division and State | All cases | All C cases | CA | CB | CC | CD | All R cases | RC | RM | RD |
| Outlying areas | 558 | 277 | 189 | 65 | 19 | 4 | 281 | 258 | 20 | 3 |
| Alaska | 48 | 31 | 15 | 8 | 4 | 4 | 17 | 17 | 0 | 0 |
| Hawaii | 126 | 41 | 30 | 6 | 5 | 0 | 85 | 76 | 7 | 2 |
| Puerto Rico | 374 | 204 | 143 | 51 | 10 | 0 | 170 | 156 | 13 | 1 |
| Canada | 0 | 0 | 0 | 0 | 0 | 0 | 0 | 0 | 0 | 0 |
| Virgin Islands | 10 | 1 | 1 | 0 | 0 | 0 | 9 | 9 | 0 | 0 |
| Total number of cases closed | 11,465 | 100.0 | 7,825 | 100.0 | 2,902 | 100.0 | 525 | 100.0 | 213 | 100.0 |
| Before issuance of complaint | 10,685 | 93.2 | 7,357 | 94.0 | 2,723 | 93.8 | 406 | 77.3 | 199 | 93.4 |
| After issuance of complaint, before opening of hearing | 335 | 2.9 | 195 | 2.5 | 82 | 2.8 | 49 | 9.3 | 9 | 4.2 |
| After hearing opened, before issuance of intermediate report | 78 | .7 | 47 | .6 | 22 | .8 | 9 | 1.7 | 0 | .0 |
| After intermediate report, before issuance of Board decision | 49 | .4 | 35 | .5 | 7 | .2 | 6 | 1.2 | 1 | .5 |
| After Board order adopting intermediate report in absence of exceptions | 29 | .3 | 22 | .3 | 4 | .2 | 3 | .5 | 0 | .0 |
| After Board decision, before court decree | 182 | 1.6 | 108 | 1.4 | 37 | 1.3 | 36 | 6.9 | 1 | .5 |
| After circuit court decree, before Supreme Court action | 93 | .8 | 50 | .6 | 27 | .9 | 13 | 2.5 | 3 | 1.4 |
| After Supreme Court action | 14 | .1 | 11 | .1 | 0 | .0 | 3 | .6 | 0 | .0 |
| Total number of cases closed | 8,840 | 100.0 | 7,415 | 100.0 | 868 | 100.0 | 557 | 100.0 | ||
| Before issuance of notice of hearing | 4,884 | 55.2 | 4,105 | 55.4 | 487 | 56.1 | 292 | 52.4 | ||
| After issuance of notice of hearing, before opening of hearing | 1,649 | 18.7 | 1,368 | 18.4 | 185 | 21.3 | 96 | 17.2 | ||
| After hearing opened, before issuance of Board decision | 427 | 4.8 | 363 | 4.9 | 37 | 4.3 | 27 | 4.9 | ||
| After issuance of Board decision | 1,880 | 21.3 | 1,579 | 21.3 | 159 | 18.3 | 142 | 25.5 | ||
- 1 The States are grouped according to the method used by the Bureau of the Census, U.S. Department of Commerce
- 2 See table 1, footnote 1, for definitions of types of cases.
- 1 See table 1, footnote 1, for definitions of types of cases.
- 2 Includes cases in which the parties entered into a stipulation providing for Board order and consent decree in the circuit court
- 3 Includes 42 cases in which a notice of hearing issued pursuant to sec. 10(k) of the act. Of these 42 cases, 29 were closed after notice, 1 was closed after hearing, and 12 were closed after Board decision.
- 4 Includes either denial of writ of certiorari or granting of writ and issuance of opinion.
102 of 102 figures sit in a row or column sum that works out.
Reader’s notes
p. 178. CROP CONTENTS: this image is not a single table but a complete printed page (running head "Appendix A", printed page 167) holding three different tables, each with its own caption, column headings and footnote block: (a) "Table 6.—Geographic Distribution of Unfair Labor Practice and Representation Cases Received, Fiscal Year 1959—Continued" (11 columns), (b) "Table 7.—Disposition of Unfair Labor Practice Cases Closed, Fiscal Year 1959" (11 columns), (c) "Table 8.—Disposition of Representation Cases Closed, Fiscal Year 1959" (9 columns). All three bodies are transcribed here, stacked in printed order, in a single 11-column grid; nothing on the page was skipped. Because one rectangular grid cannot carry three different heading blocks, header_rows holds only Table 6's two heading levels, and the other two tables' headings are given below. The three tables should ideally be split into three records. ROW RANGES (1-based): rows 1-6 = Table 6 (continued); rows 7-15 = Table 7; rows 16-20 = Table 8. TABLE 7 COLUMN HEADINGS (apply to rows 7-15): col 0 stub "Stage of disposition"; then five two-column panels, each "Number of cases" then "Percent of cases closed", under the spanning heads "All C cases", "CA cases^1", "CB cases^1", "CC cases^1", "CD cases^1" (cols 1-2, 3-4, 5-6, 7-8, 9-10). TABLE 8 COLUMN HEADINGS (apply to rows 16-20): col 0 stub "Stage of disposition"; then four two-column panels, each "Number of cases" then "Percent of cases closed", under "All R cases", "RC cases^1", "RM cases^1", "RD cases^1" (cols 1-2, 3-4, 5-6, 7-8). Table 8 has only 9 printed columns, so cols 9-10 of rows 16-20 are empty padding, not blank printed cells. FOOTNOTE ATTRIBUTION (markers repeat across the three tables, so they are listed in printed order): footnotes 1 and 2 of the list belong to Table 6; the next four ("1 See table 1, footnote 1...", "2 Includes cases in which the parties entered...", "3 Includes 42 cases...", "4 Includes either denial of writ...") belong to Table 7. Table 8 carries one further footnote, printed as "1 See table 1, footnote 1, for definitions of types of cases." — identical in wording to Table 7's footnote 1, so it is not repeated a third time in the list. DECIMAL POINTS: throughout Tables 7 and 8 the decimal point in the percent columns is printed too lightly to survive the scan, so the page literally reads "100 0", "93 2", "2 9", "1 7", "6 9" etc. These are transcribed with the decimal point restored (100.0, 93.2, 2.9, 1.7, 6.9), by the same convention used for the space after a digit-grouping comma. This is corroborated arithmetically: every percent column of Table 7 and of Table 8 sums to exactly 100.0 as reconstructed, and every number column sums to its printed total (Table 7: 11,465 / 7,825 / 2,902 / 525 / 213; Table 8: 8,840 / 7,415 / 868 / 557). Table 6 also reconciles exactly in both directions. Values printed with no integer part are kept as printed (".7", ".4", ".0"). OTHER OBSERVATIONS: (1) In row 8 (Table 7, "Before issuance of complaint"), the CD-cases number is printed with the raised footnote marker 3 ahead of the figure; it is transcribed as "199^3". (2) In Table 6's heading, "Representation cases" is followed by a small raised dash-like mark; no footnote with that marker is printed, so it is read as a scan artifact rather than a reference and is not transcribed. (3) The "9" in the Virgin Islands RC cell (row 6, col 8) is broken in the scan but is unambiguous given 1 + 9 = 10 and the RM/RD zeros. (4) The periods in "U.S. Department" (Table 6 footnote 1) are faint; the terminal periods of Table 6 footnote 1 and Table 7 footnote 2 appear to be absent on the page. (5) Stray ink specks sit above the CD percent cells in rows 12 and 14; they are not transcribed. (6) Row labels of Table 6's states are printed indented under "Outlying areas"; the indentation is not reproduced in the label text.
Source image
Source data: U.S. NLRB Annual Reports (public domain). Reconstruction by NLRB Stats Archive. Read by claude-opus-5 (effort max, prompt extract_v1) from the 300-dpi scan; stitched by page. Updated October 2026.