NLRB Stats Archive › Annual Reports › FY1959 › Geographic Distribution of Unfair Labor Practice and Representation Cases Received, Fiscal Year 1959
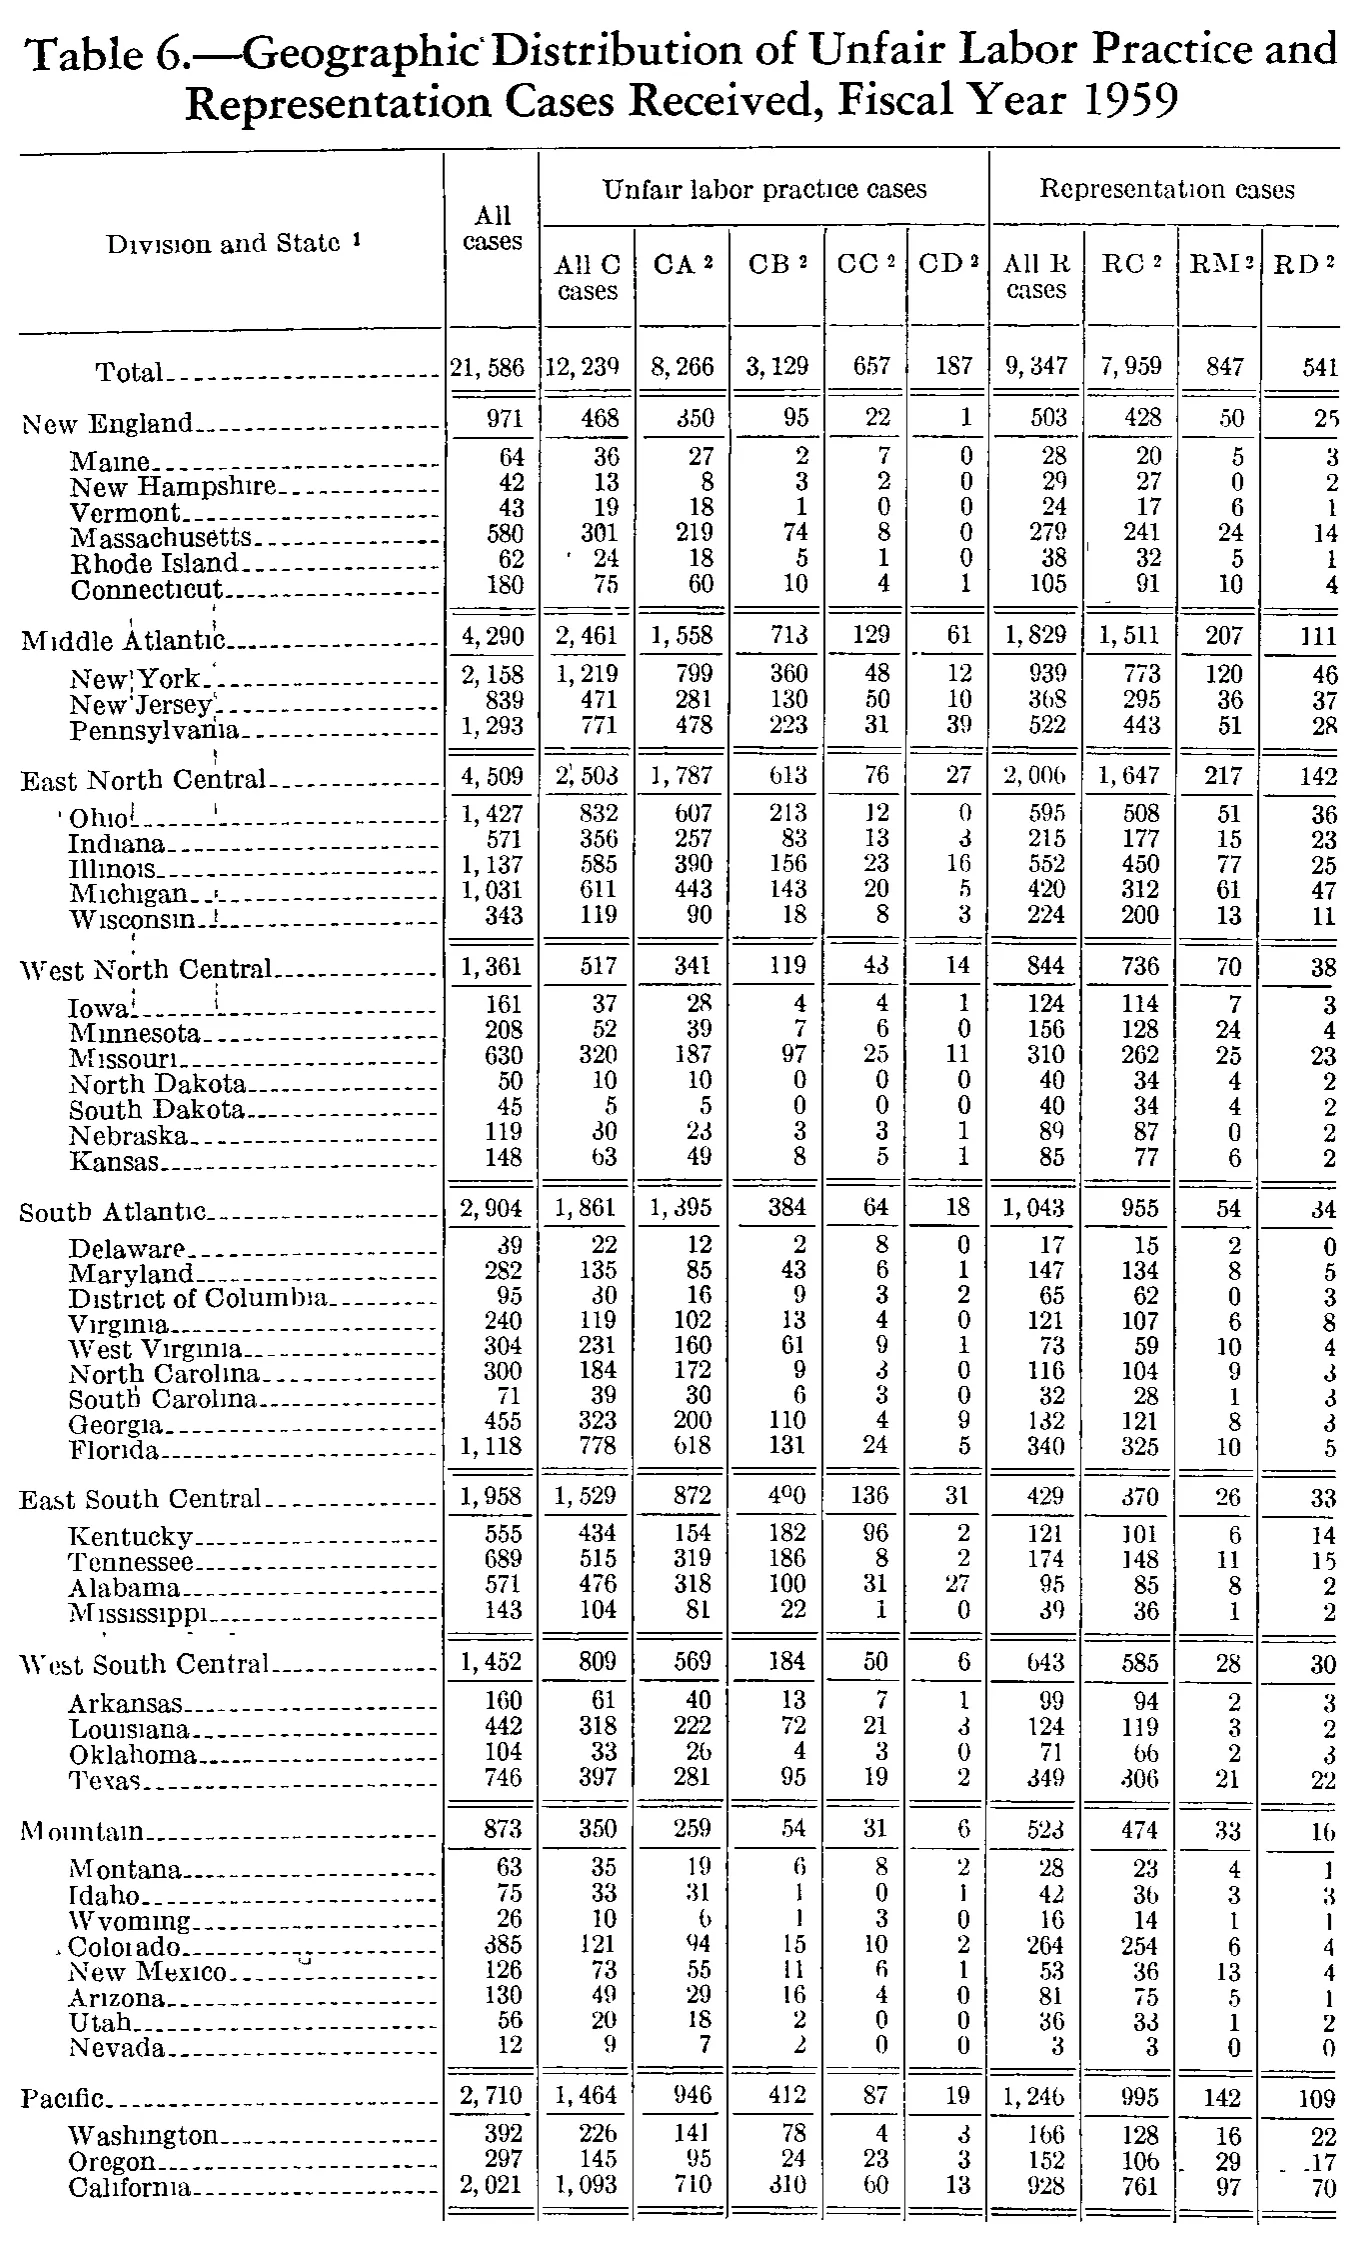
Geographic Distribution of Unfair Labor Practice and Representation Cases Received, Fiscal Year 1959
Stitched from pp. 177–178.
| Division and State | All cases | Unfair labor practice cases | Representation cases | |||||||
|---|---|---|---|---|---|---|---|---|---|---|
| Division and State | All cases | All C cases | CA | CB | CC | CD | All R cases | RC | RM | RD |
| Total | 21,586 | 12,239 | 8,266 | 3,129 | 657 | 187 | 9,347 | 7,959 | 847 | 541 |
| New England | 971 | 468 | 350 | 95 | 22 | 1 | 503 | 428 | 50 | 25 |
| Maine | 64 | 36 | 27 | 2 | 7 | 0 | 28 | 20 | 5 | 3 |
| New Hampshire | 42 | 13 | 8 | 3 | 2 | 0 | 29 | 27 | 0 | 2 |
| Vermont | 43 | 19 | 18 | 1 | 0 | 0 | 24 | 17 | 6 | 1 |
| Massachusetts | 580 | 301 | 219 | 74 | 8 | 0 | 279 | 241 | 24 | 14 |
| Rhode Island | 62 | 24 | 18 | 5 | 1 | 0 | 38 | 32 | 5 | 1 |
| Connecticut | 180 | 75 | 60 | 10 | 4 | 1 | 105 | 91 | 10 | 4 |
| Middle Atlantic | 4,290 | 2,461 | 1,558 | 713 | 129 | 61 | 1,829 | 1,511 | 207 | 111 |
| New York | 2,158 | 1,219 | 799 | 360 | 48 | 12 | 939 | 773 | 120 | 46 |
| New Jersey | 839 | 471 | 281 | 130 | 50 | 10 | 368 | 295 | 36 | 37 |
| Pennsylvania | 1,293 | 771 | 478 | 223 | 31 | 39 | 522 | 443 | 51 | 28 |
| East North Central | 4,509 | 2,503 | 1,787 | 613 | 76 | 27 | 2,006 | 1,647 | 217 | 142 |
| Ohio | 1,427 | 832 | 607 | 213 | 12 | 0 | 595 | 508 | 51 | 36 |
| Indiana | 571 | 356 | 257 | 83 | 13 | 3 | 215 | 177 | 15 | 23 |
| Illinois | 1,137 | 585 | 390 | 156 | 23 | 16 | 552 | 450 | 77 | 25 |
| Michigan | 1,031 | 611 | 443 | 143 | 20 | 5 | 420 | 312 | 61 | 47 |
| Wisconsin | 343 | 119 | 90 | 18 | 8 | 3 | 224 | 200 | 13 | 11 |
| West North Central | 1,361 | 517 | 341 | 119 | 43 | 14 | 844 | 736 | 70 | 38 |
| Iowa | 161 | 37 | 28 | 4 | 4 | 1 | 124 | 114 | 7 | 3 |
| Minnesota | 208 | 52 | 39 | 7 | 6 | 0 | 156 | 128 | 24 | 4 |
| Missouri | 630 | 320 | 187 | 97 | 25 | 11 | 310 | 262 | 25 | 23 |
| North Dakota | 50 | 10 | 10 | 0 | 0 | 0 | 40 | 34 | 4 | 2 |
| South Dakota | 45 | 5 | 5 | 0 | 0 | 0 | 40 | 34 | 4 | 2 |
| Nebraska | 119 | 30 | 23 | 3 | 3 | 1 | 89 | 87 | 0 | 2 |
| Kansas | 148 | 63 | 49 | 8 | 5 | 1 | 85 | 77 | 6 | 2 |
| South Atlantic | 2,904 | 1,861 | 1,395 | 384 | 64 | 18 | 1,043 | 955 | 54 | 34 |
| Delaware | 39 | 22 | 12 | 2 | 8 | 0 | 17 | 15 | 2 | 0 |
| Maryland | 282 | 135 | 85 | 43 | 6 | 1 | 147 | 134 | 8 | 5 |
| District of Columbia | 95 | 30 | 16 | 9 | 3 | 2 | 65 | 62 | 0 | 3 |
| Virginia | 240 | 119 | 102 | 13 | 4 | 0 | 121 | 107 | 6 | 8 |
| West Virginia | 304 | 231 | 160 | 61 | 9 | 1 | 73 | 59 | 10 | 4 |
| North Carolina | 300 | 184 | 172 | 9 | 3 | 0 | 116 | 104 | 9 | 3 |
| South Carolina | 71 | 39 | 30 | 6 | 3 | 0 | 32 | 28 | 1 | 3 |
| Georgia | 455 | 323 | 200 | 110 | 4 | 9 | 132 | 121 | 8 | 3 |
| Florida | 1,118 | 778 | 618 | 131 | 24 | 5 | 340 | 325 | 10 | 5 |
| East South Central | 1,958 | 1,529 | 872 | 490 | 136 | 31 | 429 | 370 | 26 | 33 |
| Kentucky | 555 | 434 | 154 | 182 | 96 | 2 | 121 | 101 | 6 | 14 |
| Tennessee | 689 | 515 | 319 | 186 | 8 | 2 | 174 | 148 | 11 | 15 |
| Alabama | 571 | 476 | 318 | 100 | 31 | 27 | 95 | 85 | 8 | 2 |
| Mississippi | 143 | 104 | 81 | 22 | 1 | 0 | 39 | 36 | 1 | 2 |
| West South Central | 1,452 | 809 | 569 | 184 | 50 | 6 | 643 | 585 | 28 | 30 |
| Arkansas | 160 | 61 | 40 | 13 | 7 | 1 | 99 | 94 | 2 | 3 |
| Louisiana | 442 | 318 | 222 | 72 | 21 | 3 | 124 | 119 | 3 | 2 |
| Oklahoma | 104 | 33 | 26 | 4 | 3 | 0 | 71 | 66 | 2 | 3 |
| Texas | 746 | 397 | 281 | 95 | 19 | 2 | 349 | 306 | 21 | 22 |
| Mountain | 873 | 350 | 259 | 54 | 31 | 6 | 523 | 474 | 33 | 16 |
| Montana | 63 | 35 | 19 | 6 | 8 | 2 | 28 | 23 | 4 | 1 |
| Idaho | 75 | 33 | 31 | 1 | 0 | 1 | 42 | 36 | 3 | 3 |
| Wyoming | 26 | 10 | 6 | 1 | 3 | 0 | 16 | 14 | 1 | 1 |
| Colorado | 385 | 121 | 94 | 15 | 10 | 2 | 264 | 254 | 6 | 4 |
| New Mexico | 126 | 73 | 55 | 11 | 6 | 1 | 53 | 36 | 13 | 4 |
| Arizona | 130 | 49 | 29 | 16 | 4 | 0 | 81 | 75 | 5 | 1 |
| Utah | 56 | 20 | 18 | 2 | 0 | 0 | 36 | 33 | 1 | 2 |
| Nevada | 12 | 9 | 7 | 2 | 0 | 0 | 3 | 3 | 0 | 0 |
| Pacific | 2,710 | 1,464 | 946 | 412 | 87 | 19 | 1,246 | 995 | 142 | 109 |
| Washington | 392 | 226 | 141 | 78 | 4 | 3 | 166 | 128 | 16 | 22 |
| Oregon | 297 | 145 | 95 | 24 | 23 | 3 | 152 | 106 | 29 | 17 |
| California | 2,021 | 1,093 | 710 | 310 | 60 | 13 | 928 | 761 | 97 | 70 |
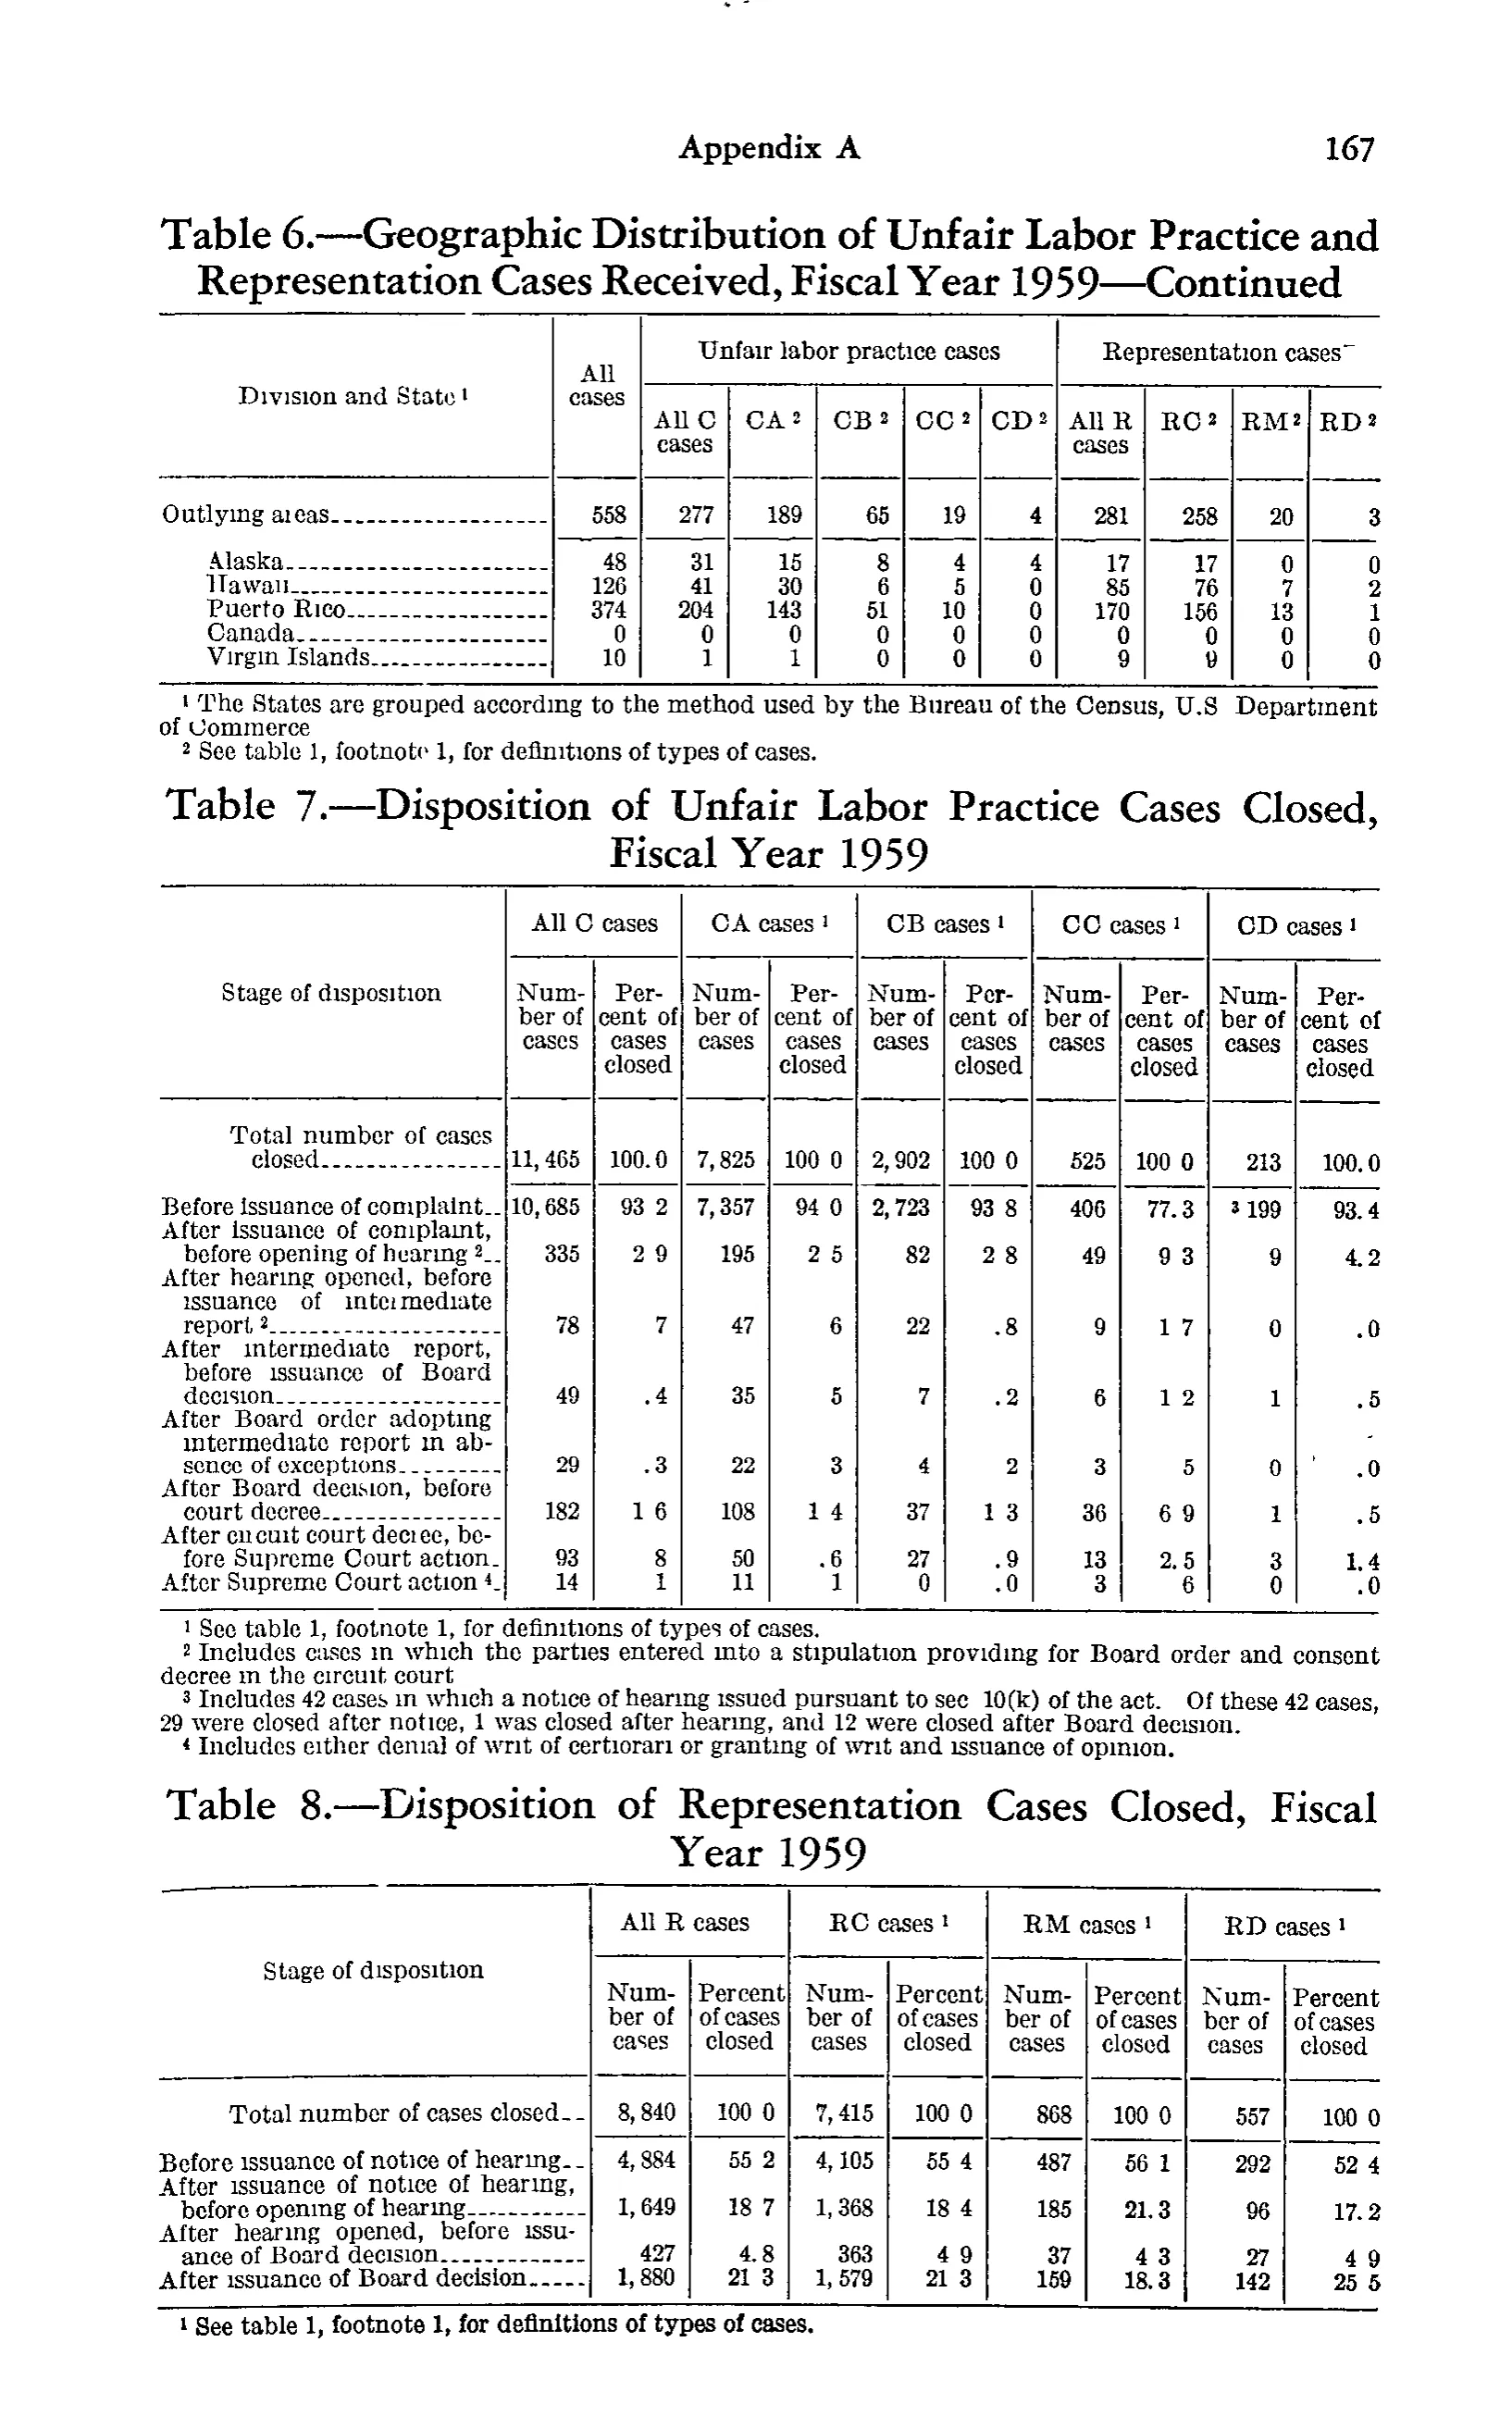
| Outlying areas | 558 | 277 | 189 | 65 | 19 | 4 | 281 | 258 | 20 | 3 |
| Alaska | 48 | 31 | 15 | 8 | 4 | 4 | 17 | 17 | 0 | 0 |
| Hawaii | 126 | 41 | 30 | 6 | 5 | 0 | 85 | 76 | 7 | 2 |
| Puerto Rico | 374 | 204 | 143 | 51 | 10 | 0 | 170 | 156 | 13 | 1 |
| Canada | 0 | 0 | 0 | 0 | 0 | 0 | 0 | 0 | 0 | 0 |
| Virgin Islands | 10 | 1 | 1 | 0 | 0 | 0 | 9 | 9 | 0 | 0 |
- 1 The States are grouped according to the method used by the Bureau of the Census, U.S Department of Commerce
- 2 See table 1, footnote 1, for definitions of types of cases.
598 of 598 figures sit in a row or column sum that works out.
Reader’s notes
p. 177. The table has 11 columns: the stub, "All cases", five unfair-labor-practice columns (All C cases, CA, CB, CC, CD) and four representation columns (All R cases, RC, RM, RD). Crop coverage: the body ends at California (Pacific division) under a double rule, and no footnote texts appear on this image, so the texts for markers 1 (on "Division and State") and 2 (on CA/CB/CC/CD/RC/RM/RD) are not available here. The division subtotals as printed do not reach the printed Total: the nine divisions sum to 21,028 in "All cases" versus the printed Total of 21,586 (All C cases: 11,962 vs 12,239; All R cases: 9,066 vs 9,347). This gap is consistent with further rows (non-contiguous States/Territories such as Alaska, Hawaii and Puerto Rico) lying outside the crop or on a following page. The printed Total row is itself internally consistent (8,266+3,129+657+187 = 12,239; 7,959+847+541 = 9,347; 12,239+9,347 = 21,586), and every division subtotal checks against its own States. Doubtful cell: East South Central, column CB — the middle digit is broken in the scan and reads as a small raised ring, so the cell could be misread as "400". It is transcribed as 490 because the four States in that column (Kentucky 182, Tennessee 186, Alabama 100, Mississippi 22) sum to 490; no other cell in the table was adjusted. Minor scan artifacts, transcribed as the clean value: a stray ink mark before Rhode Island's "All C cases" 24; an apostrophe-like speck inside East North Central's "All C cases" 2,503; stray leader dots running into Oregon's RD value 17; stray marks in several row labels (New York, New Jersey, Ohio, Wisconsin, Iowa, Colorado).
p. 178. Transcribed table: "Table 6.—Geographic Distribution of Unfair Labor Practice and Representation Cases Received, Fiscal Year 1959—Continued", the continuation panel printed at the top of page 167 (Appendix A). The supplied crop is the full printed page and also contains two further, separate tables below it — "Table 7.—Disposition of Unfair Labor Practice Cases Closed, Fiscal Year 1959" and "Table 8.—Disposition of Representation Cases Closed, Fiscal Year 1959" — which have different column structures (11 and 9 columns respectively) and are not included in this grid; they would need their own transcriptions. Column count: 11 (stub + "All cases" + 5 unfair-labor-practice columns + 4 representation columns). "All cases" and the stub heading "Division and State^1" are tall single headings spanning both heading levels and are repeated in both. The spanner "Representation cases" is followed by a short raised horizontal mark in the scan; it does not match any footnote printed under this table (only markers 1 and 2 are used) and appears to be a scanning/typesetting artifact rather than a footnote marker, so it is omitted from the heading. The table being a continuation, the body carries only the "Outlying areas" group; the earlier divisions and States appear on the preceding page. All printed figures are internally consistent: each column of the five detail rows sums to the "Outlying areas" line, and in every row "All cases" equals "All C cases" plus "All R cases". In footnote 1 "U.S" is printed without a closing period and the sentence ends without a period; both are reproduced as printed. The "9" values in the Virgin Islands row ("All R cases" and "RC^2") are slightly broken in the scan but legible as 9, and they are confirmed by the column totals 281 and 258.
Source image
Source data: U.S. NLRB Annual Reports (public domain). Reconstruction by NLRB Stats Archive. Read by claude-opus-5 (effort max, prompt extract_v1) from the 300-dpi scan; stitched by page. Updated October 2026.