NLRB Stats Archive › Annual Reports › FY1958 › Results of union-shop deauthorization polls
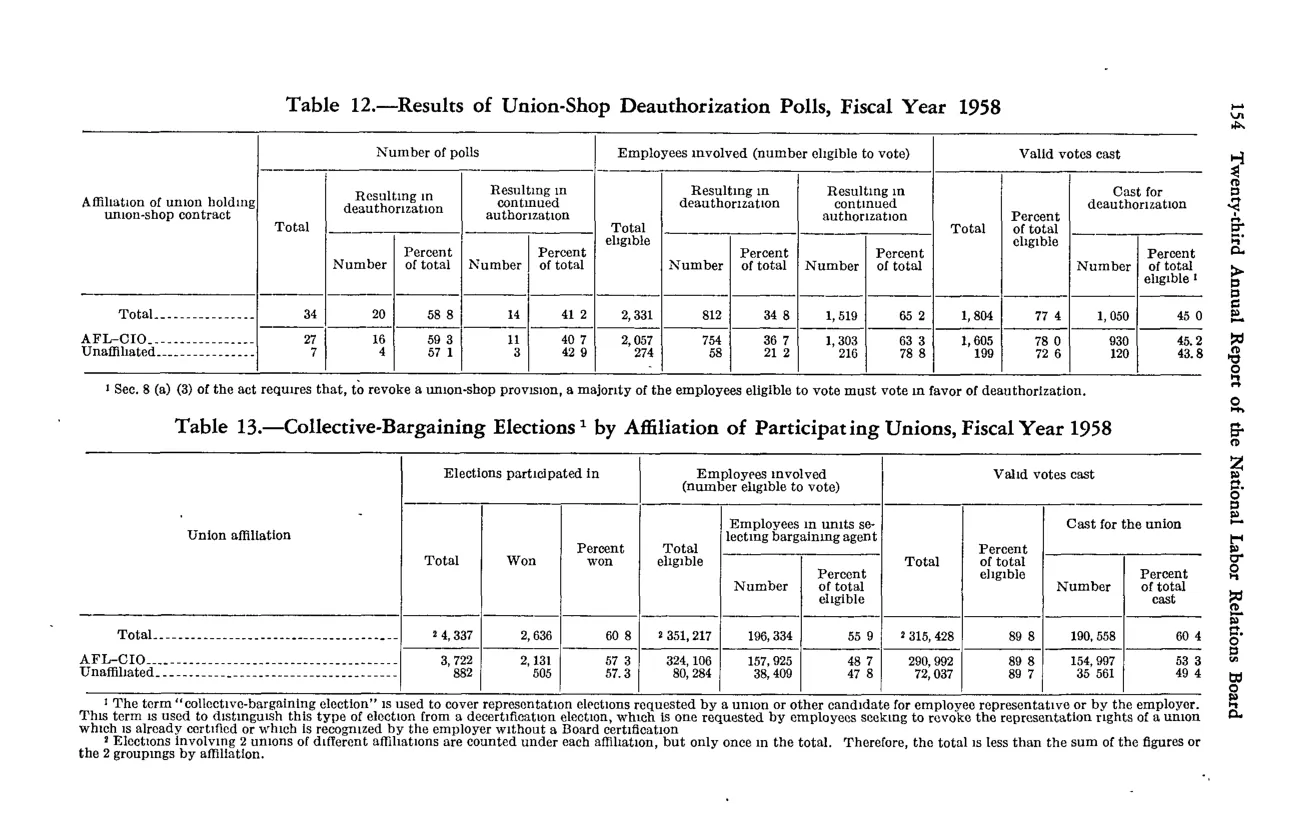
Results of union-shop deauthorization polls
| Affiliation of union holding union-shop contract | Number of polls — Total | Number of polls — Resulting in deauthorization — Number | Number of polls — Resulting in deauthorization — Percent of total | Number of polls — Resulting in continued authorization — Number | Number of polls — Resulting in continued authorization — Percent of total | Employees involved (number eligible to vote) — Total eligible | Employees involved — Resulting in deauthorization — Number | Employees involved — Resulting in deauthorization — Percent of total | Employees involved — Resulting in continued authorization — Number | Employees involved — Resulting in continued authorization — Percent of total | Valid votes cast — Total | Valid votes cast — Percent of total eligible | Cast for deauthorization — Number | Cast for deauthorization — Percent of total eligible |
|---|---|---|---|---|---|---|---|---|---|---|---|---|---|---|
| Total | 34 | 20 | 58.8 | 14 | 41.2 | 2,331 | 812 | 34.8 | 1,519 | 65.2 | 1,804 | 77.4 | 1,050 | 45 |
| AFL-CIO | 27 | 16 | 59.3 | 11 | 40.7 | 2,057 | 754 | 36.7 | 1,303 | 63.3 | 1,605 | 78 | 930 | 45.2 |
| Unaffiliated | 7 | 4 | 57.1 | 3 | 42.9 | 274 | 58 | 21.2 | 216 | 78.8 | 199 | 72.6 | 120 | 43.8 |
Source image
Source data: U.S. NLRB Annual Reports (public domain). Reconstruction by NLRB Stats Archive. Updated June 2026.