NLRB Stats Archive › Annual Reports › FY1958 › Geographic Distribution of Unfair Labor Practice and Representation Cases Received, Fiscal Year 1958
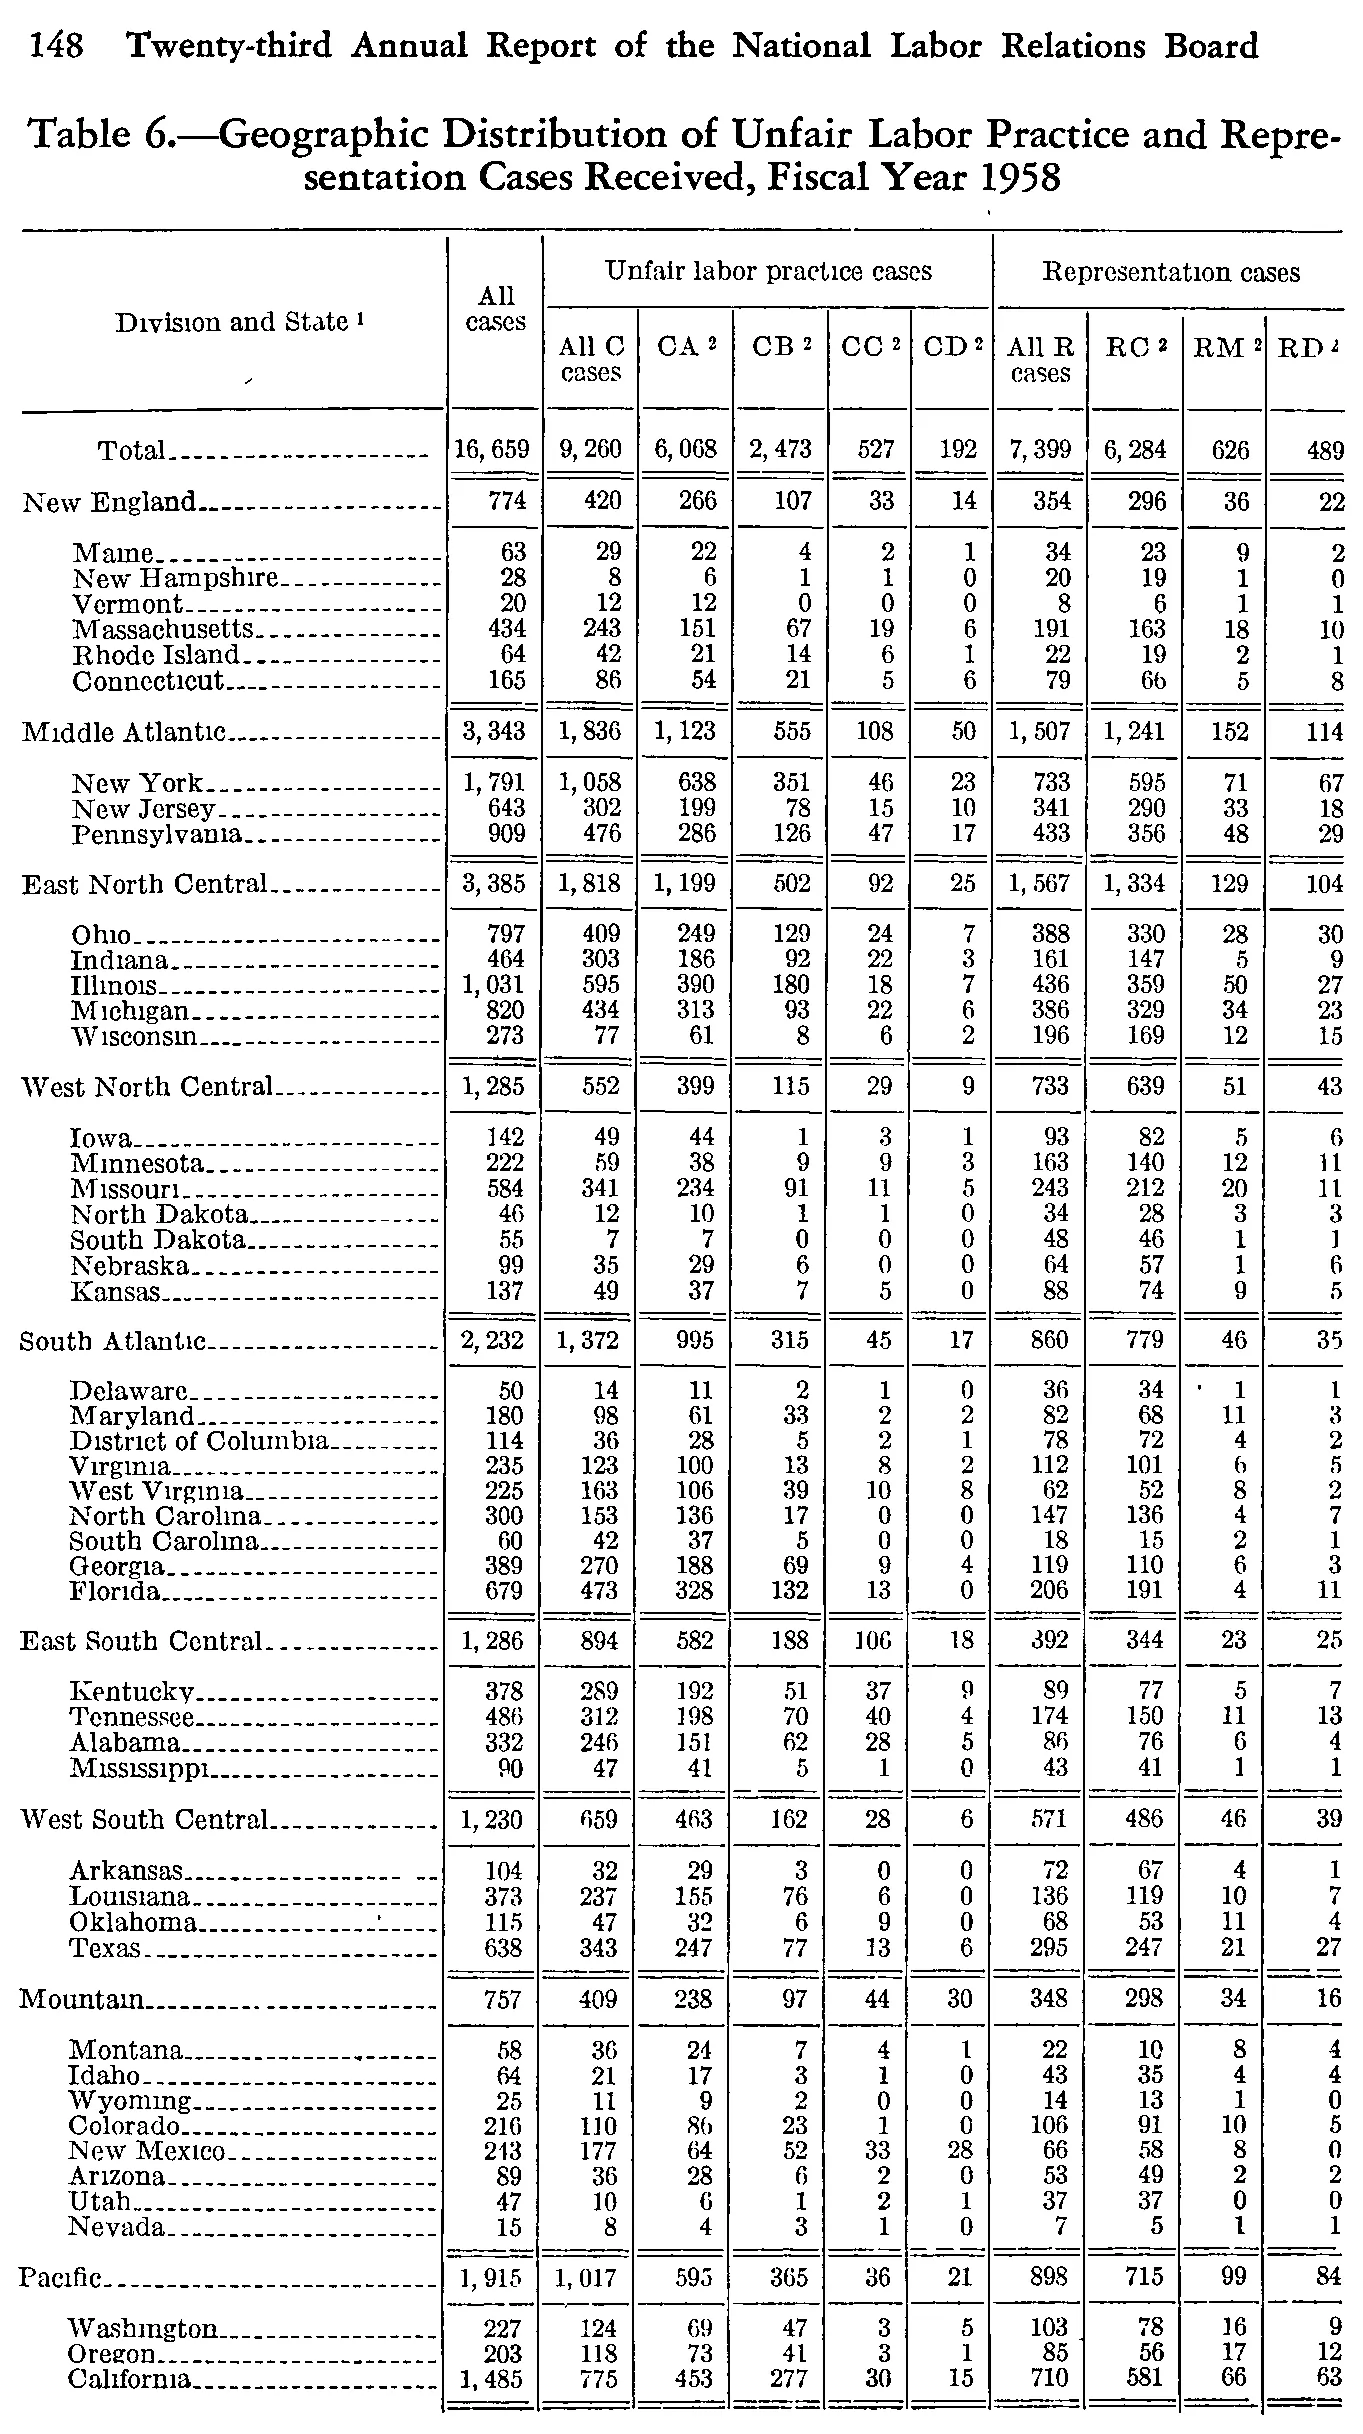
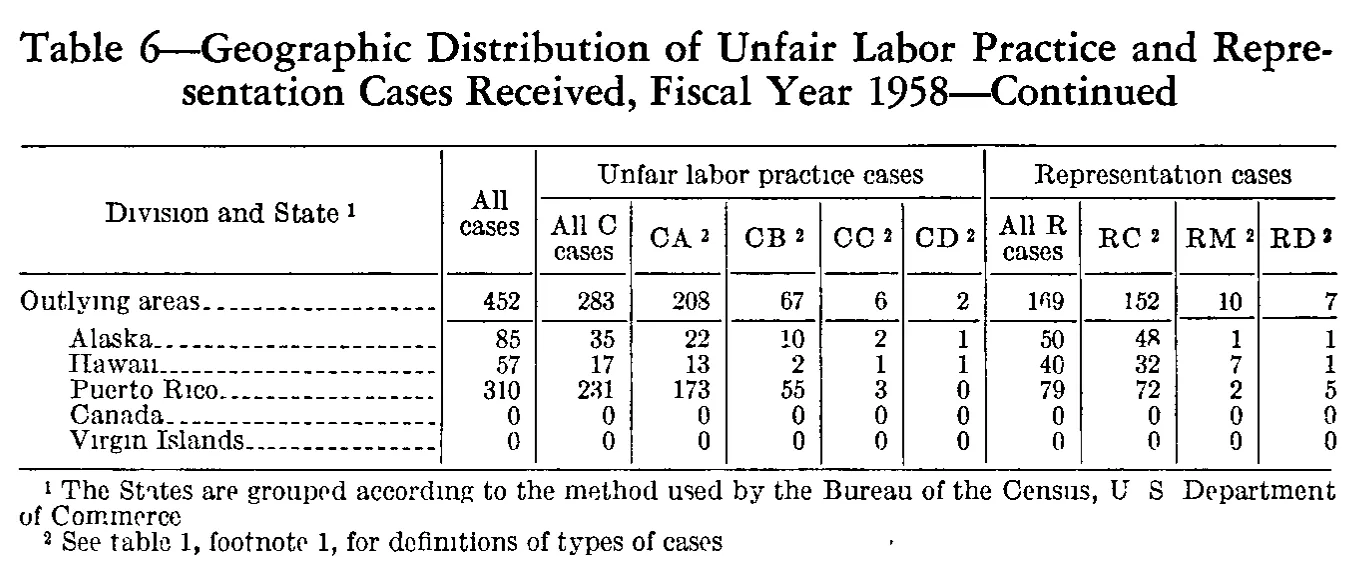
Geographic Distribution of Unfair Labor Practice and Representation Cases Received, Fiscal Year 1958
Stitched from pp. 161–162.
| Division and State | All cases | Unfair labor practice cases | Representation cases | |||||||
|---|---|---|---|---|---|---|---|---|---|---|
| Division and State | All cases | All C cases | CA | CB | CC | CD | All R cases | RC | RM | RD |
| Total | 16,659 | 9,260 | 6,068 | 2,473 | 527 | 192 | 7,399 | 6,284 | 626 | 489 |
| New England | 774 | 420 | 266 | 107 | 33 | 14 | 354 | 296 | 36 | 22 |
| Maine | 63 | 29 | 22 | 4 | 2 | 1 | 34 | 23 | 9 | 2 |
| New Hampshire | 28 | 8 | 6 | 1 | 1 | 0 | 20 | 19 | 1 | 0 |
| Vermont | 20 | 12 | 12 | 0 | 0 | 0 | 8 | 6 | 1 | 1 |
| Massachusetts | 434 | 243 | 151 | 67 | 19 | 6 | 191 | 163 | 18 | 10 |
| Rhode Island | 64 | 42 | 21 | 14 | 6 | 1 | 22 | 19 | 2 | 1 |
| Connecticut | 165 | 86 | 54 | 21 | 5 | 6 | 79 | 66 | 5 | 8 |
| Middle Atlantic | 3,343 | 1,836 | 1,123 | 555 | 108 | 50 | 1,507 | 1,241 | 152 | 114 |
| New York | 1,791 | 1,058 | 638 | 351 | 46 | 23 | 733 | 595 | 71 | 67 |
| New Jersey | 643 | 302 | 199 | 78 | 15 | 10 | 341 | 290 | 33 | 18 |
| Pennsylvania | 909 | 476 | 286 | 126 | 47 | 17 | 433 | 356 | 48 | 29 |
| East North Central | 3,385 | 1,818 | 1,199 | 502 | 92 | 25 | 1,567 | 1,334 | 129 | 104 |
| Ohio | 797 | 409 | 249 | 129 | 24 | 7 | 388 | 330 | 28 | 30 |
| Indiana | 464 | 303 | 186 | 92 | 22 | 3 | 161 | 147 | 5 | 9 |
| Illinois | 1,031 | 595 | 390 | 180 | 18 | 7 | 436 | 359 | 50 | 27 |
| Michigan | 820 | 434 | 313 | 93 | 22 | 6 | 386 | 329 | 34 | 23 |
| Wisconsin | 273 | 77 | 61 | 8 | 6 | 2 | 196 | 169 | 12 | 15 |
| West North Central | 1,285 | 552 | 399 | 115 | 29 | 9 | 733 | 639 | 51 | 43 |
| Iowa | 142 | 49 | 44 | 1 | 3 | 1 | 93 | 82 | 5 | 6 |
| Minnesota | 222 | 59 | 38 | 9 | 9 | 3 | 163 | 140 | 12 | 11 |
| Missouri | 584 | 341 | 234 | 91 | 11 | 5 | 243 | 212 | 20 | 11 |
| North Dakota | 46 | 12 | 10 | 1 | 1 | 0 | 34 | 28 | 3 | 3 |
| South Dakota | 55 | 7 | 7 | 0 | 0 | 0 | 48 | 46 | 1 | 1 |
| Nebraska | 99 | 35 | 29 | 6 | 0 | 0 | 64 | 57 | 1 | 6 |
| Kansas | 137 | 49 | 37 | 7 | 5 | 0 | 88 | 74 | 9 | 5 |
| South Atlantic | 2,232 | 1,372 | 995 | 315 | 45 | 17 | 860 | 779 | 46 | 35 |
| Delaware | 50 | 14 | 11 | 2 | 1 | 0 | 36 | 34 | 1 | 1 |
| Maryland | 180 | 98 | 61 | 33 | 2 | 2 | 82 | 68 | 11 | 3 |
| District of Columbia | 114 | 36 | 28 | 5 | 2 | 1 | 78 | 72 | 4 | 2 |
| Virginia | 235 | 123 | 100 | 13 | 8 | 2 | 112 | 101 | 6 | 5 |
| West Virginia | 225 | 163 | 106 | 39 | 10 | 8 | 62 | 52 | 8 | 2 |
| North Carolina | 300 | 153 | 136 | 17 | 0 | 0 | 147 | 136 | 4 | 7 |
| South Carolina | 60 | 42 | 37 | 5 | 0 | 0 | 18 | 15 | 2 | 1 |
| Georgia | 389 | 270 | 188 | 69 | 9 | 4 | 119 | 110 | 6 | 3 |
| Florida | 679 | 473 | 328 | 132 | 13 | 0 | 206 | 191 | 4 | 11 |
| East South Central | 1,286 | 894 | 582 | 188 | 106 | 18 | 392 | 344 | 23 | 25 |
| Kentucky | 378 | 289 | 192 | 51 | 37 | 9 | 89 | 77 | 5 | 7 |
| Tennessee | 486 | 312 | 198 | 70 | 40 | 4 | 174 | 150 | 11 | 13 |
| Alabama | 332 | 246 | 151 | 62 | 28 | 5 | 86 | 76 | 6 | 4 |
| Mississippi | 90 | 47 | 41 | 5 | 1 | 0 | 43 | 41 | 1 | 1 |
| West South Central | 1,230 | 659 | 463 | 162 | 28 | 6 | 571 | 486 | 46 | 39 |
| Arkansas | 104 | 32 | 29 | 3 | 0 | 0 | 72 | 67 | 4 | 1 |
| Louisiana | 373 | 237 | 155 | 76 | 6 | 0 | 136 | 119 | 10 | 7 |
| Oklahoma | 115 | 47 | 32 | 6 | 9 | 0 | 68 | 53 | 11 | 4 |
| Texas | 638 | 343 | 247 | 77 | 13 | 6 | 295 | 247 | 21 | 27 |
| Mountain | 757 | 409 | 238 | 97 | 44 | 30 | 348 | 298 | 34 | 16 |
| Montana | 58 | 36 | 24 | 7 | 4 | 1 | 22 | 10 | 8 | 4 |
| Idaho | 64 | 21 | 17 | 3 | 1 | 0 | 43 | 35 | 4 | 4 |
| Wyoming | 25 | 11 | 9 | 2 | 0 | 0 | 14 | 13 | 1 | 0 |
| Colorado | 216 | 110 | 86 | 23 | 1 | 0 | 106 | 91 | 10 | 5 |
| New Mexico | 213 | 177 | 64 | 52 | 33 | 28 | 66 | 58 | 8 | 0 |
| Arizona | 89 | 36 | 28 | 6 | 2 | 0 | 53 | 49 | 2 | 2 |
| Utah | 47 | 10 | 6 | 1 | 2 | 1 | 37 | 37 | 0 | 0 |
| Nevada | 15 | 8 | 4 | 3 | 1 | 0 | 7 | 5 | 1 | 1 |
| Pacific | 1,915 | 1,017 | 595 | 365 | 36 | 21 | 898 | 715 | 99 | 84 |
| Washington | 227 | 124 | 69 | 47 | 3 | 5 | 103 | 78 | 16 | 9 |
| Oregon | 203 | 118 | 73 | 41 | 3 | 1 | 85 | 56 | 17 | 12 |
| California | 1,485 | 775 | 453 | 277 | 30 | 15 | 710 | 581 | 66 | 63 |
| Outlying areas | 452 | 283 | 208 | 67 | 6 | 2 | 169 | 152 | 10 | 7 |
| Alaska | 85 | 35 | 22 | 10 | 2 | 1 | 50 | 48 | 1 | 1 |
| Hawaii | 57 | 17 | 13 | 2 | 1 | 1 | 40 | 32 | 7 | 1 |
| Puerto Rico | 310 | 231 | 173 | 55 | 3 | 0 | 79 | 72 | 2 | 5 |
| Canada | 0 | 0 | 0 | 0 | 0 | 0 | 0 | 0 | 0 | 0 |
| Virgin Islands | 0 | 0 | 0 | 0 | 0 | 0 | 0 | 0 | 0 | 0 |
- 1 The States are grouped according to the method used by the Bureau of the Census, U S Department of Commerce
- 2 See table 1, footnote 1, for definitions of types of cases
595 of 596 figures sit in a row or column sum that works out. 2 cells break a sum: 'New Mexico', column 2: prints 213, the subtotals in columns 3 to 8 add to 243; 'Mountain', column 2: prints 757, rows 'Montana' to 'Nevada' add to 727.
Reader’s notes
p. 161. Table 6 of the 23rd Annual Report (FY 1958), 11 columns: stub, "All cases", five unfair-labor-practice columns, four representation columns. The crop ends after California, below a closing rule, and no footnote texts appear on this page; markers ^1 (on the stub heading) and ^2 (on the CA/CB/CC/CD/RC/RM/RD headings) are printed but their definitions are not on this image. The table is almost certainly continued on the following page: the printed Total row exceeds the sum of the nine divisions shown here by 452 in "All cases" (16,659 printed vs 16,207 summed), and the shortfall decomposes consistently across every column (All C 9,260 vs 8,977; All R 7,399 vs 7,230; CA 208, CB 67, CC 6, CD 2, RC 152, RM 10, RD 7), which is what would be expected if rows for outlying areas (e.g. Alaska, Hawaii, Puerto Rico) follow. Doubtful cell: "New Mexico", column "All cases". I read the printed figure as 213, transcribed as printed. Arithmetic indicates it should be 243: New Mexico's All C (177) + All R (66) = 243, and the Mountain division total of 757 reconciles exactly only with 243 (58+64+25+216+243+89+47+15 = 757). Either the source is a misprint or the middle digit is a 4 degraded in the scan; it is the only cell in the body that fails an internal check. Every other state row and every division subtotal was checked and reconciles exactly (component columns sum to "All C cases" and "All R cases", and those two sum to "All cases"), which confirms the column assignment throughout. Minor scan artifacts, read without doubt: a stray ink speck sits just left of the "1" in Delaware/RM^2; the "1" in South Dakota/RD^2 prints with a broken serif resembling a "J". Both are confirmed by their row arithmetic.
p. 162. This image is the final (continuation) page of Table 6; it carries only the "Outlying areas" block, so the Division/State rows for the United States proper are on the preceding page(s), not in this crop. The column headings are printed here, so they are transcribed. Scan artifacts: the abbreviation punctuation in footnote 1 ("U S Department of Commerce") and the terminal periods of both footnotes are not legible in the scan — they were almost certainly printed as "U. S." and with closing periods, but I transcribed only the characters visible. The stub heading "Division and State" and the row labels "Hawaii", "Puerto Rico", "Virgin Islands" show dropped/broken dots on the i's from the scan; wording is otherwise unambiguous. Internal arithmetic checks all pass as printed: each row's "All C cases" equals CA+CB+CC+CD, "All R cases" equals RC+RM+RD, "All cases" equals All C + All R, and the three nonzero territory rows sum to the "Outlying areas" line in every column.
Source image
Source data: U.S. NLRB Annual Reports (public domain). Reconstruction by NLRB Stats Archive. Read by claude-opus-5 (effort max, prompt extract_v1) from the 300-dpi scan; stitched by page. Updated October 2026.