NLRB Stats Archive › Annual Reports › FY1958 › Industrial Distribution of Unfair Labor Practice and Representation Cases Received, Fiscal Year 1958
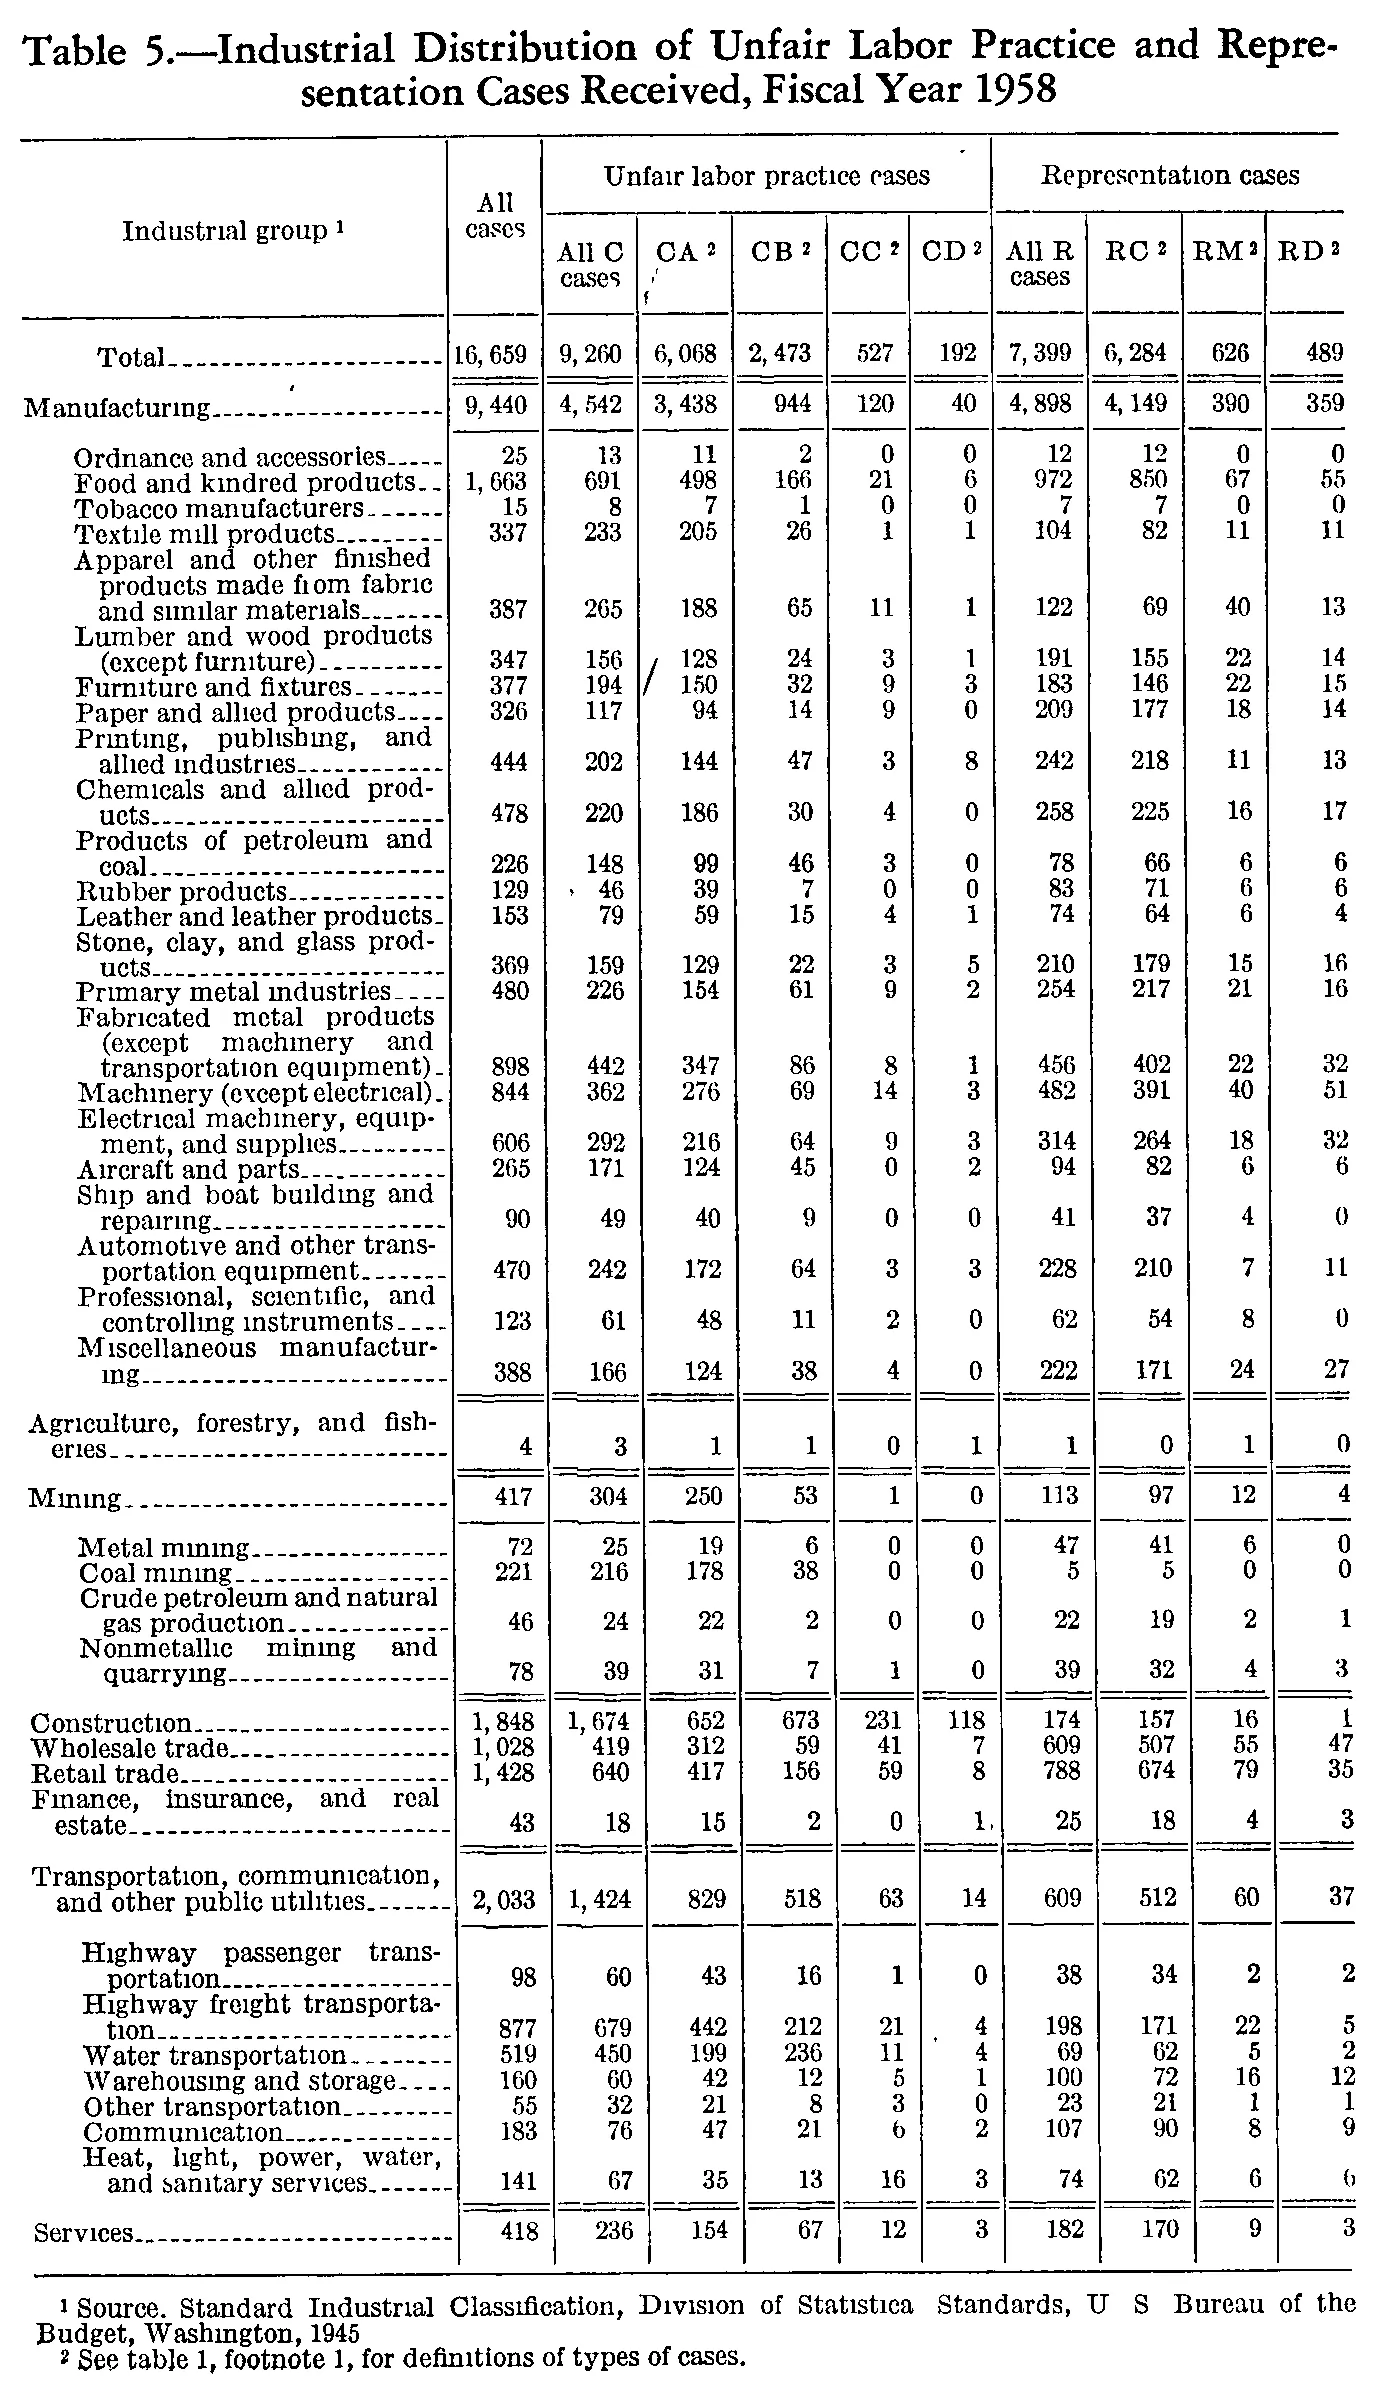
Industrial Distribution of Unfair Labor Practice and Representation Cases Received, Fiscal Year 1958
| Industrial group | All cases | Unfair labor practice cases | Representation cases | |||||||
|---|---|---|---|---|---|---|---|---|---|---|
| Industrial group | All cases | All C cases | CA | CB | CC | CD | All R cases | RC | RM | RD |
| Total | 16,659 | 9,260 | 6,068 | 2,473 | 527 | 192 | 7,399 | 6,284 | 626 | 489 |
| Manufacturing | 9,440 | 4,542 | 3,438 | 944 | 120 | 40 | 4,898 | 4,149 | 390 | 359 |
| Ordnance and accessories | 25 | 13 | 11 | 2 | 0 | 0 | 12 | 12 | 0 | 0 |
| Food and kindred products | 1,663 | 691 | 498 | 166 | 21 | 6 | 972 | 850 | 67 | 55 |
| Tobacco manufacturers | 15 | 8 | 7 | 1 | 0 | 0 | 7 | 7 | 0 | 0 |
| Textile mill products | 337 | 233 | 205 | 26 | 1 | 1 | 104 | 82 | 11 | 11 |
| Apparel and other finished products made from fabric and similar materials | 387 | 265 | 188 | 65 | 11 | 1 | 122 | 69 | 40 | 13 |
| Lumber and wood products (except furniture) | 347 | 156 | 128 | 24 | 3 | 1 | 191 | 155 | 22 | 14 |
| Furniture and fixtures | 377 | 194 | 150 | 32 | 9 | 3 | 183 | 146 | 22 | 15 |
| Paper and allied products | 326 | 117 | 94 | 14 | 9 | 0 | 209 | 177 | 18 | 14 |
| Printing, publishing, and allied industries | 444 | 202 | 144 | 47 | 3 | 8 | 242 | 218 | 11 | 13 |
| Chemicals and allied products | 478 | 220 | 186 | 30 | 4 | 0 | 258 | 225 | 16 | 17 |
| Products of petroleum and coal | 226 | 148 | 99 | 46 | 3 | 0 | 78 | 66 | 6 | 6 |
| Rubber products | 129 | 46 | 39 | 7 | 0 | 0 | 83 | 71 | 6 | 6 |
| Leather and leather products | 153 | 79 | 59 | 15 | 4 | 1 | 74 | 64 | 6 | 4 |
| Stone, clay, and glass products | 369 | 159 | 129 | 22 | 3 | 5 | 210 | 179 | 15 | 16 |
| Primary metal industries | 480 | 226 | 154 | 61 | 9 | 2 | 254 | 217 | 21 | 16 |
| Fabricated metal products (except machinery and transportation equipment) | 898 | 442 | 347 | 86 | 8 | 1 | 456 | 402 | 22 | 32 |
| Machinery (except electrical) | 844 | 362 | 276 | 69 | 14 | 3 | 482 | 391 | 40 | 51 |
| Electrical machinery, equipment, and supplies | 606 | 292 | 216 | 64 | 9 | 3 | 314 | 264 | 18 | 32 |
| Aircraft and parts | 265 | 171 | 124 | 45 | 0 | 2 | 94 | 82 | 6 | 6 |
| Ship and boat building and repairing | 90 | 49 | 40 | 9 | 0 | 0 | 41 | 37 | 4 | 0 |
| Automotive and other transportation equipment | 470 | 242 | 172 | 64 | 3 | 3 | 228 | 210 | 7 | 11 |
| Professional, scientific, and controlling instruments | 123 | 61 | 48 | 11 | 2 | 0 | 62 | 54 | 8 | 0 |
| Miscellaneous manufacturing | 388 | 166 | 124 | 38 | 4 | 0 | 222 | 171 | 24 | 27 |
| Agriculture, forestry, and fisheries | 4 | 3 | 1 | 1 | 0 | 1 | 1 | 0 | 1 | 0 |
| Mining | 417 | 304 | 250 | 53 | 1 | 0 | 113 | 97 | 12 | 4 |
| Metal mining | 72 | 25 | 19 | 6 | 0 | 0 | 47 | 41 | 6 | 0 |
| Coal mining | 221 | 216 | 178 | 38 | 0 | 0 | 5 | 5 | 0 | 0 |
| Crude petroleum and natural gas production | 46 | 24 | 22 | 2 | 0 | 0 | 22 | 19 | 2 | 1 |
| Nonmetallic mining and quarrying | 78 | 39 | 31 | 7 | 1 | 0 | 39 | 32 | 4 | 3 |
| Construction | 1,848 | 1,674 | 652 | 673 | 231 | 118 | 174 | 157 | 16 | 1 |
| Wholesale trade | 1,028 | 419 | 312 | 59 | 41 | 7 | 609 | 507 | 55 | 47 |
| Retail trade | 1,428 | 640 | 417 | 156 | 59 | 8 | 788 | 674 | 79 | 35 |
| Finance, insurance, and real estate | 43 | 18 | 15 | 2 | 0 | 1 | 25 | 18 | 4 | 3 |
| Transportation, communication, and other public utilities | 2,033 | 1,424 | 829 | 518 | 63 | 14 | 609 | 512 | 60 | 37 |
| Highway passenger transportation | 98 | 60 | 43 | 16 | 1 | 0 | 38 | 34 | 2 | 2 |
| Highway freight transportation | 877 | 679 | 442 | 212 | 21 | 4 | 198 | 171 | 22 | 5 |
| Water transportation | 519 | 450 | 199 | 236 | 11 | 4 | 69 | 62 | 5 | 2 |
| Warehousing and storage | 160 | 60 | 42 | 12 | 5 | 1 | 100 | 72 | 16 | 12 |
| Other transportation | 55 | 32 | 21 | 8 | 3 | 0 | 23 | 21 | 1 | 1 |
| Communication | 183 | 76 | 47 | 21 | 6 | 2 | 107 | 90 | 8 | 9 |
| Heat, light, power, water, and sanitary services | 141 | 67 | 35 | 13 | 16 | 3 | 74 | 62 | 6 | 6 |
| Services | 418 | 236 | 154 | 67 | 12 | 3 | 182 | 170 | 9 | 3 |
- 1 Source. Standard Industrial Classification, Division of Statistical Standards, U S Bureau of the Budget, Washington, 1945
- 2 See table 1, footnote 1, for definitions of types of cases.
403 of 403 figures sit in a row or column sum that works out.
Reader’s notes
p. 160. Eleven columns: stub, "All cases", five unfair-labor-practice columns (All C cases, CA, CB, CC, CD), and four representation columns (All R cases, RC, RM, RD). The stub heading and "All cases" span both heading levels, so they are repeated. Every row was checked arithmetically and the table is internally consistent: in each row the four ULP detail columns sum to "All C cases", the three R detail columns sum to "All R cases", and All C + All R = All cases. The Manufacturing line equals the sum of its 23 industries, Mining equals its 4 sub-industries, and Transportation, communication, and other public utilities equals its 7 sub-lines, in every column. The grand Total line equals Manufacturing + Agriculture + Mining + Construction + Wholesale + Retail + Finance + Transportation + Services in every column. No misprints detected. Doubtful cells (all resolved by the row/column sums, which balance on the values given): "Heat, light, power, water, and sanitary services" RD is a broken glyph that reads 6 (62+6+6=74 confirms it); "Finance, insurance, and real estate" CD prints 1 followed by a stray ink speck (15+2+0+1=18 confirms it); "Communication" CC is faint and reads 6 (47+21+6+2=76 confirms it). The scan carries several stray pen/ink marks that are not part of the table: a small mark under the "All C cases" heading, a slash between the "All C cases" and "CA" columns at the Lumber/Furniture rows, a comma-like speck left of the Rubber products "All C" value 46, a mark above the "Representation cases" heading rule, a short mark left of the Manufacturing row label, and a speck in the CD column beside the Highway freight transportation row. In footnote 1 the punctuation after "Source" is a faint mark that may be a colon rather than the period transcribed, and the periods in "U S Bureau" have not survived the scan; the "l" of "Statistical" is likewise nearly lost but the word is Statistical.
Source image
Source data: U.S. NLRB Annual Reports (public domain). Reconstruction by NLRB Stats Archive. Read by claude-opus-5 (effort max, prompt extract_v1) from the 300-dpi scan; stitched by page. Updated October 2026.