NLRB Stats Archive › Annual Reports › FY1957 › Geographic Distribution of Collective-Bargaining Elections, Fiscal Year 1957
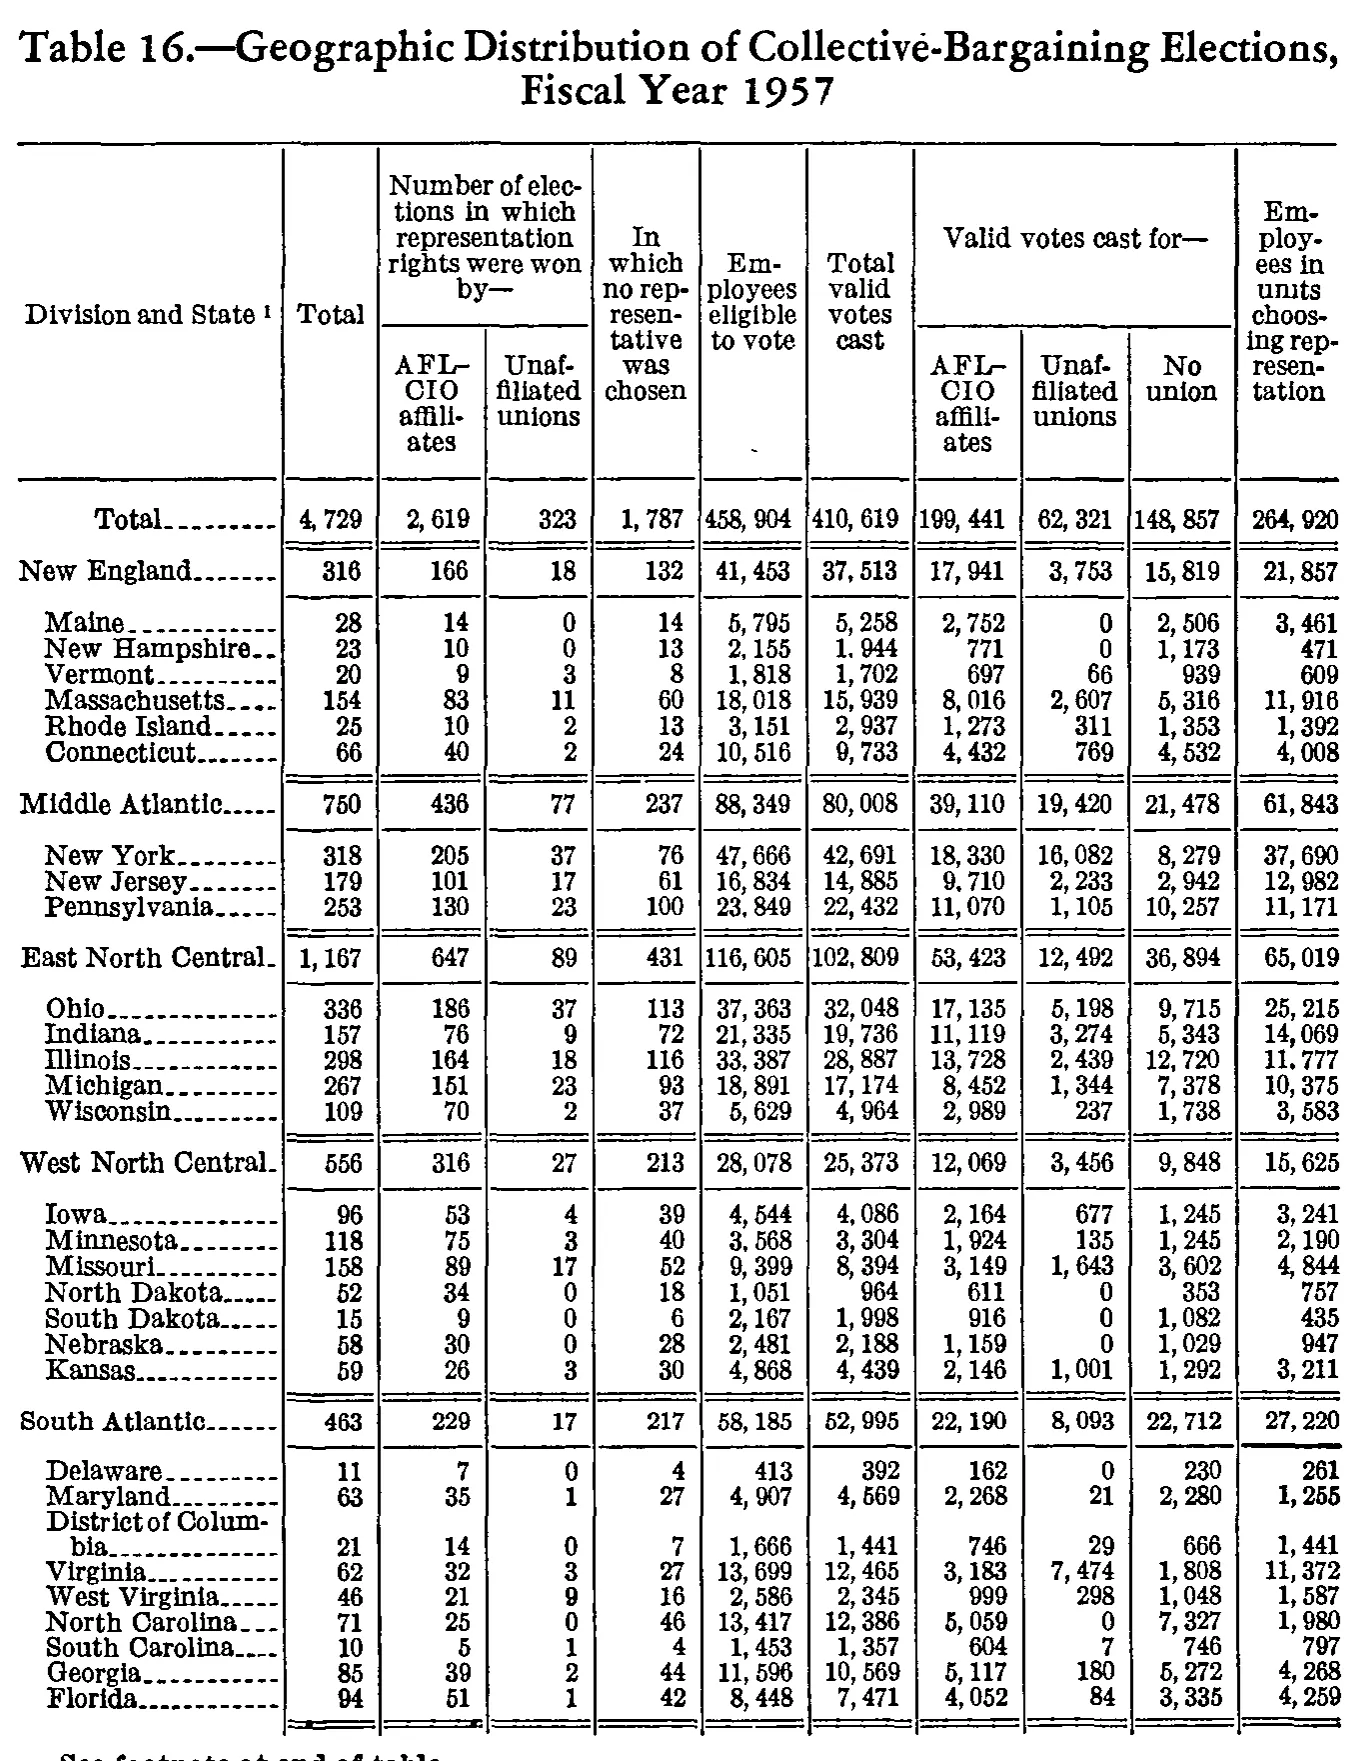
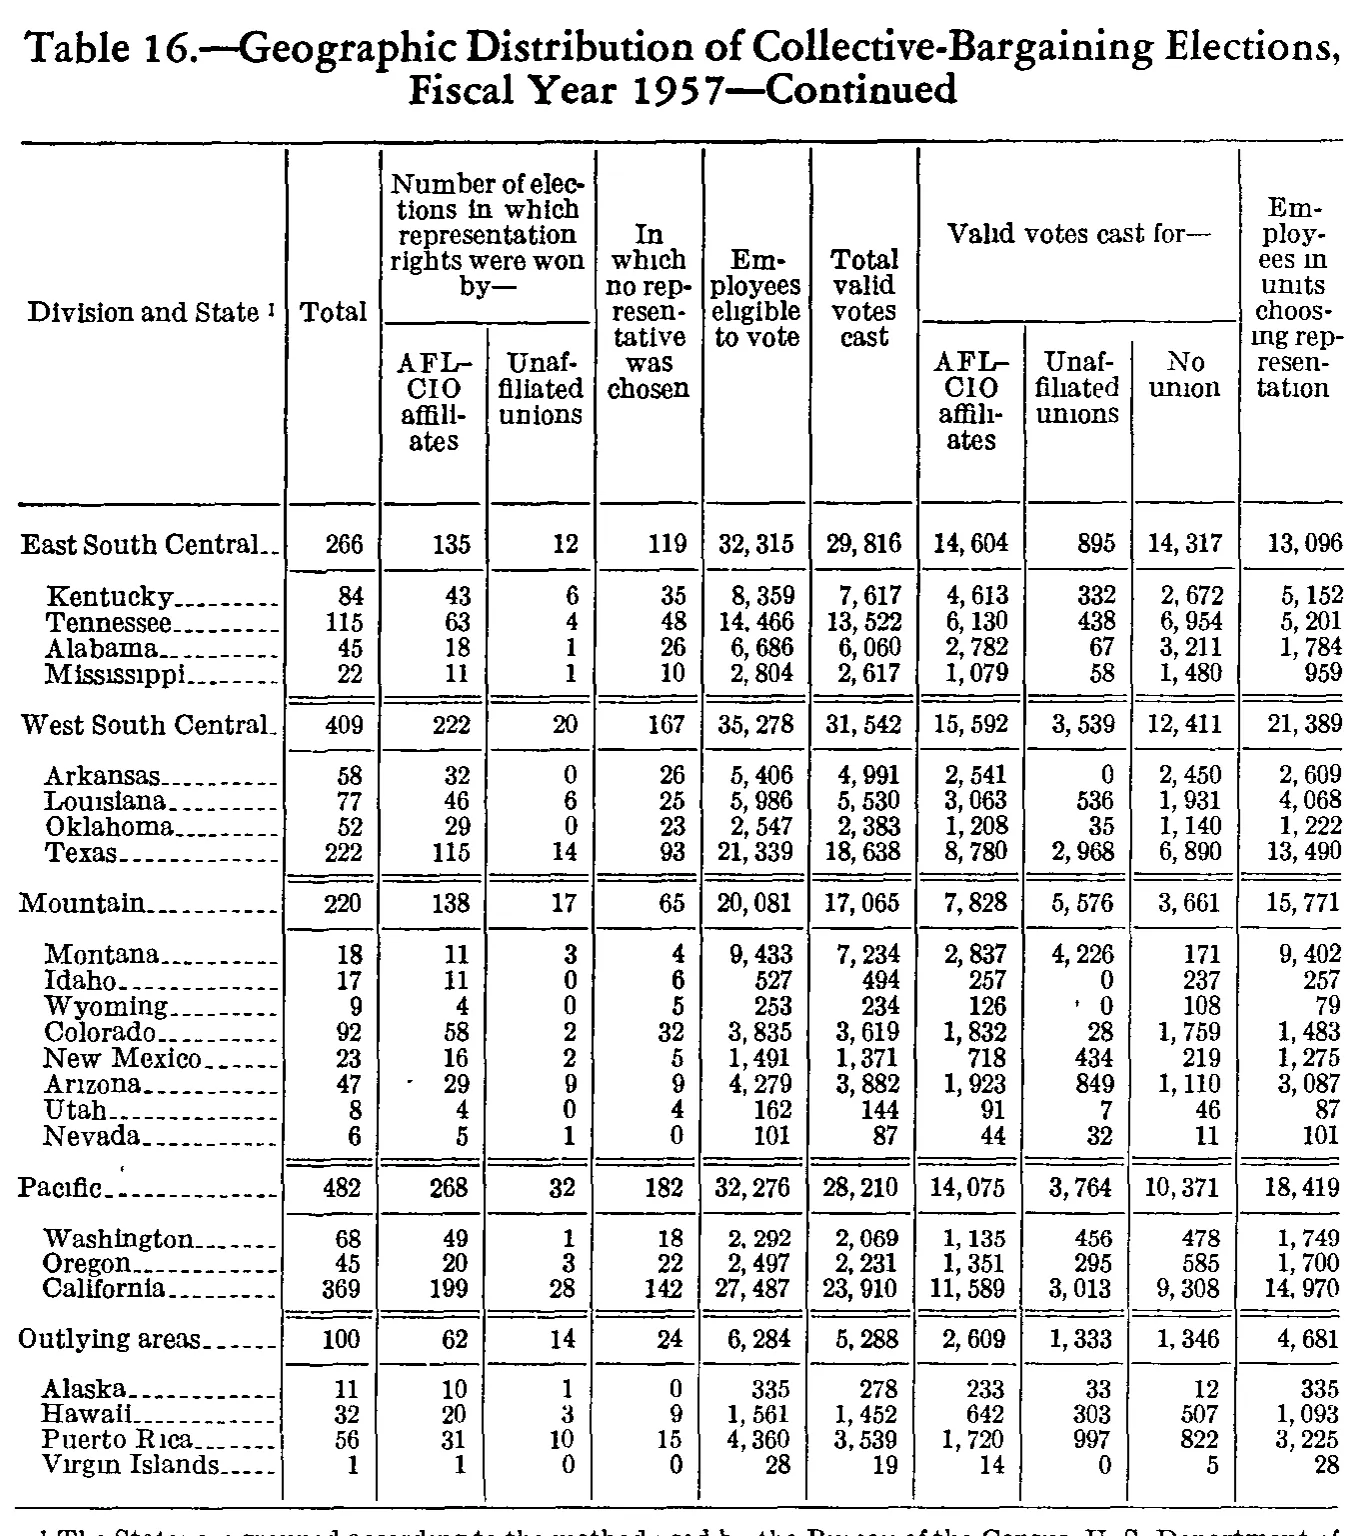
Geographic Distribution of Collective-Bargaining Elections, Fiscal Year 1957
Stitched from pp. 188–189.
| Division and State | Total | Number of elections in which representation rights were won by— | In which no representative was chosen | Employees eligible to vote | Total valid votes cast | Valid votes cast for— | Employees in units choosing representation | |||
|---|---|---|---|---|---|---|---|---|---|---|
| Division and State | Total | AFL-CIO affiliates | Unaffiliated unions | In which no representative was chosen | Employees eligible to vote | Total valid votes cast | AFL-CIO affiliates | Unaffiliated unions | No union | Employees in units choosing representation |
| Total | 4,729 | 2,619 | 323 | 1,787 | 458,904 | 410,619 | 199,441 | 62,321 | 148,857 | 264,920 |
| New England | 316 | 166 | 18 | 132 | 41,453 | 37,513 | 17,941 | 3,753 | 15,819 | 21,857 |
| Maine | 28 | 14 | 0 | 14 | 5,795 | 5,258 | 2,752 | 0 | 2,506 | 3,461 |
| New Hampshire | 23 | 10 | 0 | 13 | 2,155 | 1,944 | 771 | 0 | 1,173 | 471 |
| Vermont | 20 | 9 | 3 | 8 | 1,818 | 1,702 | 697 | 66 | 939 | 609 |
| Massachusetts | 154 | 83 | 11 | 60 | 18,018 | 15,939 | 8,016 | 2,607 | 5,316 | 11,916 |
| Rhode Island | 25 | 10 | 2 | 13 | 3,151 | 2,937 | 1,273 | 311 | 1,353 | 1,392 |
| Connecticut | 66 | 40 | 2 | 24 | 10,516 | 9,733 | 4,432 | 769 | 4,532 | 4,008 |
| Middle Atlantic | 750 | 436 | 77 | 237 | 88,349 | 80,008 | 39,110 | 19,420 | 21,478 | 61,843 |
| New York | 318 | 205 | 37 | 76 | 47,666 | 42,691 | 18,330 | 16,082 | 8,279 | 37,690 |
| New Jersey | 179 | 101 | 17 | 61 | 16,834 | 14,885 | 9,710 | 2,233 | 2,942 | 12,982 |
| Pennsylvania | 253 | 130 | 23 | 100 | 23,849 | 22,432 | 11,070 | 1,105 | 10,257 | 11,171 |
| East North Central | 1,167 | 647 | 89 | 431 | 116,605 | 102,809 | 53,423 | 12,492 | 36,894 | 65,019 |
| Ohio | 336 | 186 | 37 | 113 | 37,363 | 32,048 | 17,135 | 5,198 | 9,715 | 25,215 |
| Indiana | 157 | 76 | 9 | 72 | 21,335 | 19,736 | 11,119 | 3,274 | 5,343 | 14,069 |
| Illinois | 298 | 164 | 18 | 116 | 33,387 | 28,887 | 13,728 | 2,439 | 12,720 | 11,777 |
| Michigan | 267 | 151 | 23 | 93 | 18,891 | 17,174 | 8,452 | 1,344 | 7,378 | 10,375 |
| Wisconsin | 109 | 70 | 2 | 37 | 5,629 | 4,964 | 2,989 | 237 | 1,738 | 3,583 |
| West North Central | 556 | 316 | 27 | 213 | 28,078 | 25,373 | 12,069 | 3,456 | 9,848 | 15,625 |
| Iowa | 96 | 53 | 4 | 39 | 4,544 | 4,086 | 2,164 | 677 | 1,245 | 3,241 |
| Minnesota | 118 | 75 | 3 | 40 | 3,568 | 3,304 | 1,924 | 135 | 1,245 | 2,190 |
| Missouri | 158 | 89 | 17 | 52 | 9,399 | 8,394 | 3,149 | 1,643 | 3,602 | 4,844 |
| North Dakota | 52 | 34 | 0 | 18 | 1,051 | 964 | 611 | 0 | 353 | 757 |
| South Dakota | 15 | 9 | 0 | 6 | 2,167 | 1,998 | 916 | 0 | 1,082 | 435 |
| Nebraska | 58 | 30 | 0 | 28 | 2,481 | 2,188 | 1,159 | 0 | 1,029 | 947 |
| Kansas | 59 | 26 | 3 | 30 | 4,868 | 4,439 | 2,146 | 1,001 | 1,292 | 3,211 |
| South Atlantic | 463 | 229 | 17 | 217 | 58,185 | 52,995 | 22,190 | 8,093 | 22,712 | 27,220 |
| Delaware | 11 | 7 | 0 | 4 | 413 | 392 | 162 | 0 | 230 | 261 |
| Maryland | 63 | 35 | 1 | 27 | 4,907 | 4,569 | 2,268 | 21 | 2,280 | 1,255 |
| District of Columbia | 21 | 14 | 0 | 7 | 1,666 | 1,441 | 746 | 29 | 666 | 1,441 |
| Virginia | 62 | 32 | 3 | 27 | 13,699 | 12,465 | 3,183 | 7,474 | 1,808 | 11,372 |
| West Virginia | 46 | 21 | 9 | 16 | 2,586 | 2,345 | 999 | 298 | 1,048 | 1,587 |
| North Carolina | 71 | 25 | 0 | 46 | 13,417 | 12,386 | 5,059 | 0 | 7,327 | 1,980 |
| South Carolina | 10 | 5 | 1 | 4 | 1,453 | 1,357 | 604 | 7 | 746 | 797 |
| Georgia | 85 | 39 | 2 | 44 | 11,596 | 10,569 | 5,117 | 180 | 5,272 | 4,268 |
| Florida | 94 | 51 | 1 | 42 | 8,448 | 7,471 | 4,052 | 84 | 3,335 | 4,259 |
| East South Central | 266 | 135 | 12 | 119 | 32,315 | 29,816 | 14,604 | 895 | 14,317 | 13,096 |
| Kentucky | 84 | 43 | 6 | 35 | 8,359 | 7,617 | 4,613 | 332 | 2,672 | 5,152 |
| Tennessee | 115 | 63 | 4 | 48 | 14,466 | 13,522 | 6,130 | 438 | 6,954 | 5,201 |
| Alabama | 45 | 18 | 1 | 26 | 6,686 | 6,060 | 2,782 | 67 | 3,211 | 1,784 |
| Mississippi | 22 | 11 | 1 | 10 | 2,804 | 2,617 | 1,079 | 58 | 1,480 | 959 |
| West South Central | 409 | 222 | 20 | 167 | 35,278 | 31,542 | 15,592 | 3,539 | 12,411 | 21,389 |
| Arkansas | 58 | 32 | 0 | 26 | 5,406 | 4,991 | 2,541 | 0 | 2,450 | 2,609 |
| Louisiana | 77 | 46 | 6 | 25 | 5,986 | 5,530 | 3,063 | 536 | 1,931 | 4,068 |
| Oklahoma | 52 | 29 | 0 | 23 | 2,547 | 2,383 | 1,208 | 35 | 1,140 | 1,222 |
| Texas | 222 | 115 | 14 | 93 | 21,339 | 18,638 | 8,780 | 2,968 | 6,890 | 13,490 |
| Mountain | 220 | 138 | 17 | 65 | 20,081 | 17,065 | 7,828 | 5,576 | 3,661 | 15,771 |
| Montana | 18 | 11 | 3 | 4 | 9,433 | 7,234 | 2,837 | 4,226 | 171 | 9,402 |
| Idaho | 17 | 11 | 0 | 6 | 527 | 494 | 257 | 0 | 237 | 257 |
| Wyoming | 9 | 4 | 0 | 5 | 253 | 234 | 126 | 0 | 108 | 79 |
| Colorado | 92 | 58 | 2 | 32 | 3,835 | 3,619 | 1,832 | 28 | 1,759 | 1,483 |
| New Mexico | 23 | 16 | 2 | 5 | 1,491 | 1,371 | 718 | 434 | 219 | 1,275 |
| Arizona | 47 | 29 | 9 | 9 | 4,279 | 3,882 | 1,923 | 849 | 1,110 | 3,087 |
| Utah | 8 | 4 | 0 | 4 | 162 | 144 | 91 | 7 | 46 | 87 |
| Nevada | 6 | 5 | 1 | 0 | 101 | 87 | 44 | 32 | 11 | 101 |
| Pacific | 482 | 268 | 32 | 182 | 32,276 | 28,210 | 14,075 | 3,764 | 10,371 | 18,419 |
| Washington | 68 | 49 | 1 | 18 | 2,292 | 2,069 | 1,135 | 456 | 478 | 1,749 |
| Oregon | 45 | 20 | 3 | 22 | 2,497 | 2,231 | 1,351 | 295 | 585 | 1,700 |
| California | 369 | 199 | 28 | 142 | 27,487 | 23,910 | 11,589 | 3,013 | 9,308 | 14,970 |
| Outlying areas | 100 | 62 | 14 | 24 | 6,284 | 5,288 | 2,609 | 1,333 | 1,346 | 4,681 |
| Alaska | 11 | 10 | 1 | 0 | 335 | 278 | 233 | 33 | 12 | 335 |
| Hawaii | 32 | 20 | 3 | 9 | 1,561 | 1,452 | 642 | 303 | 507 | 1,093 |
| Puerto Rico | 56 | 31 | 10 | 15 | 4,360 | 3,539 | 1,720 | 997 | 822 | 3,225 |
| Virgin Islands | 1 | 1 | 0 | 0 | 28 | 19 | 14 | 0 | 5 | 28 |
- 1 The States are grouped according to the method used by the Bureau of the Census, U. S. Department of
612 of 612 figures sit in a row or column sum that works out.
Reader’s notes
p. 188. The crop ends after Florida; the table continues on the following page(s). A partly cut-off line "See footnote at end of table." sits at the bottom edge, so the text of footnote 1 (marker on the stub heading "Division and State") is not printed on this image and footnotes is therefore empty. Degraded/broken digit-grouping commas: three cells print what looks like a period rather than a comma — New Hampshire, "Total valid votes cast" ("1. 944"); Pennsylvania, "Employees eligible to vote" ("23. 849"); Illinois, "Employees in units choosing representation" ("11. 777"). All three are typeset thousands separators (the scan has thickened the comma into a dot) and are transcribed as 1,944 / 23,849 / 11,777; each is confirmed arithmetically (NH: 771+0+1,173=1,944; PA eligible completes the Middle Atlantic 88,349; IL completes the East North Central 65,019). Verification: every region subtotal and the grand total cross-foot exactly in all ten value columns (elections Total = AFL-CIO + unaffiliated + no representative; valid votes cast = the three "cast for" columns; and the state rows sum to each division line). No internal inconsistency or suspected misprint found.
p. 189. This is a continuation page ("—Continued"), but the column headings are reprinted on it, so header_rows is filled. The single footnote is cut off by the bottom edge of the crop: only its first line is visible (the letters are clipped at half height but legible), and the sentence continues past the crop (presumably "...U. S. Department of Commerce."). I transcribed only the visible portion. "Puerto Rico": the final letter of the state name is degraded in the scan and could be read as "Rica"; I transcribed the place name as "Puerto Rico". The dotless appearance of "i" in several labels (Mississippi, Louisiana, Hawaii, Arizona, Virgin Islands) is a scan artifact, not the printed spelling. Stray ink specks that are not part of any value: a small apostrophe-like mark left of the "0" in the Wyoming row, "Valid votes cast for—/Unaffiliated unions" column (the cell is a plain 0); a small dot left of "29" in the Arizona row, "Number of elections ... won by—/AFL-CIO affiliates" column; and a mark in the left margin just above the "Pacific" row label. All rows and columns were checked for internal arithmetic consistency (Total = AFL-CIO won + unaffiliated won + no representative chosen; total valid votes = the three vote columns; each division total = the sum of its States) and every check balanced, so no misprints are suspected.
Source image
Source data: U.S. NLRB Annual Reports (public domain). Reconstruction by NLRB Stats Archive. Read by claude-opus-5 (effort max, prompt extract_v1) from the 300-dpi scan; stitched by page. Updated October 2026.