NLRB Stats Archive › Annual Reports › FY1957 › Disposition of Unfair Labor Practice Cases Closed, Fiscal Year 1957
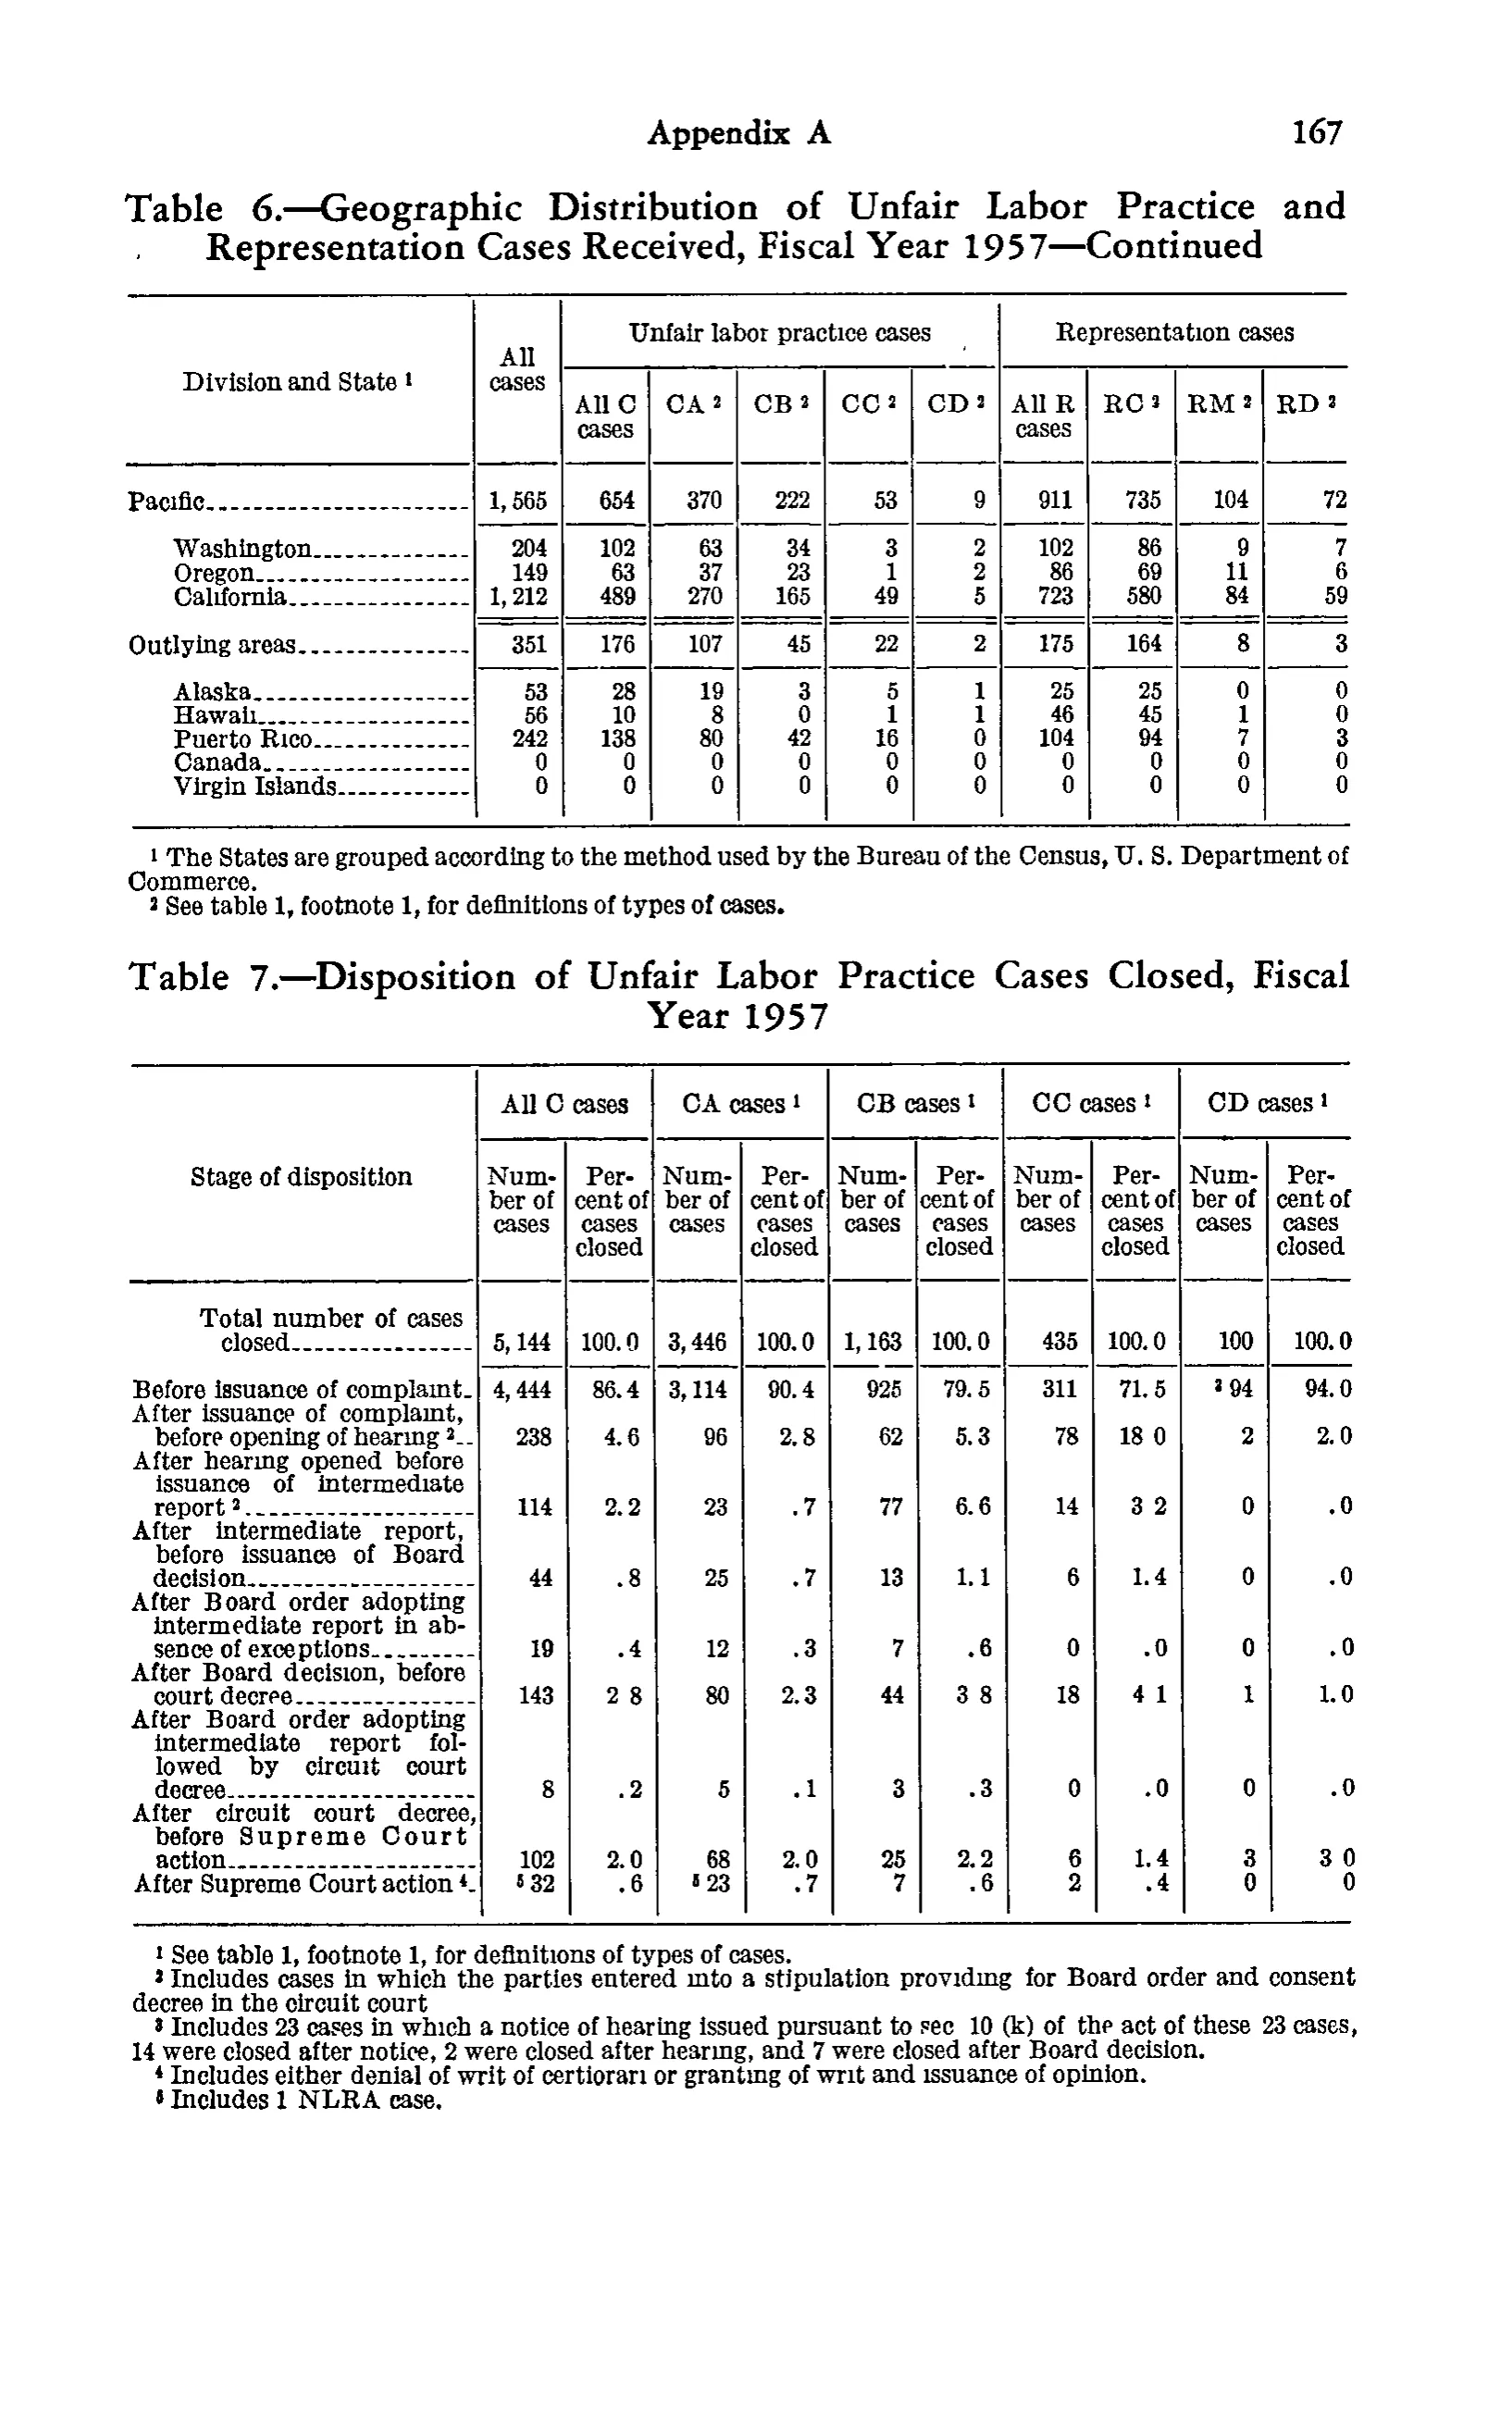
Disposition of Unfair Labor Practice Cases Closed, Fiscal Year 1957
| Division and State | All cases | Unfair labor practice cases | Representation cases | |||||||
|---|---|---|---|---|---|---|---|---|---|---|
| Division and State | All cases | All C cases | CA | CB | CC | CD | All R cases | RC | RM | RD |
| Pacific | 1,565 | 654 | 370 | 222 | 53 | 9 | 911 | 735 | 104 | 72 |
| Washington | 204 | 102 | 63 | 34 | 3 | 2 | 102 | 86 | 9 | 7 |
| Oregon | 149 | 63 | 37 | 23 | 1 | 2 | 86 | 69 | 11 | 6 |
| California | 1,212 | 489 | 270 | 165 | 49 | 5 | 723 | 580 | 84 | 59 |
| Outlying areas | 351 | 176 | 107 | 45 | 22 | 2 | 175 | 164 | 8 | 3 |
| Alaska | 53 | 28 | 19 | 3 | 5 | 1 | 25 | 25 | 0 | 0 |
| Hawaii | 56 | 10 | 8 | 0 | 1 | 1 | 46 | 45 | 1 | 0 |
| Puerto Rico | 242 | 138 | 80 | 42 | 16 | 0 | 104 | 94 | 7 | 3 |
| Canada | 0 | 0 | 0 | 0 | 0 | 0 | 0 | 0 | 0 | 0 |
| Virgin Islands | 0 | 0 | 0 | 0 | 0 | 0 | 0 | 0 | 0 | 0 |
- 1 The States are grouped according to the method used by the Bureau of the Census, U. S. Department of Commerce.
- 2 See table 1, footnote 1, for definitions of types of cases.
75 of 75 figures sit in a row or column sum that works out.
Reader’s notes
p. 180. The image is a full page (Appendix A, p. 167) carrying two separate tables: Table 6.—Geographic Distribution of Unfair Labor Practice and Representation Cases Received, Fiscal Year 1957—Continued (upper), and Table 7.—Disposition of Unfair Labor Practice Cases Closed, Fiscal Year 1957 (lower). Only one grid can be returned, so this transcription is of the upper table, Table 6—Continued, matching the "t1" (first table) tag in the file name; Table 7 and its five footnotes are present on the image but are NOT transcribed here and will need a separate pass. The crop shows the continuation of Table 6, so the Table 6 column headings reproduced above are the ones reprinted on this page; the preceding divisions and States appear on earlier pages. The raised markers on the type-of-case headings (CA, CB, CC, CD, RC, RM, RD) are all small superscript 2s referring to footnote 2; the scan renders a few of them indistinctly and they could be misread as 3s, but only footnotes 1 and 2 are printed under this table, so all are recorded as ^2. "All C cases" and "All R cases" carry no marker. Horizontal rules (a single rule under the Pacific block and a double rule under the California line, before "Outlying areas") are layout only and are not transcribed as rows. Row labels were followed by leader dots, which have been dropped. All printed figures are internally consistent: each row's "All cases" equals All C + All R, each All C equals CA+CB+CC+CD, each All R equals RC+RM+RD, and the Pacific and Outlying areas lines equal the sums of their member States/areas. No misprints detected in this table.
Source image
Source data: U.S. NLRB Annual Reports (public domain). Reconstruction by NLRB Stats Archive. Read by claude-opus-5 (effort max, prompt extract_v1) from the 300-dpi scan; stitched by page. Updated October 2026.