NLRB Stats Archive › Annual Reports › FY1957 › Disposition of Unfair Labor Practice Cases Closed, Fiscal Year 1957
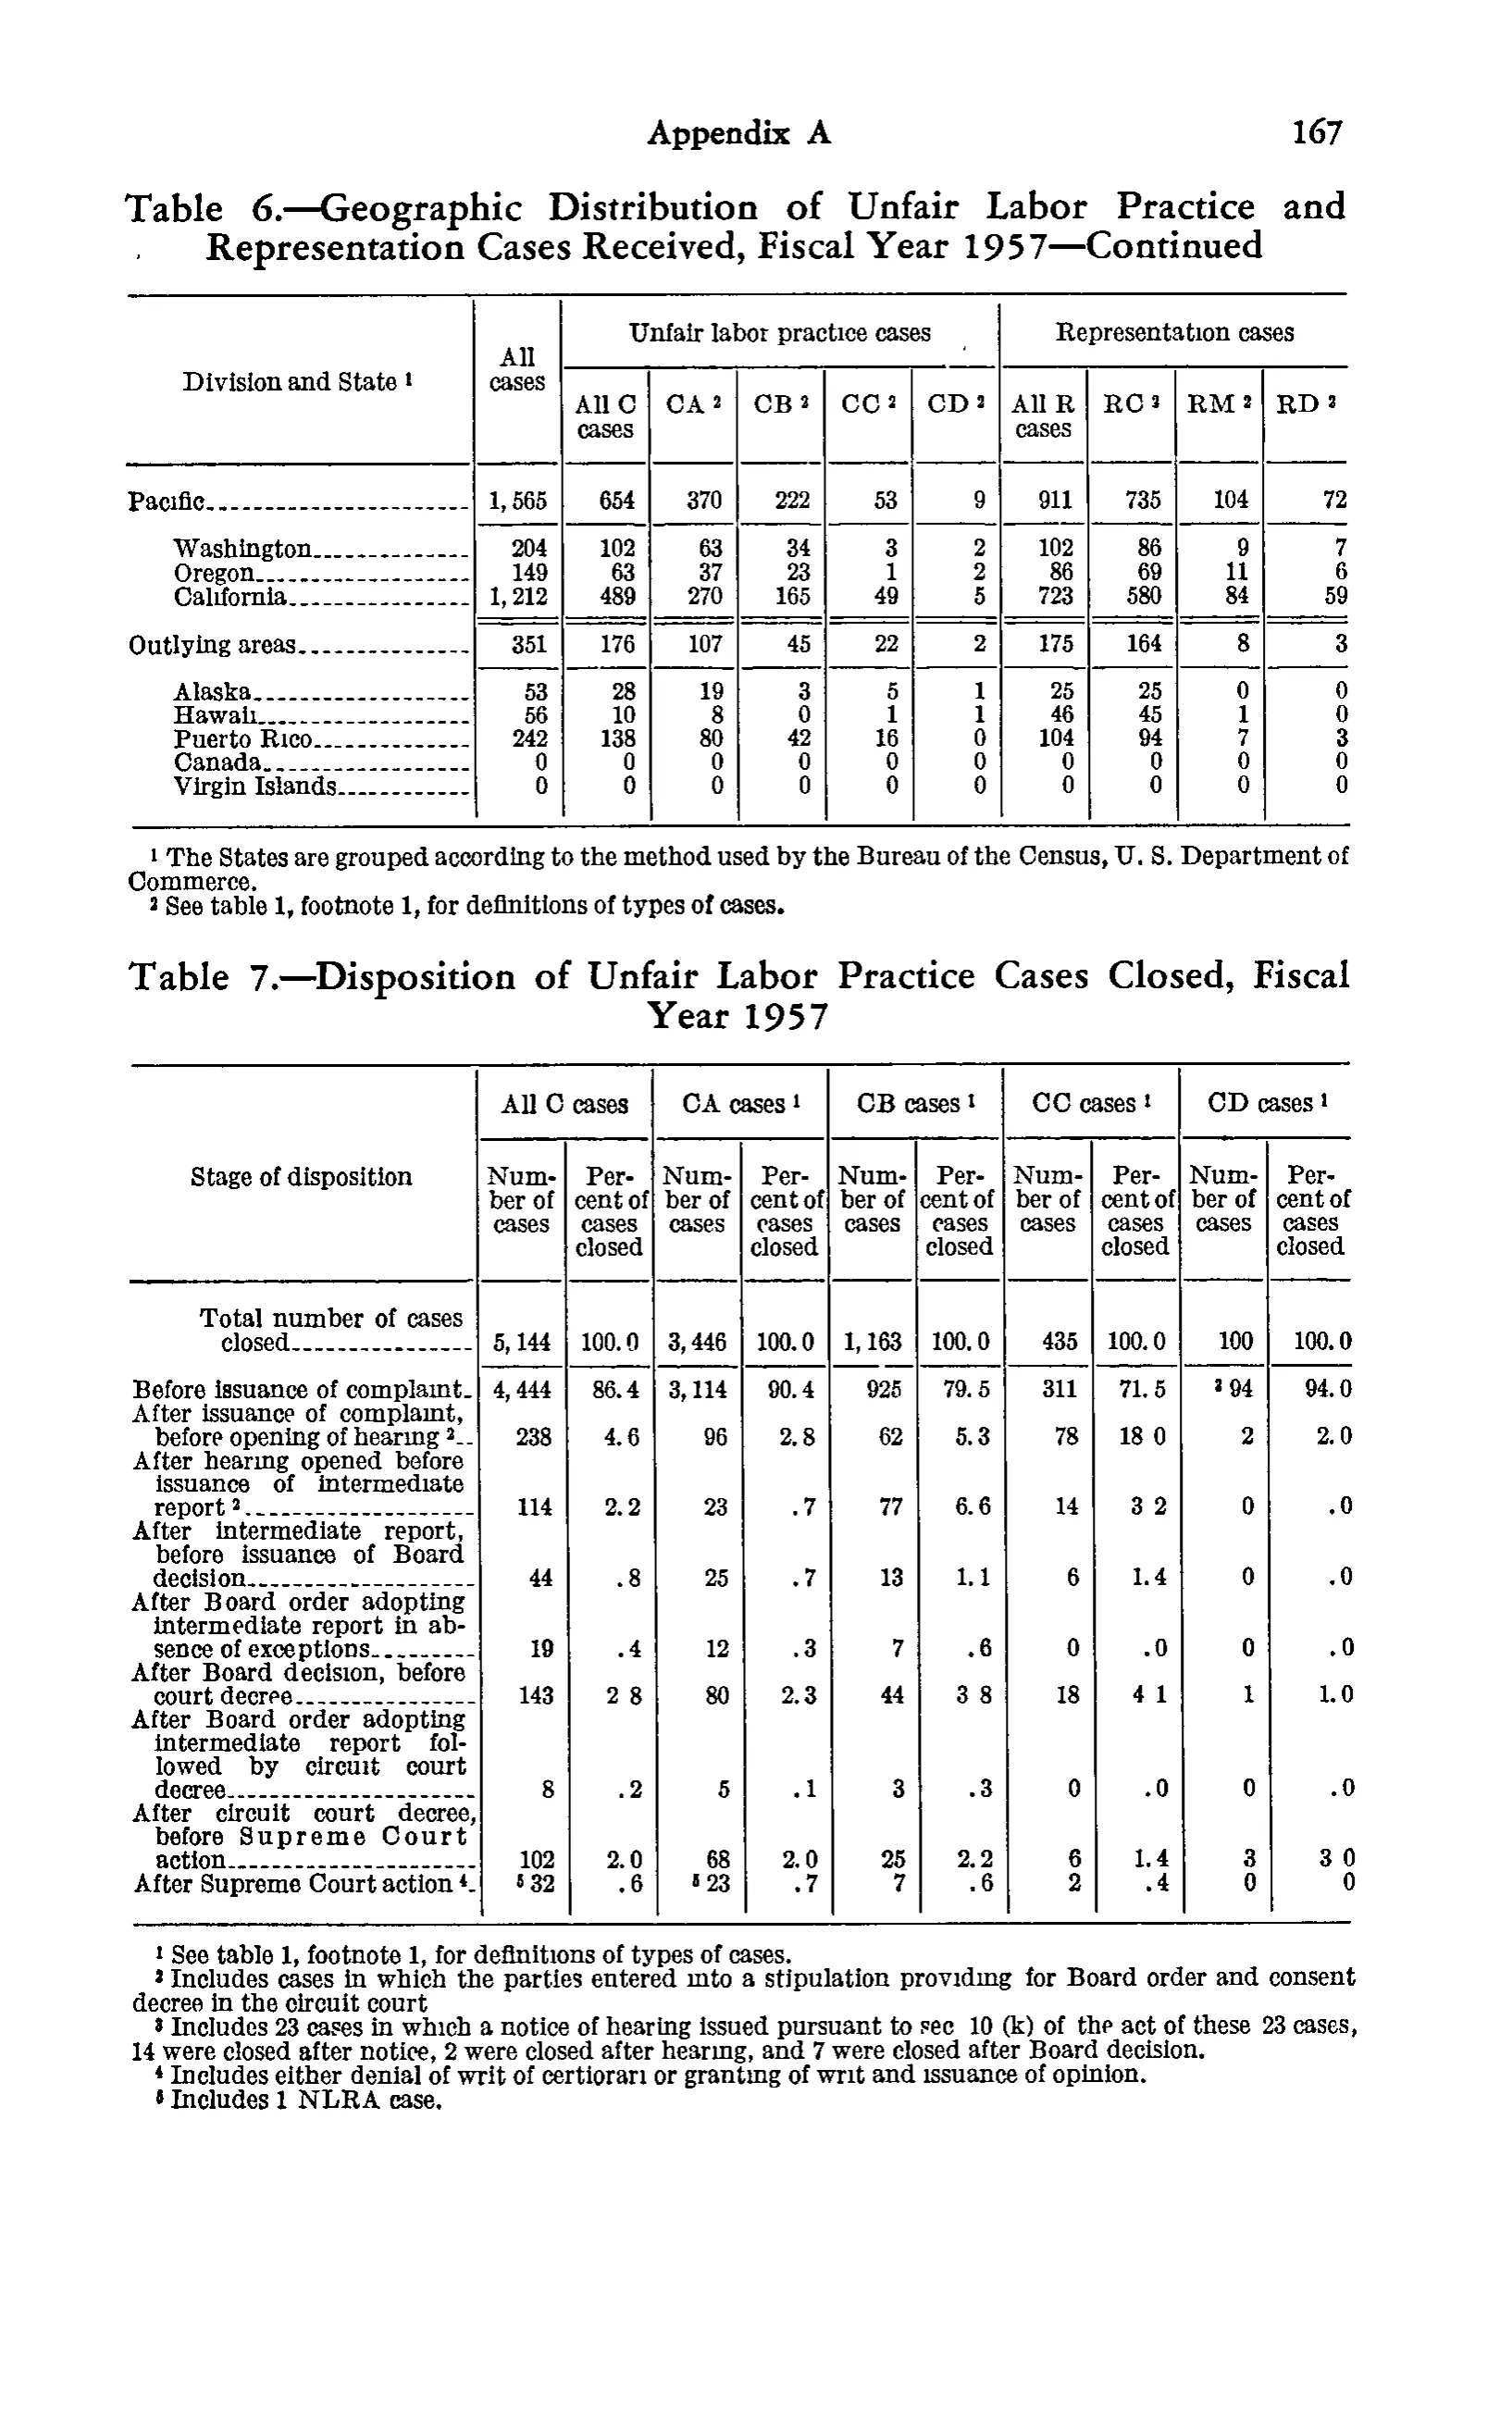
Disposition of Unfair Labor Practice Cases Closed, Fiscal Year 1957
| Division and State | All cases | Unfair labor practice cases | Representation cases | |||||||
|---|---|---|---|---|---|---|---|---|---|---|
| Division and State | All cases | All C cases | CA | CB | CC | CD | All R cases | RC | RM | RD |
| Pacific | 1,565 | 654 | 370 | 222 | 53 | 9 | 911 | 735 | 104 | 72 |
| Washington | 204 | 102 | 63 | 34 | 3 | 2 | 102 | 86 | 9 | 7 |
| Oregon | 149 | 63 | 37 | 23 | 1 | 2 | 86 | 69 | 11 | 6 |
| California | 1,212 | 489 | 270 | 165 | 49 | 5 | 723 | 580 | 84 | 59 |
| Outlying areas | 351 | 176 | 107 | 45 | 22 | 2 | 175 | 164 | 8 | 3 |
| Alaska | 53 | 28 | 19 | 3 | 5 | 1 | 25 | 25 | 0 | 0 |
| Hawaii | 56 | 10 | 8 | 0 | 1 | 1 | 46 | 45 | 1 | 0 |
| Puerto Rico | 242 | 138 | 80 | 42 | 16 | 0 | 104 | 94 | 7 | 3 |
| Canada | 0 | 0 | 0 | 0 | 0 | 0 | 0 | 0 | 0 | 0 |
| Virgin Islands | 0 | 0 | 0 | 0 | 0 | 0 | 0 | 0 | 0 | 0 |
- 1 The States are grouped according to the method used by the Bureau of the Census, U. S. Department of Commerce.
- 2 See table 1, footnote 1, for definitions of types of cases.
75 of 75 figures sit in a row or column sum that works out.
Reader’s notes
p. 180. The crop is a full page (printed page 167) holding TWO tables, not one. Transcribed here is only the first, "Table 6.—Geographic Distribution of Unfair Labor Practice and Representation Cases Received, Fiscal Year 1957—Continued" (its column headings are reprinted on this page; the table begins on earlier pages, so the rows above "Pacific" are not in this crop). The lower half of the same crop holds a second, structurally different table, "Table 7.—Disposition of Unfair Labor Practice Cases Closed, Fiscal Year 1957" (stub "Stage of disposition"; a 10-column body under paired Number/Percent headings for All C, CA, CB, CC and CD cases; 10 body rows from "Total number of cases closed" to "After Supreme Court action"; 5 footnotes). It could not be merged into this rectangular grid because its column count and headings differ, and it is not transcribed above — it needs its own crop. The two footnotes listed belong to Table 6; Table 7's five footnotes are the ones printed at the foot of the page. Footnote markers in the Table 6 column headings: the scan renders the raised figure after CA, CB, CC, CD, RC, RM and RD inconsistently (some strokes look like a 3), but only footnotes 1 and 2 exist under the table and footnote 2 is the "types of cases" note, so all seven are transcribed as ^2. All rows cross-foot exactly as printed (e.g. Pacific 1,565 = 654 + 911, and its three States sum to each Pacific entry; Outlying areas 351 = 176 + 175, and its five entries sum likewise), so no misprints are suspected in the transcribed table.
Source image
Source data: U.S. NLRB Annual Reports (public domain). Reconstruction by NLRB Stats Archive. Read by claude-opus-5 (effort max, prompt extract_v1) from the 300-dpi scan; stitched by page. Updated October 2026.