NLRB Stats Archive › Annual Reports › FY1956 › Geographic Distribution of Collective-Bargaining Elections, Fiscal Year 1956
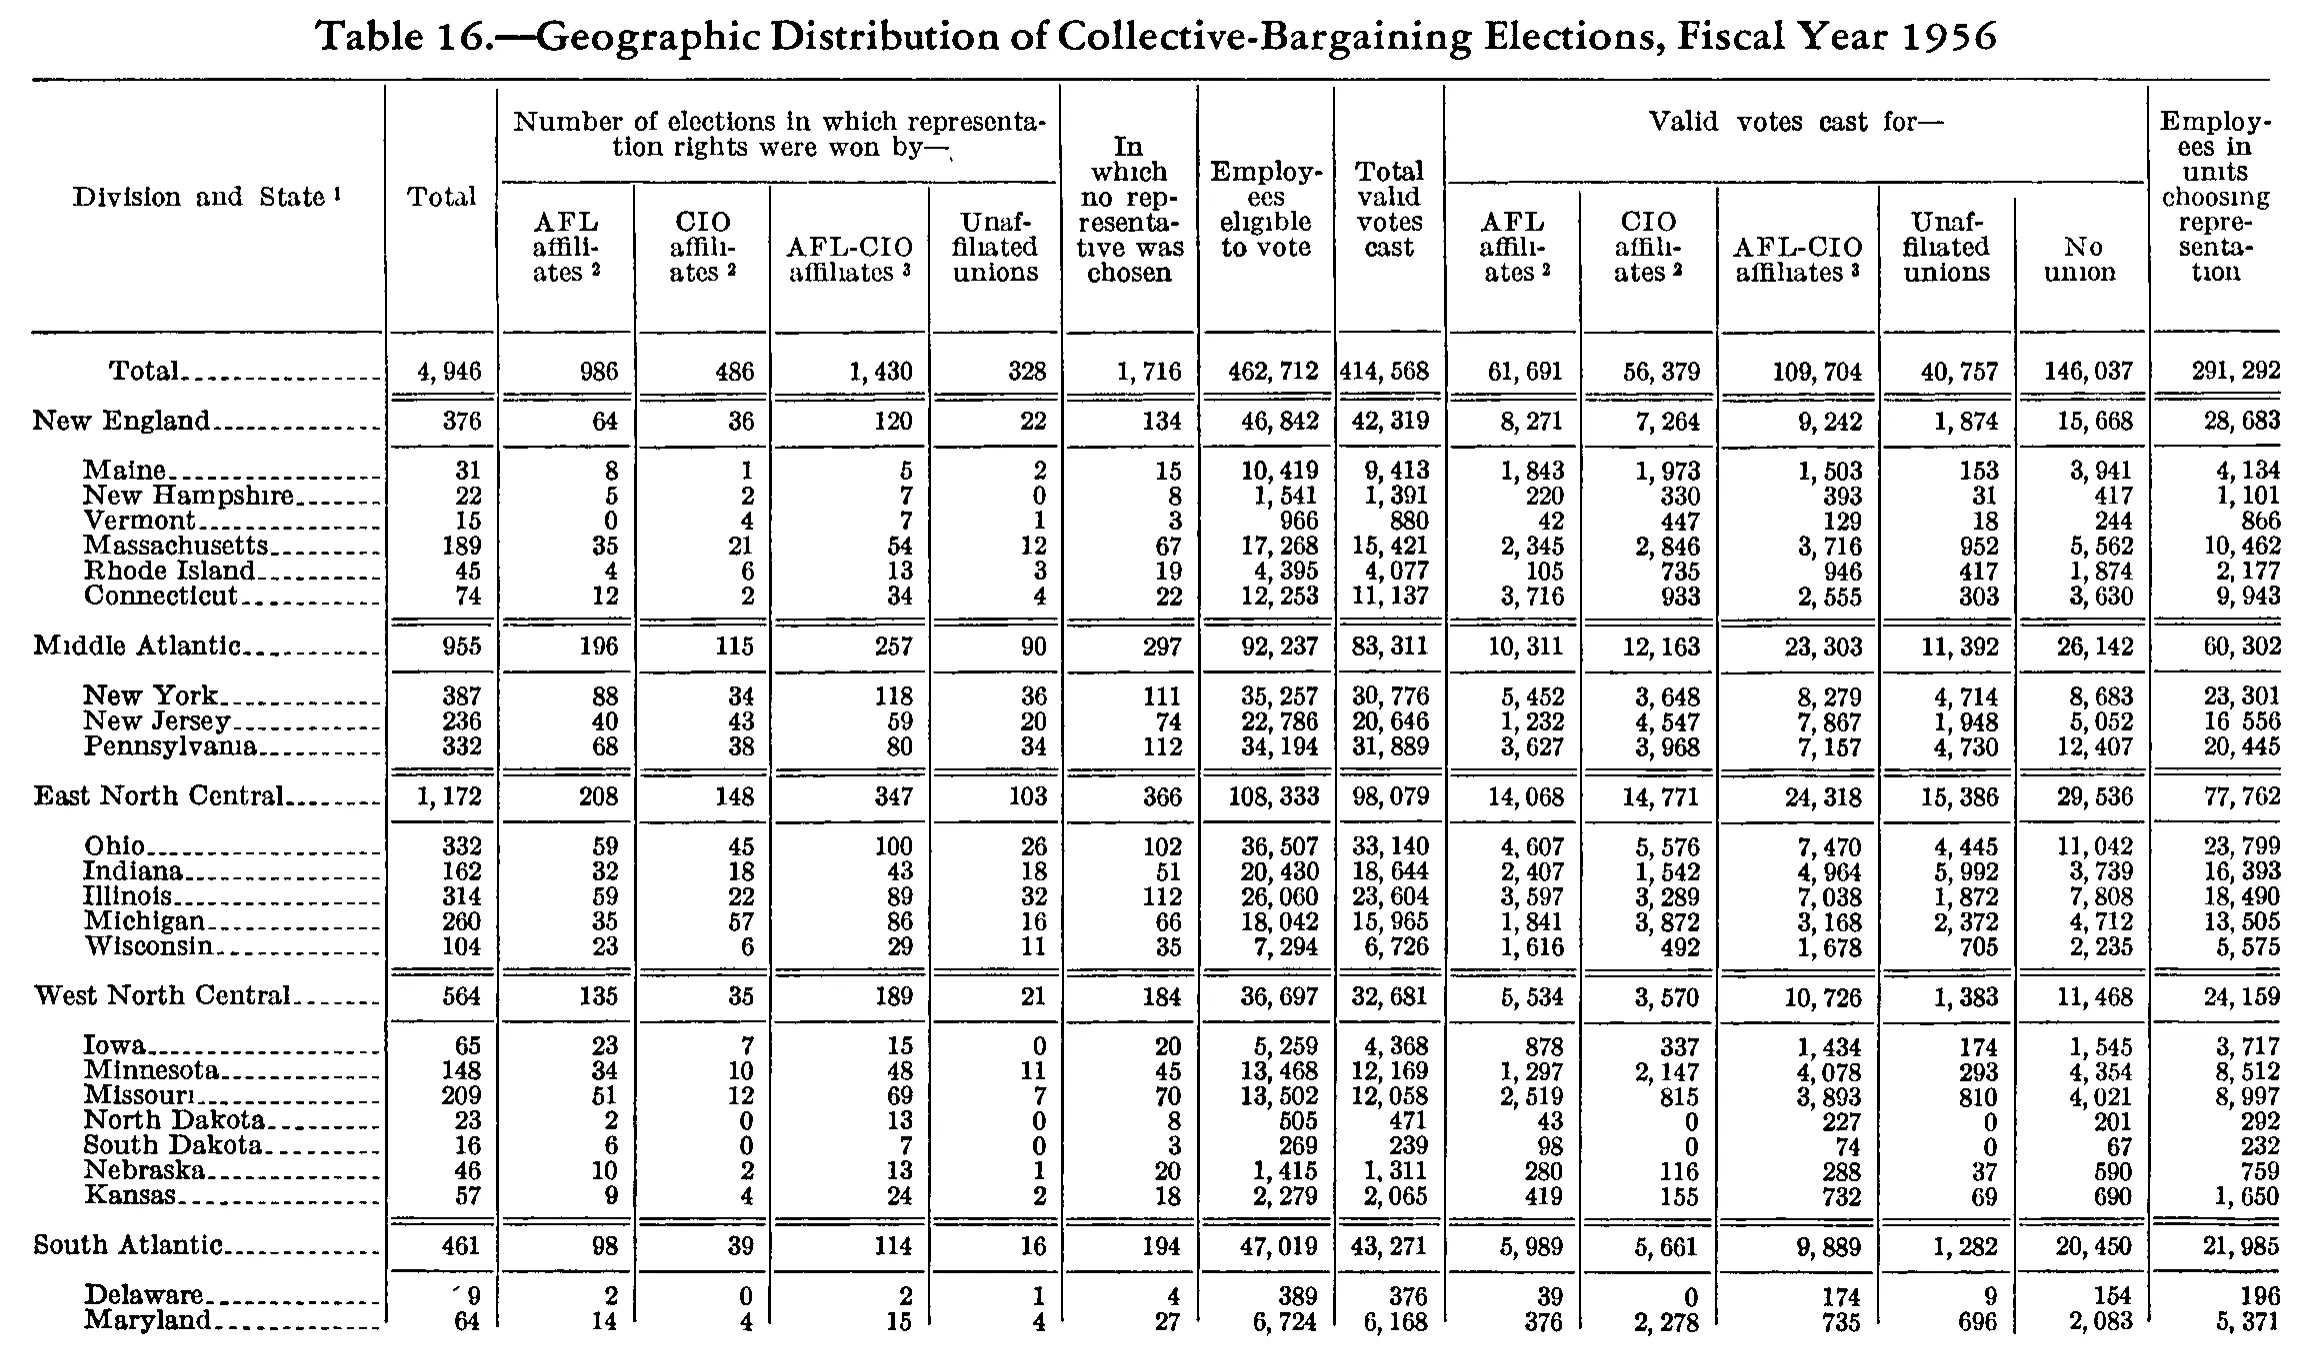
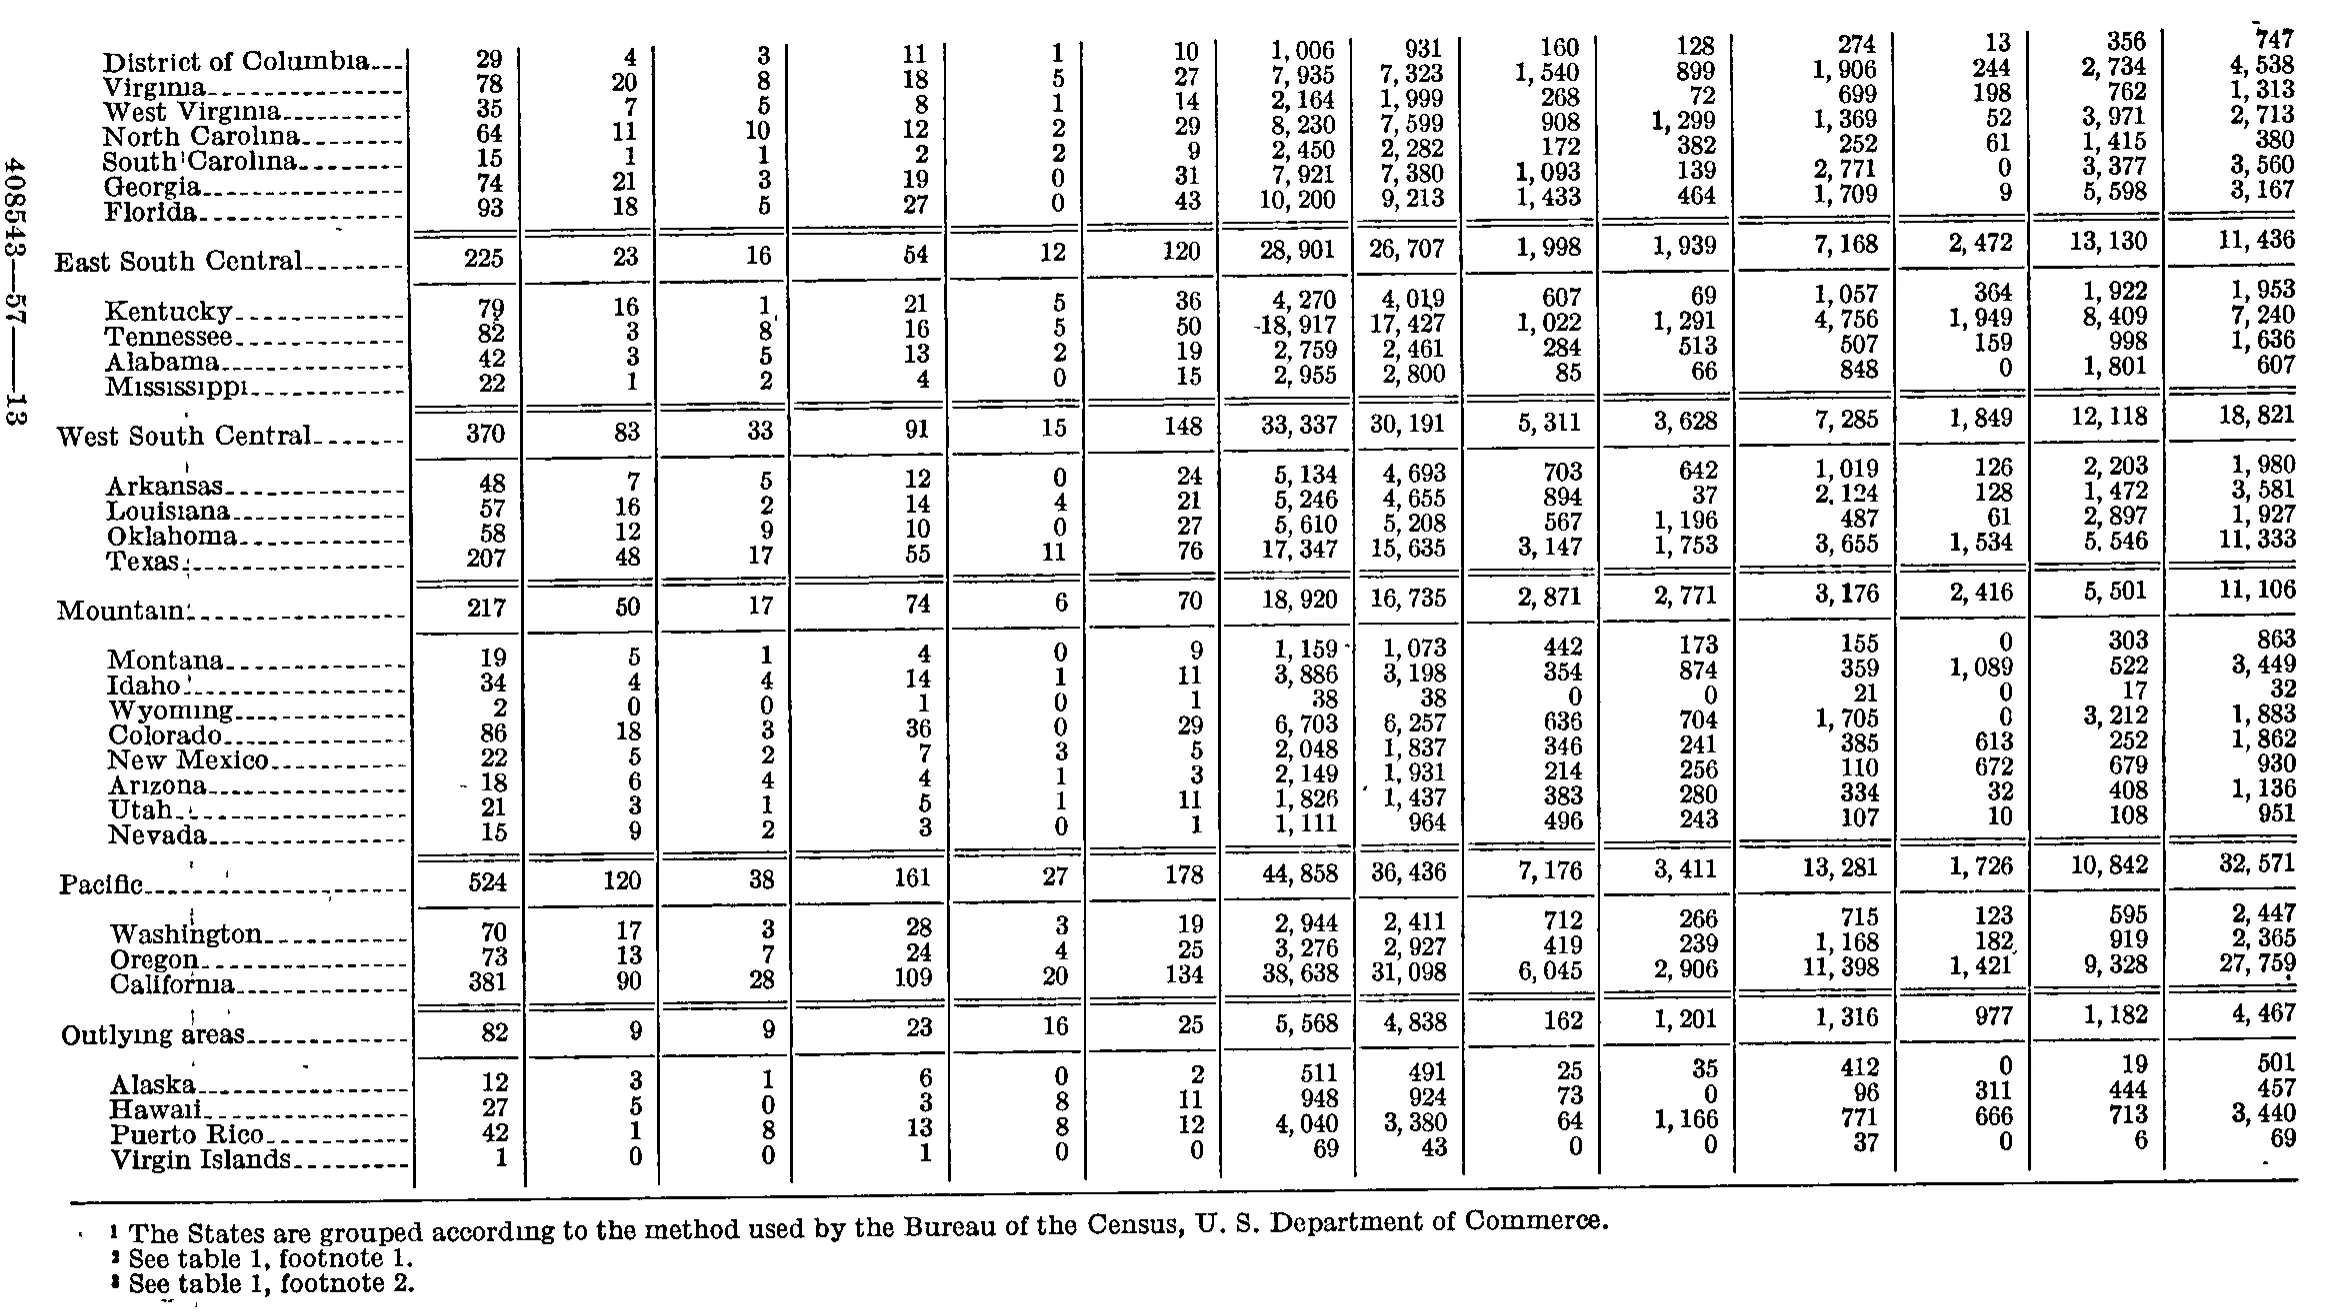
Geographic Distribution of Collective-Bargaining Elections, Fiscal Year 1956
Stitched from pp. 193–194.
| Division and State | Total | Number of elections in which representation rights were won by— | In which no representative was chosen | Employees eligible to vote | Total valid votes cast | Valid votes cast for— | Employees in units choosing representation | |||||||
|---|---|---|---|---|---|---|---|---|---|---|---|---|---|---|
| Division and State | Total | AFL affiliates | CIO affiliates | AFL-CIO affiliates | Unaffiliated unions | In which no representative was chosen | Employees eligible to vote | Total valid votes cast | AFL affiliates | CIO affiliates | AFL-CIO affiliates | Unaffiliated unions | No union | Employees in units choosing representation |
| Total | 4,946 | 986 | 486 | 1,430 | 328 | 1,716 | 462,712 | 414,568 | 61,691 | 56,379 | 109,704 | 40,757 | 146,037 | 291,292 |
| New England | 376 | 64 | 36 | 120 | 22 | 134 | 46,842 | 42,319 | 8,271 | 7,264 | 9,242 | 1,874 | 15,668 | 28,683 |
| Maine | 31 | 8 | 1 | 5 | 2 | 15 | 10,419 | 9,413 | 1,843 | 1,973 | 1,503 | 153 | 3,941 | 4,134 |
| New Hampshire | 22 | 5 | 2 | 7 | 0 | 8 | 1,541 | 1,391 | 220 | 330 | 393 | 31 | 417 | 1,101 |
| Vermont | 15 | 0 | 4 | 7 | 1 | 3 | 966 | 880 | 42 | 447 | 129 | 18 | 244 | 866 |
| Massachusetts | 189 | 35 | 21 | 54 | 12 | 67 | 17,268 | 15,421 | 2,345 | 2,846 | 3,716 | 952 | 5,562 | 10,462 |
| Rhode Island | 45 | 4 | 6 | 13 | 3 | 19 | 4,395 | 4,077 | 105 | 735 | 946 | 417 | 1,874 | 2,177 |
| Connecticut | 74 | 12 | 2 | 34 | 4 | 22 | 12,253 | 11,137 | 3,716 | 933 | 2,555 | 303 | 3,630 | 9,943 |
| Middle Atlantic | 955 | 196 | 115 | 257 | 90 | 297 | 92,237 | 83,311 | 10,311 | 12,163 | 23,303 | 11,392 | 26,142 | 60,302 |
| New York | 387 | 88 | 34 | 118 | 36 | 111 | 35,257 | 30,776 | 5,452 | 3,648 | 8,279 | 4,714 | 8,683 | 23,301 |
| New Jersey | 236 | 40 | 43 | 59 | 20 | 74 | 22,786 | 20,646 | 1,232 | 4,547 | 7,867 | 1,948 | 5,052 | 16,556 |
| Pennsylvania | 332 | 68 | 38 | 80 | 34 | 112 | 34,194 | 31,889 | 3,627 | 3,968 | 7,157 | 4,730 | 12,407 | 20,445 |
| East North Central | 1,172 | 208 | 148 | 347 | 103 | 366 | 108,333 | 98,079 | 14,068 | 14,771 | 24,318 | 15,386 | 29,536 | 77,762 |
| Ohio | 332 | 59 | 45 | 100 | 26 | 102 | 36,507 | 33,140 | 4,607 | 5,576 | 7,470 | 4,445 | 11,042 | 23,799 |
| Indiana | 162 | 32 | 18 | 43 | 18 | 51 | 20,430 | 18,644 | 2,407 | 1,542 | 4,964 | 5,992 | 3,739 | 16,393 |
| Illinois | 314 | 59 | 22 | 89 | 32 | 112 | 26,060 | 23,604 | 3,597 | 3,289 | 7,038 | 1,872 | 7,808 | 18,490 |
| Michigan | 260 | 35 | 57 | 86 | 16 | 66 | 18,042 | 15,965 | 1,841 | 3,872 | 3,168 | 2,372 | 4,712 | 13,505 |
| Wisconsin | 104 | 23 | 6 | 29 | 11 | 35 | 7,294 | 6,726 | 1,616 | 492 | 1,678 | 705 | 2,235 | 5,575 |
| West North Central | 564 | 135 | 35 | 189 | 21 | 184 | 36,697 | 32,681 | 5,534 | 3,570 | 10,726 | 1,383 | 11,468 | 24,159 |
| Iowa | 65 | 23 | 7 | 15 | 0 | 20 | 5,259 | 4,368 | 878 | 337 | 1,434 | 174 | 1,545 | 3,717 |
| Minnesota | 148 | 34 | 10 | 48 | 11 | 45 | 13,468 | 12,169 | 1,297 | 2,147 | 4,078 | 293 | 4,354 | 8,512 |
| Missouri | 209 | 51 | 12 | 69 | 7 | 70 | 13,502 | 12,058 | 2,519 | 815 | 3,893 | 810 | 4,021 | 8,997 |
| North Dakota | 23 | 2 | 0 | 13 | 0 | 8 | 505 | 471 | 43 | 0 | 227 | 0 | 201 | 292 |
| South Dakota | 16 | 6 | 0 | 7 | 0 | 3 | 269 | 239 | 98 | 0 | 74 | 0 | 67 | 232 |
| Nebraska | 46 | 10 | 2 | 13 | 1 | 20 | 1,415 | 1,311 | 280 | 116 | 288 | 37 | 590 | 759 |
| Kansas | 57 | 9 | 4 | 24 | 2 | 18 | 2,279 | 2,065 | 419 | 155 | 732 | 69 | 690 | 1,650 |
| South Atlantic | 461 | 98 | 39 | 114 | 16 | 194 | 47,019 | 43,271 | 5,989 | 5,661 | 9,889 | 1,282 | 20,450 | 21,985 |
| Delaware | 9 | 2 | 0 | 2 | 1 | 4 | 389 | 376 | 39 | 0 | 174 | 9 | 154 | 196 |
| Maryland | 64 | 14 | 4 | 15 | 4 | 27 | 6,724 | 6,168 | 376 | 2,278 | 735 | 696 | 2,083 | 5,371 |
| District of Columbia | 29 | 4 | 3 | 11 | 1 | 10 | 1,006 | 931 | 160 | 128 | 274 | 13 | 356 | 747 |
| Virginia | 78 | 20 | 8 | 18 | 5 | 27 | 7,935 | 7,323 | 1,540 | 899 | 1,906 | 244 | 2,734 | 4,538 |
| West Virginia | 35 | 7 | 5 | 8 | 1 | 14 | 2,164 | 1,999 | 268 | 72 | 699 | 198 | 762 | 1,313 |
| North Carolina | 64 | 11 | 10 | 12 | 2 | 29 | 8,230 | 7,599 | 908 | 1,299 | 1,369 | 52 | 3,971 | 2,713 |
| South Carolina | 15 | 1 | 1 | 2 | 2 | 9 | 2,450 | 2,282 | 172 | 382 | 252 | 61 | 1,415 | 380 |
| Georgia | 74 | 21 | 3 | 19 | 0 | 31 | 7,921 | 7,380 | 1,093 | 139 | 2,771 | 0 | 3,377 | 3,560 |
| Florida | 93 | 18 | 5 | 27 | 0 | 43 | 10,200 | 9,213 | 1,433 | 464 | 1,709 | 9 | 5,598 | 3,167 |
| East South Central | 225 | 23 | 16 | 54 | 12 | 120 | 28,901 | 26,707 | 1,998 | 1,939 | 7,168 | 2,472 | 13,130 | 11,436 |
| Kentucky | 79 | 16 | 1 | 21 | 5 | 36 | 4,270 | 4,019 | 607 | 69 | 1,057 | 364 | 1,922 | 1,953 |
| Tennessee | 82 | 3 | 8 | 16 | 5 | 50 | 18,917 | 17,427 | 1,022 | 1,291 | 4,756 | 1,949 | 8,409 | 7,240 |
| Alabama | 42 | 3 | 5 | 13 | 2 | 19 | 2,759 | 2,461 | 284 | 513 | 507 | 159 | 998 | 1,636 |
| Mississippi | 22 | 1 | 2 | 4 | 0 | 15 | 2,955 | 2,800 | 85 | 66 | 848 | 0 | 1,801 | 607 |
| West South Central | 370 | 83 | 33 | 91 | 15 | 148 | 33,337 | 30,191 | 5,311 | 3,628 | 7,285 | 1,849 | 12,118 | 18,821 |
| Arkansas | 48 | 7 | 5 | 12 | 0 | 24 | 5,134 | 4,693 | 703 | 642 | 1,019 | 126 | 2,203 | 1,980 |
| Louisiana | 57 | 16 | 2 | 14 | 4 | 21 | 5,246 | 4,655 | 894 | 37 | 2,124 | 128 | 1,472 | 3,581 |
| Oklahoma | 58 | 12 | 9 | 10 | 0 | 27 | 5,610 | 5,208 | 567 | 1,196 | 487 | 61 | 2,897 | 1,927 |
| Texas | 207 | 48 | 17 | 55 | 11 | 76 | 17,347 | 15,635 | 3,147 | 1,753 | 3,655 | 1,534 | 5,546 | 11,333 |
| Mountain | 217 | 50 | 17 | 74 | 6 | 70 | 18,920 | 16,735 | 2,871 | 2,771 | 3,176 | 2,416 | 5,501 | 11,106 |
| Montana | 19 | 5 | 1 | 4 | 0 | 9 | 1,159 | 1,073 | 442 | 173 | 155 | 0 | 303 | 863 |
| Idaho | 34 | 4 | 4 | 14 | 1 | 11 | 3,886 | 3,198 | 354 | 874 | 359 | 1,089 | 522 | 3,449 |
| Wyoming | 2 | 0 | 0 | 1 | 0 | 1 | 38 | 38 | 0 | 0 | 21 | 0 | 17 | 32 |
| Colorado | 86 | 18 | 3 | 36 | 0 | 29 | 6,703 | 6,257 | 636 | 704 | 1,705 | 0 | 3,212 | 1,883 |
| New Mexico | 22 | 5 | 2 | 7 | 3 | 5 | 2,048 | 1,837 | 346 | 241 | 385 | 613 | 252 | 1,862 |
| Arizona | 18 | 6 | 4 | 4 | 1 | 3 | 2,149 | 1,931 | 214 | 256 | 110 | 672 | 679 | 930 |
| Utah | 21 | 3 | 1 | 5 | 1 | 11 | 1,826 | 1,437 | 383 | 280 | 334 | 32 | 408 | 1,136 |
| Nevada | 15 | 9 | 2 | 3 | 0 | 1 | 1,111 | 964 | 496 | 243 | 107 | 10 | 108 | 951 |
| Pacific | 524 | 120 | 38 | 161 | 27 | 178 | 44,858 | 36,436 | 7,176 | 3,411 | 13,281 | 1,726 | 10,842 | 32,571 |
| Washington | 70 | 17 | 3 | 28 | 3 | 19 | 2,944 | 2,411 | 712 | 266 | 715 | 123 | 595 | 2,447 |
| Oregon | 73 | 13 | 7 | 24 | 4 | 25 | 3,276 | 2,927 | 419 | 239 | 1,168 | 182 | 919 | 2,365 |
| California | 381 | 90 | 28 | 109 | 20 | 134 | 38,638 | 31,098 | 6,045 | 2,906 | 11,398 | 1,421 | 9,328 | 27,759 |
| Outlying areas | 82 | 9 | 9 | 23 | 16 | 25 | 5,568 | 4,838 | 162 | 1,201 | 1,316 | 977 | 1,182 | 4,467 |
| Alaska | 12 | 3 | 1 | 6 | 0 | 2 | 511 | 491 | 25 | 35 | 412 | 0 | 19 | 501 |
| Hawaii | 27 | 5 | 0 | 3 | 8 | 11 | 948 | 924 | 73 | 0 | 96 | 311 | 444 | 457 |
| Puerto Rico | 42 | 1 | 8 | 13 | 8 | 12 | 4,040 | 3,380 | 64 | 1,166 | 771 | 666 | 713 | 3,440 |
| Virgin Islands | 1 | 0 | 0 | 1 | 0 | 0 | 69 | 43 | 0 | 0 | 37 | 0 | 6 | 69 |
- 1 The States are grouped according to the method used by the Bureau of the Census, U. S. Department of Commerce.
- 2 See table 1, footnote 1.
- 3 See table 1, footnote 2.
854 of 854 figures sit in a row or column sum that works out.
Reader’s notes
p. 193. The crop is cut off at the bottom: the Maryland row is the last one visible (its baseline is clipped), and the rest of the South Atlantic division and all later divisions continue on the page/image beyond this crop. The footnote texts for markers 1, 2 and 3 (on "Division and State", "AFL affiliates", "CIO affiliates" and "AFL-CIO affiliates") are not printed within the crop, so `footnotes` is empty. Doubtful cells: (1) New Jersey, "Employees in units choosing representation" is printed as "16 556" with no visible digit-grouping comma (apparently a dropped or failed-to-print comma); transcribed as 16,556 with the digits unchanged. (2) Delaware, "Total" column has a small stray apostrophe-like mark immediately before the 9 ("´9"); it matches no footnote marker in this table and the row's components (2+0+2+1+4) sum to 9, so it is transcribed as plain 9. The AFL/CIO/AFL-CIO column pairs are easy to confuse; column assignments were read off the vertical rules. No arithmetic was checked or corrected; values are as printed.
p. 194. The grid has 15 columns (stub + 14 numeric). No column headings are printed on this crop: it is the continuation of a table begun on the previous page, so the heading block, the national total, and the earlier regions (New England through the start of South Atlantic, including Delaware and Maryland) lie above the crop. The first seven rows (District of Columbia through Florida) are the tail of the South Atlantic group, whose subtotal line is not on this image. Row/column alignment was checked arithmetically and every check passes: in each row columns 9-13 sum exactly to column 8 (e.g. District of Columbia 160+128+274+13+356 = 931; California 6,045+2,906+11,398+1,421+9,328 = 31,098), and each region row (East South Central, West South Central, Mountain, Pacific, Outlying areas) equals the sum of the states printed beneath it in all 14 numeric columns. Note the layout puts each region's subtotal line ABOVE its member States, not below. The scan is slightly skewed, so the right-hand columns ride upward relative to the row label on the left. Most visibly, "747" sits near the top edge of the crop, above the District of Columbia label; it is the District of Columbia value of the last column, not a separate cut-off row. Confirmed two ways: the last column of every other block maps one-to-one onto its rows and sums to the region subtotal, and the alternative alignment would give District of Columbia a last-column value of 4,538 against only 1,006 in column 7. Doubtful or damaged cells, all resolved by the sum checks: Tennessee, column 7 prints a stray dash before the figure ("-18, 917"); transcribed as 18,917, which is what the East South Central total of 28,901 requires. Texas, last column prints the thousands separator as a period ("11. 333"); transcribed as 11,333, required by the West South Central total of 18,821. Kentucky column 3 ("1") and Tennessee column 3 ("8") each carry a stray tick mark; confirmed by the subtotal 16. Montana column 7 and Arizona column 10 have adjacent specks that are not part of the figures. A stray dot sits in the last column just below the Virgin Islands line; it is not a value, and the Virgin Islands figure of 69 is required by the Outlying areas total of 4,467. The markers of the second and third footnotes are blurred (they read roughly like "3" and "8"/"1" in the scan); from the sequence and content they are 2 and 3, and are transcribed that way. The vertical string "408543-57--13" in the left margin is the printer's signature mark, not table content.
Source image
Source data: U.S. NLRB Annual Reports (public domain). Reconstruction by NLRB Stats Archive. Read by claude-opus-5 (effort max, prompt extract_v1) from the 300-dpi scan; stitched by page. Updated October 2026.