NLRB Stats Archive › Annual Reports › FY1956 › Size of Units in Collective-Bargaining and Decertification Elections, Fiscal Year 1956 A. COLLECTIVE-BARGAINING ELECTIONS Number Percent
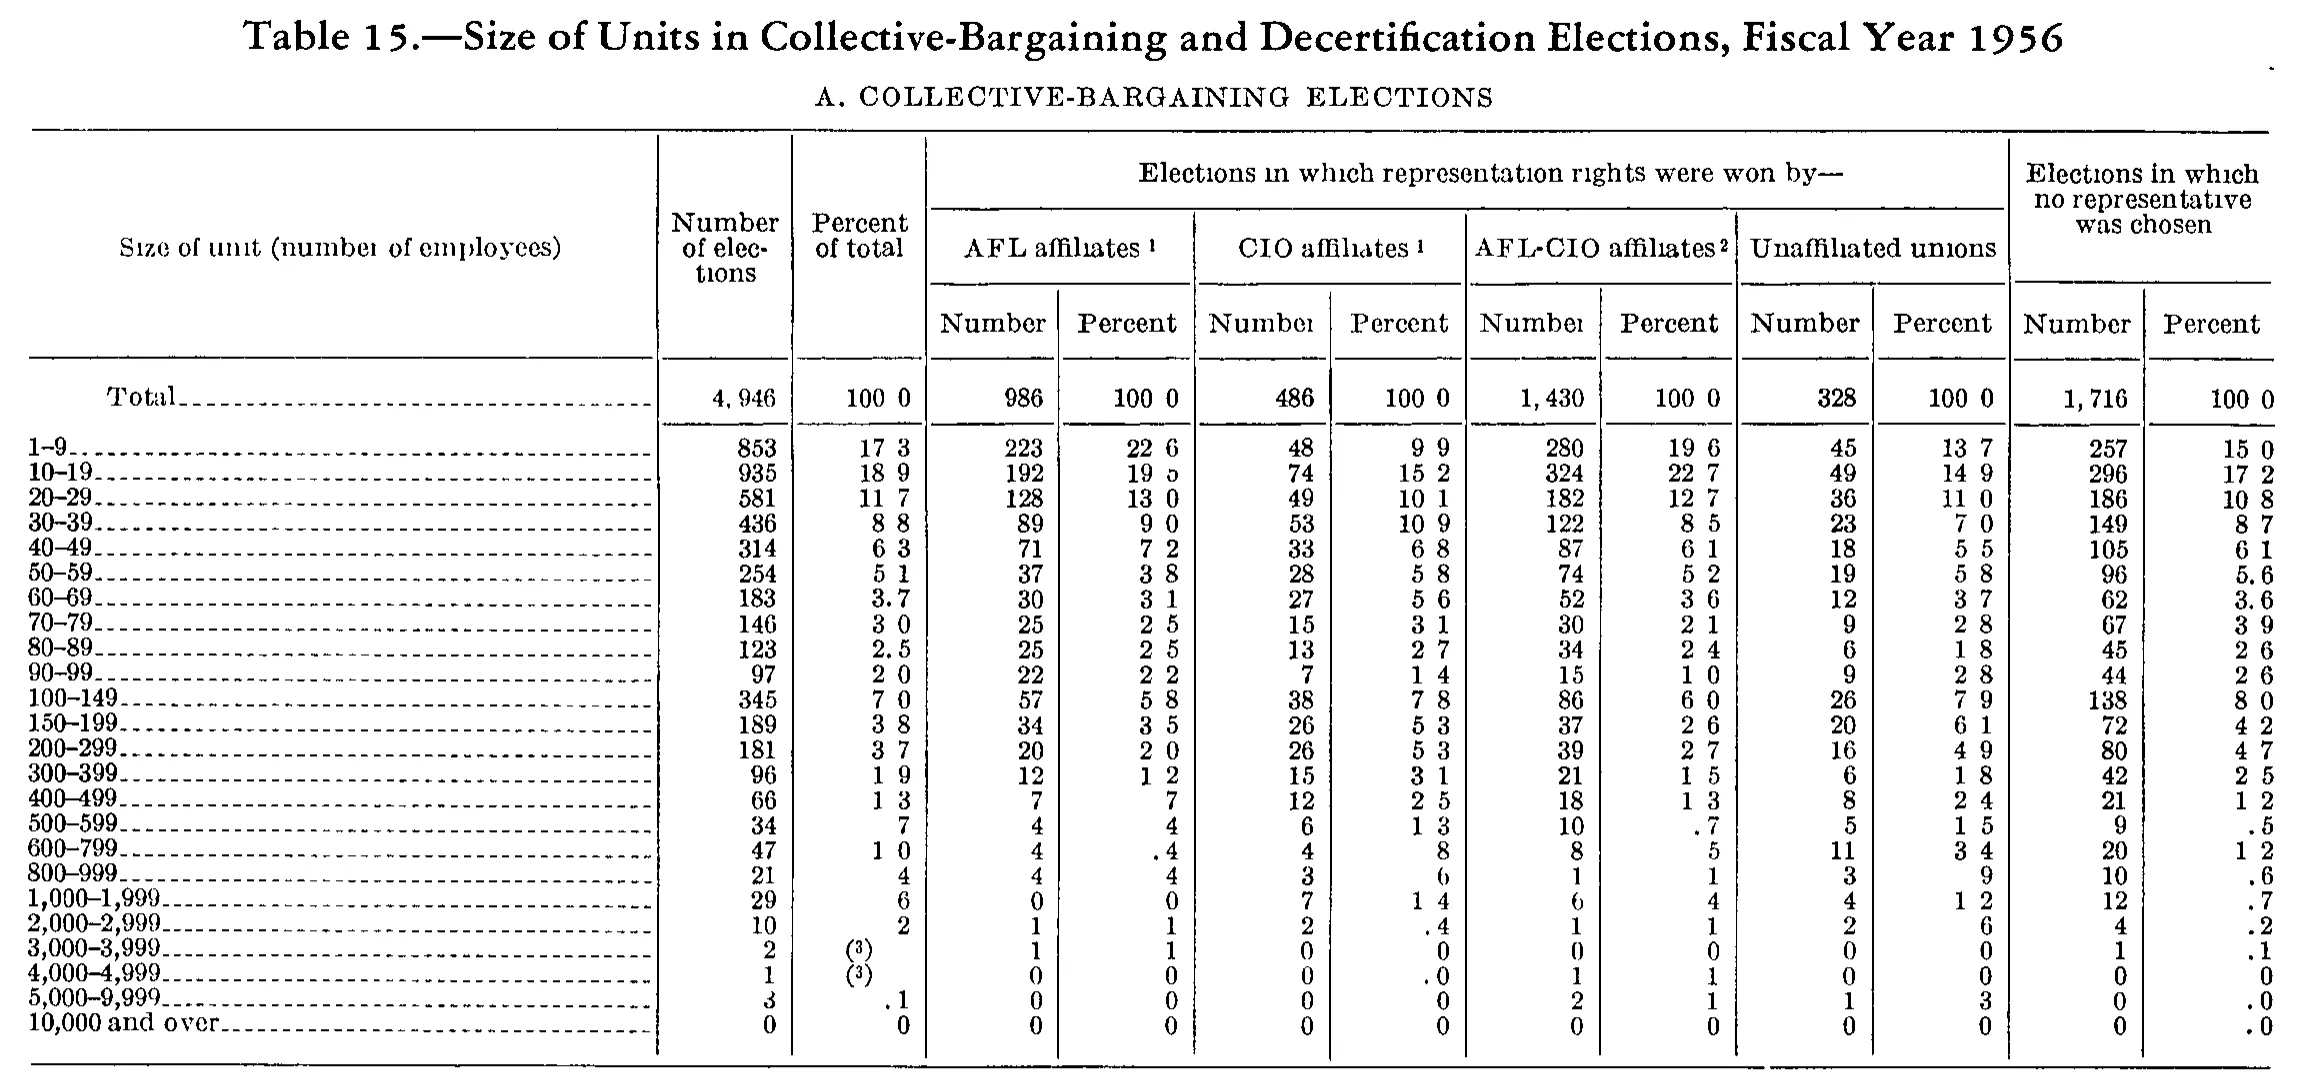
Size of Units in Collective-Bargaining and Decertification Elections, Fiscal Year 1956 A. COLLECTIVE-BARGAINING ELECTIONS Number Percent
Stitched from pp. 191–192.
| Size of unit (number of employees) | Number of elections | Percent of total | Elections in which representation rights were won by— | Elections in which no representative was chosen | ||||||||
|---|---|---|---|---|---|---|---|---|---|---|---|---|
| Size of unit (number of employees) | Number of elections | Percent of total | AFL affiliates | CIO affiliates | AFL-CIO affiliates | Unaffiliated unions | Elections in which no representative was chosen | |||||
| Size of unit (number of employees) | Number of elections | Percent of total | Number | Percent | Number | Percent | Number | Percent | Number | Percent | Number | Percent |
| Total | 4,946 | 100.0 | 986 | 100.0 | 486 | 100.0 | 1,430 | 100.0 | 328 | 100.0 | 1,716 | 100.0 |
| 1-9 | 853 | 17.3 | 223 | 22.6 | 48 | 9.9 | 280 | 19.6 | 45 | 13.7 | 257 | 15.0 |
| 10-19 | 935 | 18.9 | 192 | 19.5 | 74 | 15.2 | 324 | 22.7 | 49 | 14.9 | 296 | 17.2 |
| 20-29 | 581 | 11.7 | 128 | 13.0 | 49 | 10.1 | 182 | 12.7 | 36 | 11.0 | 186 | 10.8 |
| 30-39 | 436 | 8.8 | 89 | 9.0 | 53 | 10.9 | 122 | 8.5 | 23 | 7.0 | 149 | 8.7 |
| 40-49 | 314 | 6.3 | 71 | 7.2 | 33 | 6.8 | 87 | 6.1 | 18 | 5.5 | 105 | 6.1 |
| 50-59 | 254 | 5.1 | 37 | 3.8 | 28 | 5.8 | 74 | 5.2 | 19 | 5.8 | 96 | 5.6 |
| 60-69 | 183 | 3.7 | 30 | 3.1 | 27 | 5.6 | 52 | 3.6 | 12 | 3.7 | 62 | 3.6 |
| 70-79 | 146 | 3.0 | 25 | 2.5 | 15 | 3.1 | 30 | 2.1 | 9 | 2.8 | 67 | 3.9 |
| 80-89 | 123 | 2.5 | 25 | 2.5 | 13 | 2.7 | 34 | 2.4 | 6 | 1.8 | 45 | 2.6 |
| 90-99 | 97 | 2.0 | 22 | 2.2 | 7 | 1.4 | 15 | 1.0 | 9 | 2.8 | 44 | 2.6 |
| 100-149 | 345 | 7.0 | 57 | 5.8 | 38 | 7.8 | 86 | 6.0 | 26 | 7.9 | 138 | 8.0 |
| 150-199 | 189 | 3.8 | 34 | 3.5 | 26 | 5.3 | 37 | 2.6 | 20 | 6.1 | 72 | 4.2 |
| 200-299 | 181 | 3.7 | 20 | 2.0 | 26 | 5.3 | 39 | 2.7 | 16 | 4.9 | 80 | 4.7 |
| 300-399 | 96 | 1.9 | 12 | 1.2 | 15 | 3.1 | 21 | 1.5 | 6 | 1.8 | 42 | 2.5 |
| 400-499 | 66 | 1.3 | 7 | .7 | 12 | 2.5 | 18 | 1.3 | 8 | 2.4 | 21 | 1.2 |
| 500-599 | 34 | .7 | 4 | .4 | 6 | 1.3 | 10 | .7 | 5 | 1.5 | 9 | .5 |
| 600-799 | 47 | 1.0 | 4 | .4 | 4 | .8 | 8 | .5 | 11 | 3.4 | 20 | 1.2 |
| 800-999 | 21 | .4 | 4 | .4 | 3 | .6 | 1 | .1 | 3 | .9 | 10 | .6 |
| 1,000-1,999 | 29 | .6 | 0 | 0 | 7 | 1.4 | 6 | .4 | 4 | 1.2 | 12 | .7 |
| 2,000-2,999 | 10 | .2 | 1 | .1 | 2 | .4 | 1 | .1 | 2 | .6 | 4 | .2 |
| 3,000-3,999 | 2 | [3] | 1 | .1 | 0 | .0 | 0 | 0 | 0 | 0 | 1 | .1 |
| 4,000-4,999 | 1 | [3] | 0 | 0 | 0 | .0 | 1 | .1 | 0 | 0 | 0 | .0 |
| 5,000-9,999 | 3 | .1 | 0 | 0 | 0 | .0 | 2 | .1 | 1 | .3 | 0 | .0 |
| 10,000 and over | 0 | 0 | 0 | 0 | 0 | 0 | 0 | 0 | 0 | 0 | 0 | .0 |
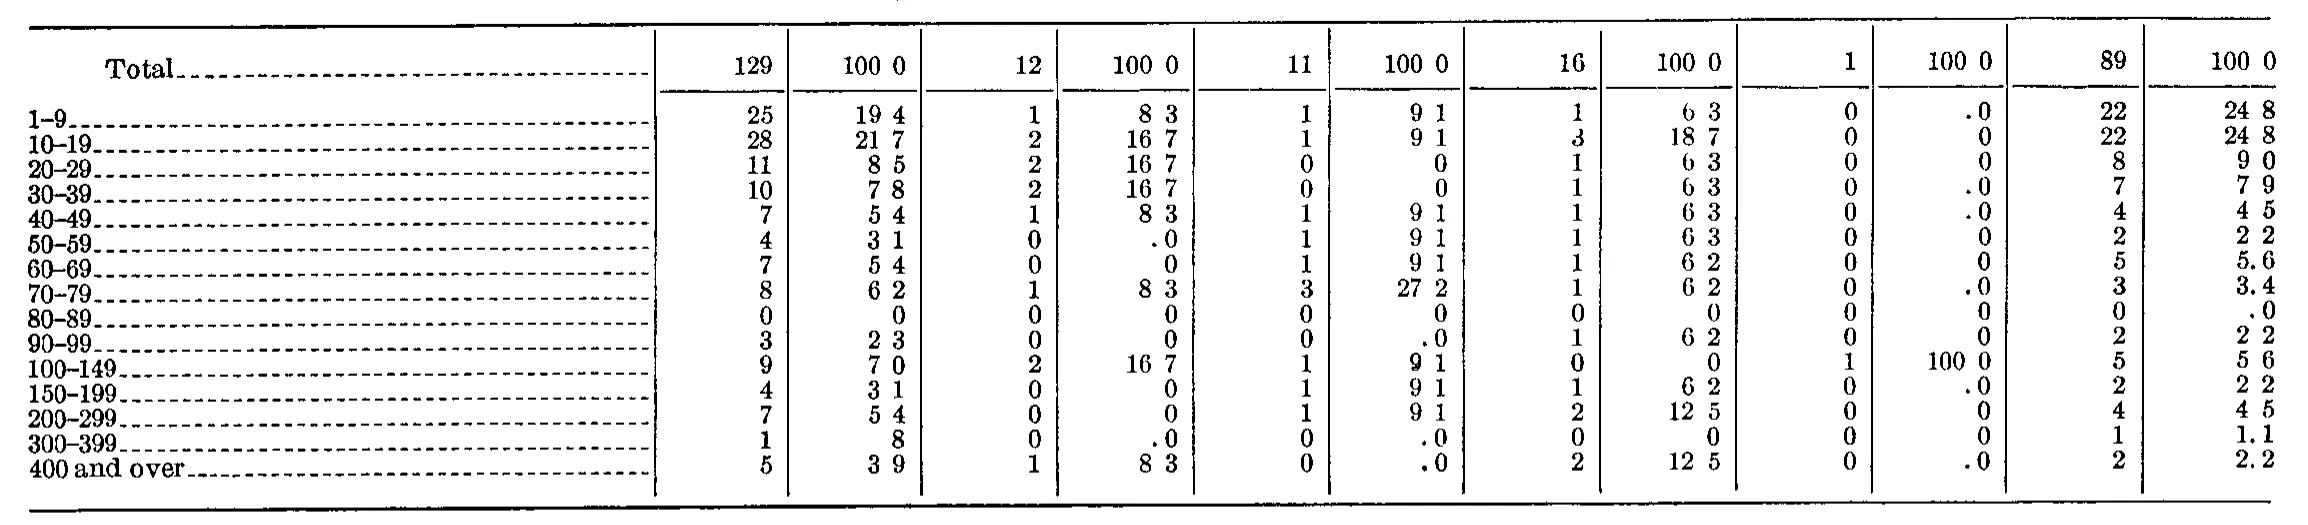
| Total | 129 | 100.0 | 12 | 100.0 | 11 | 100.0 | 16 | 100.0 | 1 | 100.0 | 89 | 100.0 |
| 1-9 | 25 | 19.4 | 1 | 8.3 | 1 | 9.1 | 1 | 6.3 | 0 | .0 | 22 | 24.8 |
| 10-19 | 28 | 21.7 | 2 | 16.7 | 1 | 9.1 | 3 | 18.7 | 0 | .0 | 22 | 24.8 |
| 20-29 | 11 | 8.5 | 2 | 16.7 | 0 | .0 | 1 | 6.3 | 0 | .0 | 8 | 9.0 |
| 30-39 | 10 | 7.8 | 2 | 16.7 | 0 | .0 | 1 | 6.3 | 0 | .0 | 7 | 7.9 |
| 40-49 | 7 | 5.4 | 1 | 8.3 | 1 | 9.1 | 1 | 6.3 | 0 | .0 | 4 | 4.5 |
| 50-59 | 4 | 3.1 | 0 | .0 | 1 | 9.1 | 1 | 6.3 | 0 | .0 | 2 | 2.2 |
| 60-69 | 7 | 5.4 | 0 | .0 | 1 | 9.1 | 1 | 6.2 | 0 | .0 | 5 | 5.6 |
| 70-79 | 8 | 6.2 | 1 | 8.3 | 3 | 27.2 | 1 | 6.2 | 0 | .0 | 3 | 3.4 |
| 80-89 | 0 | .0 | 0 | .0 | 0 | .0 | 0 | .0 | 0 | .0 | 0 | .0 |
| 90-99 | 3 | 2.3 | 0 | .0 | 0 | .0 | 1 | 6.2 | 0 | .0 | 2 | 2.2 |
| 100-149 | 9 | 7.0 | 2 | 16.7 | 1 | 9.1 | 0 | .0 | 1 | 100.0 | 5 | 5.6 |
| 150-199 | 4 | 3.1 | 0 | .0 | 1 | 9.1 | 1 | 6.2 | 0 | .0 | 2 | 2.2 |
| 200-299 | 7 | 5.4 | 0 | .0 | 1 | 9.1 | 2 | 12.5 | 0 | .0 | 4 | 4.5 |
| 300-399 | 1 | .8 | 0 | .0 | 0 | .0 | 0 | .0 | 0 | .0 | 1 | 1.1 |
| 400 and over | 5 | 3.9 | 1 | 8.3 | 0 | .0 | 2 | 12.5 | 0 | .0 | 2 | 2.2 |
197 of 197 figures sit in a row or column sum that works out.
Reader’s notes
p. 191. Panel subtitle: the line "A. COLLECTIVE-BARGAINING ELECTIONS" is printed centred between the caption and the top rule, above the column headings; it is treated as part of the caption and left out of the grid. The crop therefore shows only panel A of Table 15 (panel B, decertification elections, is not on this image). Footnote texts: markers 1 (AFL affiliates, CIO affiliates), 2 (AFL-CIO affiliates) and 3 (the two "(3)" cells) are printed, but no footnote text appears below the table in this crop, so `footnotes` is empty. "(3)" cells: in the "Percent of total" column for rows 3,000-3,999 and 4,000-4,999 the cell holds only a raised 3 in parentheses (a footnote reference standing in place of a value, conventionally "less than 0.05 percent"); transcribed as "(3)". Decimal points: this 1-bit scan drops most decimal points in the percent columns, so values print as a digit gap ("100 0", "17 3"). Where the gap is unambiguous I have restored the point ("100.0", "17.3"), and where a lone fractional digit is right-aligned in a percent column I have restored the leading point (".7", ".4", ".6"); the same columns show the point rendered in other rows (3.7, 2.5, .4, .7, .5), confirming it is printed. Zero cells are transcribed as they render, which is inconsistent in the scan: "0" in most columns but ".0" in the rightmost percent column and in the CIO percent column for rows 3,000-3,999 through 5,000-9,999. Arithmetic check: every count column sums exactly to its printed total (4,946; 986; 486; 1,430; 328; 1,716), and each row's five count cells sum to the row's number of elections, so the integer columns are well anchored. Doubtful percent cells (transcribed as printed, not corrected): "60-69"/AFL affiliates Percent reads 3.1 where 30/986 gives 3.0; "150-199"/AFL affiliates Percent reads 3.5 where 34/986 gives 3.4; "500-599"/CIO affiliates Percent reads 1.3 where 6/486 gives 1.2; "70-79" and "90-99"/Unaffiliated unions Percent both read 2.8 where 9/328 gives 2.7. These all round one tenth high in the same direction, which looks like the report's own rounding rather than misreads, but the digits are small and faint. "10-19"/AFL affiliates Percent is a degraded glyph read as 19.5 (192/986 = 19.5 supports it).
p. 192. Continuation crop: no column headings are printed on this image, so header_rows is empty. The grid has 13 columns — the stub plus six paired (count, percent) column groups, each pair separated by a column rule; the pairs' totals are 129, 12, 11, 16, 1 and 89. Decimal points: this is a 1-bit scan in which the periods in the percent columns are very faint and are lost outright in many cells (e.g. the total row reads "100 0" and the 1-9 row reads "19 4"). The periods are visibly present in a handful of cells (5.6, 3.4, 1.1, 2.2 in the last column, and several ".0" cells), confirming the typesetting is one decimal place throughout with no leading zero below 1. I have therefore written the decimal point in every percent cell, rendering the lost ones as printed rather than as the scan's broken glyphs: all zero-percent cells are ".0" and the 300-399 figure in the second column is ".8". Arithmetic check (no values were altered to make it pass): every count column sums exactly to its printed total, and every percent column sums exactly to 100.0. Two roundings are slightly off the strict quotient but are as printed and are what make the columns sum to 100.0: 3 of 11 is printed 27.2 (strictly 27.3), and 22 of 89 is printed 24.8 twice (strictly 24.7). Row labels use a short dash between the class limits; transcribed as a hyphen.
Source image
Source data: U.S. NLRB Annual Reports (public domain). Reconstruction by NLRB Stats Archive. Read by claude-opus-5 (effort max, prompt extract_v1) from the 300-dpi scan; stitched by page. Updated October 2026.