NLRB Stats Archive › Annual Reports › FY1955 › Types of Unfair Labor Practices Alleged, Fiscal Year 1955
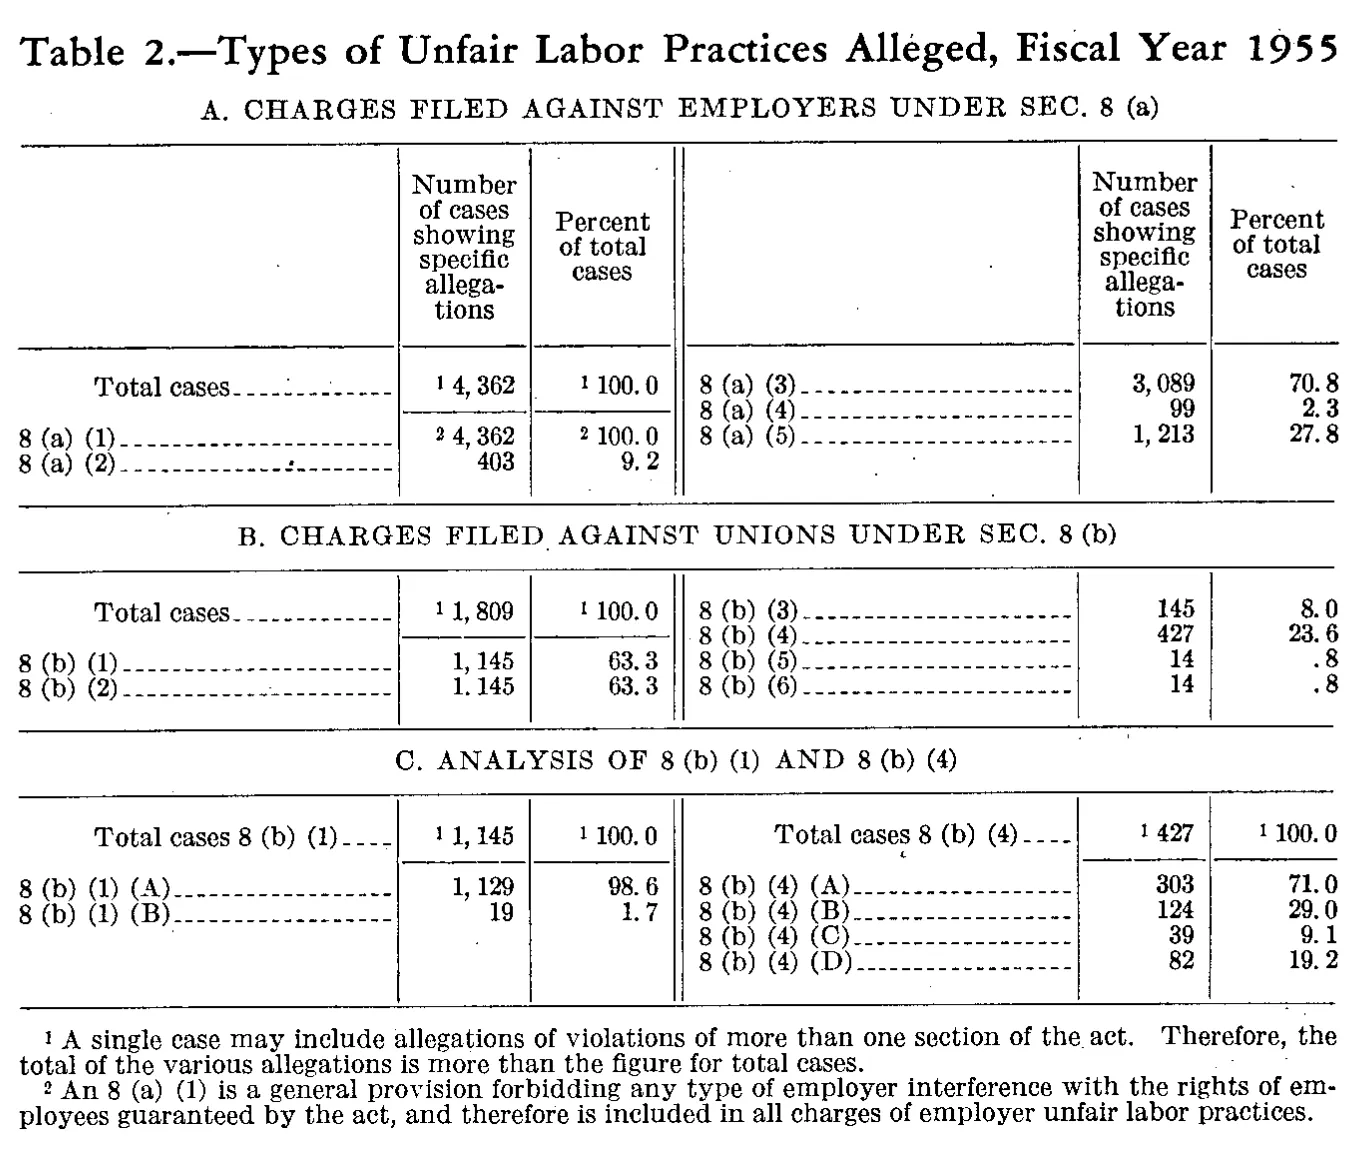
Types of Unfair Labor Practices Alleged, Fiscal Year 1955
| Number of cases showing specific allegations | Percent of total cases | |
|---|---|---|
| A. CHARGES FILED AGAINST EMPLOYERS UNDER SEC. 8 (a) | ||
| Total cases | 4,362 | 100.0 |
| 8 (a) (1) | 4,362 | 100.0 |
| 8 (a) (2) | 403 | 9.2 |
| 8 (a) (3) | 3,089 | 70.8 |
| 8 (a) (4) | 99 | 2.3 |
| 8 (a) (5) | 1,213 | 27.8 |
| B. CHARGES FILED AGAINST UNIONS UNDER SEC. 8 (b) | ||
| Total cases | 1,809 | 100.0 |
| 8 (b) (1) | 1,145 | 63.3 |
| 8 (b) (2) | 1,145 | 63.3 |
| 8 (b) (3) | 145 | 8.0 |
| 8 (b) (4) | 427 | 23.6 |
| 8 (b) (5) | 14 | .8 |
| 8 (b) (6) | 14 | .8 |
| C. ANALYSIS OF 8 (b) (1) AND 8 (b) (4) | ||
| Total cases 8 (b) (1) | 1,145 | 100.0 |
| 8 (b) (1) (A) | 1,129 | 98.6 |
| 8 (b) (1) (B) | 19 | 1.7 |
| Total cases 8 (b) (4) | 427 | 100.0 |
| 8 (b) (4) (A) | 303 | 71.0 |
| 8 (b) (4) (B) | 124 | 29.0 |
| 8 (b) (4) (C) | 39 | 9.1 |
| 8 (b) (4) (D) | 82 | 19.2 |
- 1 A single case may include allegations of violations of more than one section of the act. Therefore, the total of the various allegations is more than the figure for total cases.
- 2 An 8 (a) (1) is a general provision forbidding any type of employer interference with the rights of employees guaranteed by the act, and therefore is included in all charges of employer unfair labor practices.
0 of 21 figures sit in a row or column sum that works out.
Reader’s notes
p. 176. Layout: the table has three stacked sections (A, B, C), and each section is printed as two panels side by side, each panel carrying its own stub plus "Number of cases showing specific allegations" and "Percent of total cases". The column headings are printed only once, in the band at the top of section A, and serve both panels of all three sections; they are given once in header_rows. Following the two-panel rule, within each section the left panel's rows are transcribed first and then the right panel's rows: in A, rows "Total cases" through "8 (a) (2)" are the left panel and "8 (a) (3)"-"8 (a) (5)" the right; in B, "Total cases" through "8 (b) (2)" are the left panel and "8 (b) (3)"-"8 (b) (6)" the right; in C, "Total cases 8 (b) (1)" through "8 (b) (1) (B)" are the left panel and "Total cases 8 (b) (4)" through "8 (b) (4) (D)" the right. The stub column has no printed heading. The centered lines "A. CHARGES FILED AGAINST EMPLOYERS UNDER SEC. 8 (a)", "B. CHARGES FILED AGAINST UNIONS UNDER SEC. 8 (b)" and "C. ANALYSIS OF 8 (b) (1) AND 8 (b) (4)" are printed in caps above each section's top rule (line A sits above the heading band); they are transcribed as label-only section rows in place. Footnote markers 1 and 2 are printed as small raised figures to the LEFT of the values they mark (e.g. "¹ 4,362", "² 100.0"); they have been moved behind a caret after each value. Doubtful/suspect cells: in row "8 (b) (2)", the thousands separator in the Number column prints more like a period than a comma ("1. 145"); it is transcribed as "1,145" to match the typesetting elsewhere in the table. That row also repeats exactly the figures of row "8 (b) (1)" (1,145 and 63.3), which looks like a typesetting duplication in the original; both lines are transcribed as printed and nothing was computed or corrected. All other percentages are internally consistent with the printed totals (4,362 for A, 1,809 for B, 1,145 and 427 for C).
Source image
Source data: U.S. NLRB Annual Reports (public domain). Reconstruction by NLRB Stats Archive. Read by claude-opus-5 (effort max, prompt extract_v1) from the 300-dpi scan; stitched by page. Updated October 2026.