NLRB Stats Archive › Annual Reports › FY1954 › Industrial Distribution of Collective-Bargaining Elections, Fiscal Year 1954
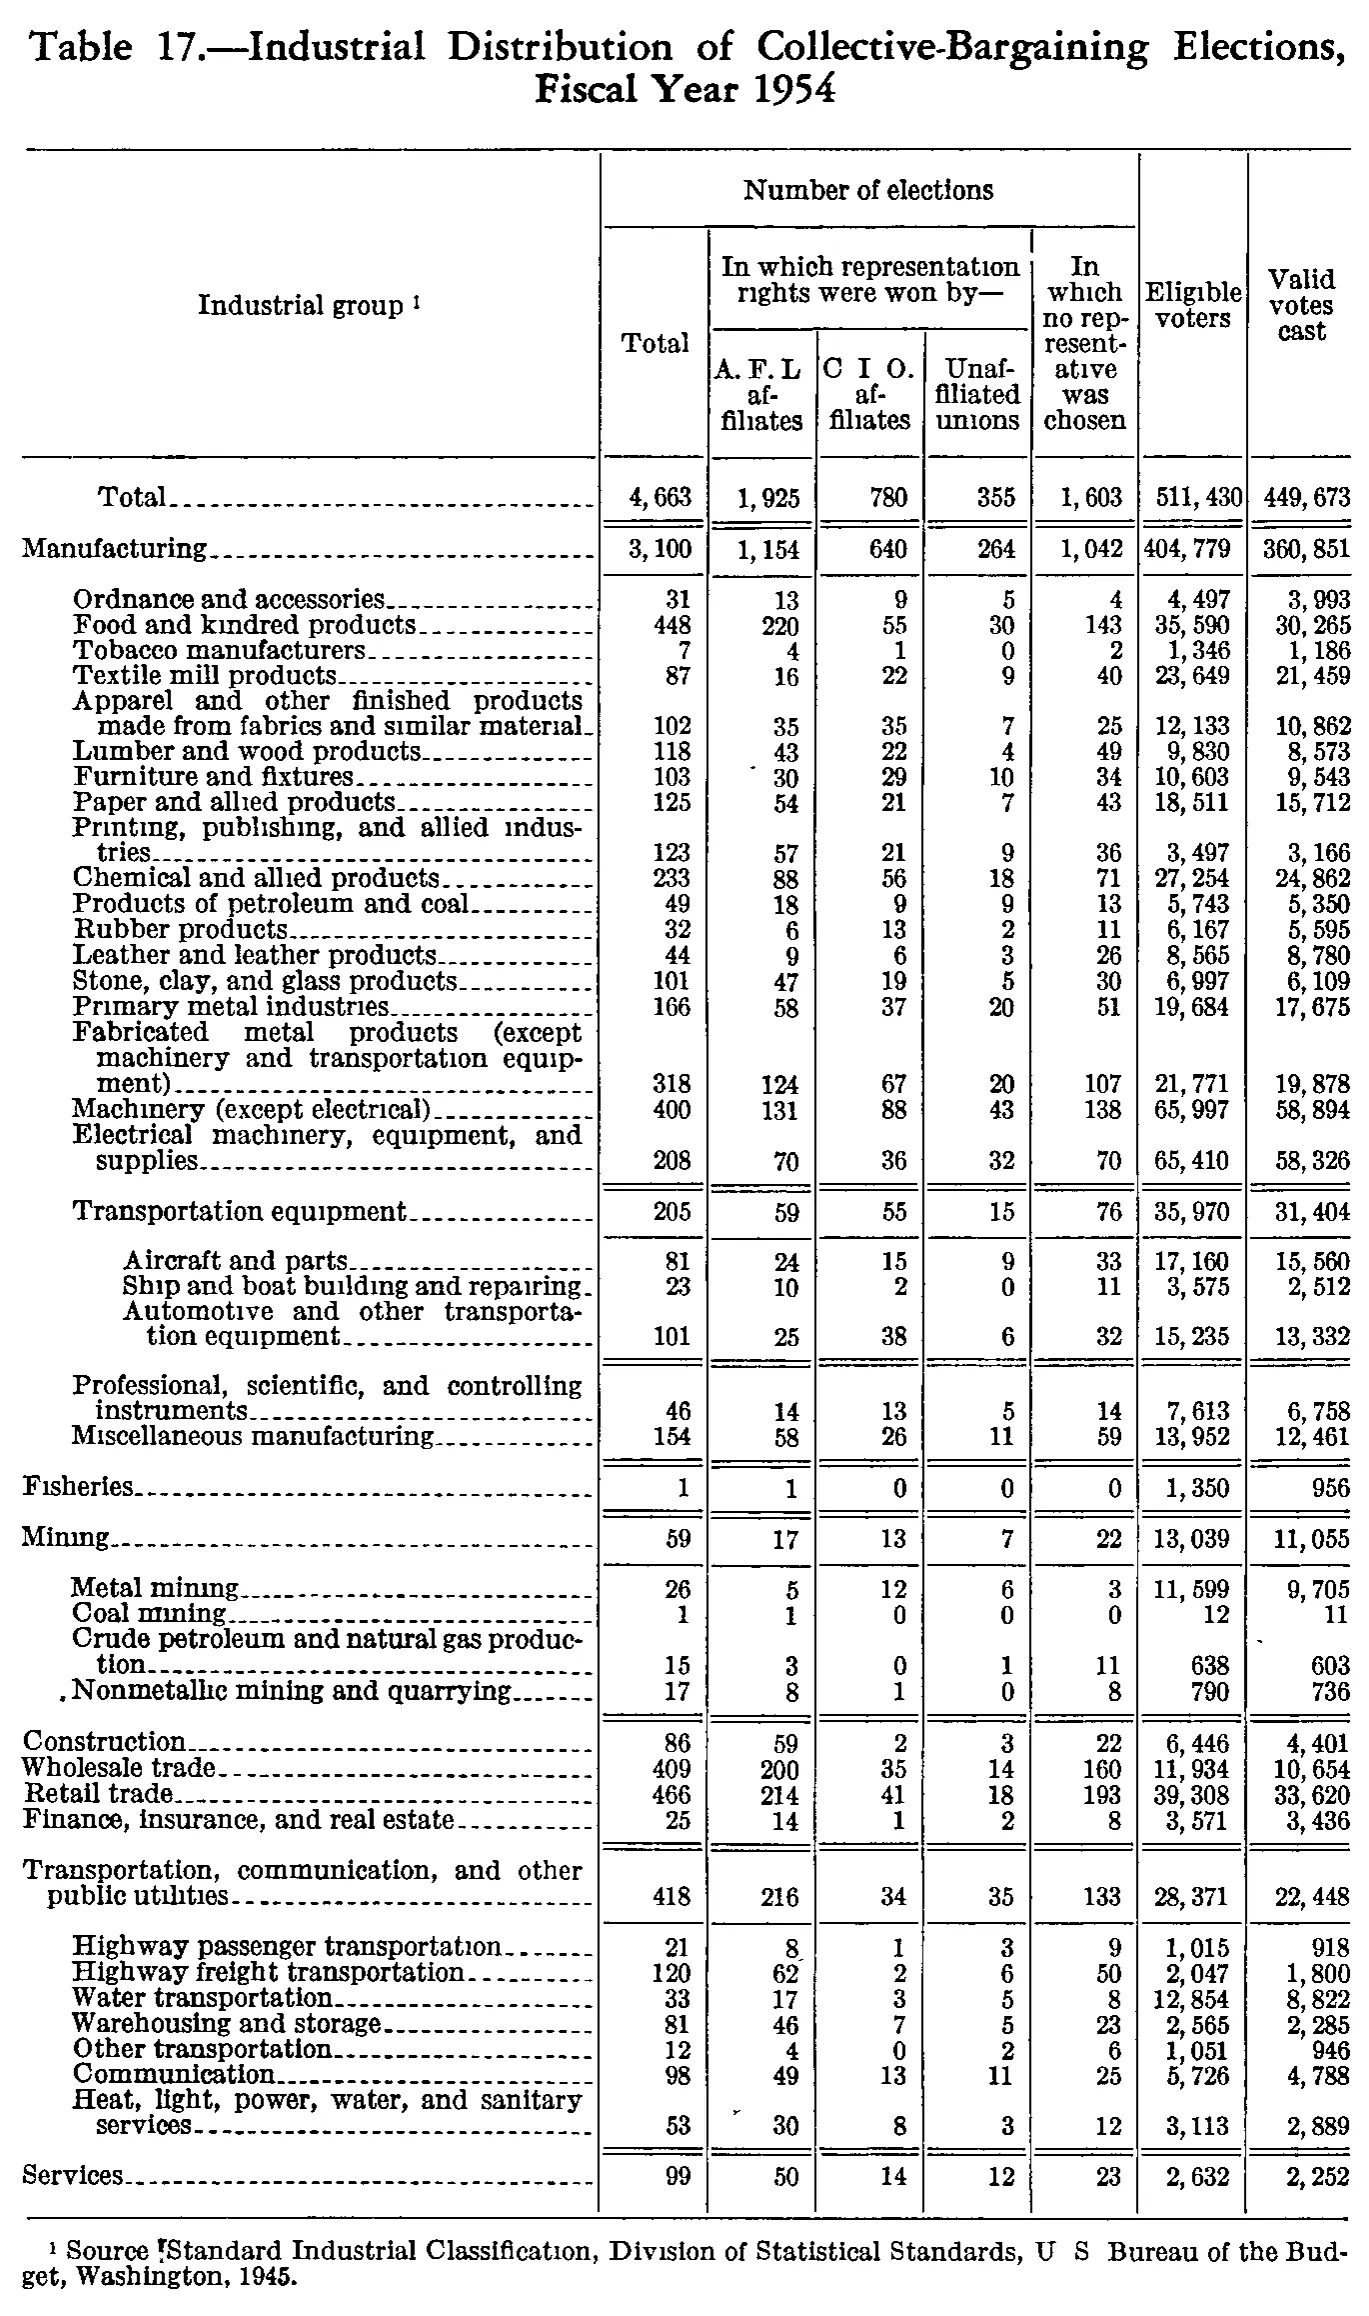
Industrial Distribution of Collective-Bargaining Elections, Fiscal Year 1954
| Industrial group | Number of elections | Eligible voters | Valid votes cast | ||||
|---|---|---|---|---|---|---|---|
| Industrial group | Total | In which representation rights were won by— | In which no representative was chosen | Eligible voters | Valid votes cast | ||
| Industrial group | Total | A. F. L affiliates | C I O. affiliates | Unaffiliated unions | In which no representative was chosen | Eligible voters | Valid votes cast |
| Total | 4,663 | 1,925 | 780 | 355 | 1,603 | 511,430 | 449,673 |
| Manufacturing | 3,100 | 1,154 | 640 | 264 | 1,042 | 404,779 | 360,851 |
| Ordnance and accessories | 31 | 13 | 9 | 5 | 4 | 4,497 | 3,993 |
| Food and kindred products | 448 | 220 | 55 | 30 | 143 | 35,590 | 30,265 |
| Tobacco manufacturers | 7 | 4 | 1 | 0 | 2 | 1,346 | 1,186 |
| Textile mill products | 87 | 16 | 22 | 9 | 40 | 23,649 | 21,459 |
| Apparel and other finished products made from fabrics and similar material | 102 | 35 | 35 | 7 | 25 | 12,133 | 10,862 |
| Lumber and wood products | 118 | 43 | 22 | 4 | 49 | 9,830 | 8,573 |
| Furniture and fixtures | 103 | 30 | 29 | 10 | 34 | 10,603 | 9,543 |
| Paper and allied products | 125 | 54 | 21 | 7 | 43 | 18,511 | 15,712 |
| Printing, publishing, and allied industries | 123 | 57 | 21 | 9 | 36 | 3,497 | 3,166 |
| Chemical and allied products | 233 | 88 | 56 | 18 | 71 | 27,254 | 24,862 |
| Products of petroleum and coal | 49 | 18 | 9 | 9 | 13 | 5,743 | 5,350 |
| Rubber products | 32 | 6 | 13 | 2 | 11 | 6,167 | 5,595 |
| Leather and leather products | 44 | 9 | 6 | 3 | 26 | 8,565 | 8,780 |
| Stone, clay, and glass products | 101 | 47 | 19 | 5 | 30 | 6,997 | 6,109 |
| Primary metal industries | 166 | 58 | 37 | 20 | 51 | 19,684 | 17,675 |
| Fabricated metal products (except machinery and transportation equipment) | 318 | 124 | 67 | 20 | 107 | 21,771 | 19,878 |
| Machinery (except electrical) | 400 | 131 | 88 | 43 | 138 | 65,997 | 58,894 |
| Electrical machinery, equipment, and supplies | 208 | 70 | 36 | 32 | 70 | 65,410 | 58,326 |
| Transportation equipment | 205 | 59 | 55 | 15 | 76 | 35,970 | 31,404 |
| Aircraft and parts | 81 | 24 | 15 | 9 | 33 | 17,160 | 15,560 |
| Ship and boat building and repairing | 23 | 10 | 2 | 0 | 11 | 3,575 | 2,512 |
| Automotive and other transportation equipment | 101 | 25 | 38 | 6 | 32 | 15,235 | 13,332 |
| Professional, scientific, and controlling instruments | 46 | 14 | 13 | 5 | 14 | 7,613 | 6,758 |
| Miscellaneous manufacturing | 154 | 58 | 26 | 11 | 59 | 13,952 | 12,461 |
| Fisheries | 1 | 1 | 0 | 0 | 0 | 1,350 | 956 |
| Mining | 59 | 17 | 13 | 7 | 22 | 13,039 | 11,055 |
| Metal mining | 26 | 5 | 12 | 6 | 3 | 11,599 | 9,705 |
| Coal mining | 1 | 1 | 0 | 0 | 0 | 12 | 11 |
| Crude petroleum and natural gas production | 15 | 3 | 0 | 1 | 11 | 638 | 603 |
| Nonmetallic mining and quarrying | 17 | 8 | 1 | 0 | 8 | 790 | 736 |
| Construction | 86 | 59 | 2 | 3 | 22 | 6,446 | 4,401 |
| Wholesale trade | 409 | 200 | 35 | 14 | 160 | 11,934 | 10,654 |
| Retail trade | 466 | 214 | 41 | 18 | 193 | 39,308 | 33,620 |
| Finance, insurance, and real estate | 25 | 14 | 1 | 2 | 8 | 3,571 | 3,436 |
| Transportation, communication, and other public utilities | 418 | 216 | 34 | 35 | 133 | 28,371 | 22,448 |
| Highway passenger transportation | 21 | 8 | 1 | 3 | 9 | 1,015 | 918 |
| Highway freight transportation | 120 | 62 | 2 | 6 | 50 | 2,047 | 1,800 |
| Water transportation | 33 | 17 | 3 | 5 | 8 | 12,854 | 8,822 |
| Warehousing and storage | 81 | 46 | 7 | 5 | 23 | 2,565 | 2,285 |
| Other transportation | 12 | 4 | 0 | 2 | 6 | 1,051 | 946 |
| Communication | 98 | 49 | 13 | 11 | 25 | 5,726 | 4,788 |
| Heat, light, power, water, and sanitary services | 53 | 30 | 8 | 3 | 12 | 3,113 | 2,889 |
| Services | 99 | 50 | 14 | 12 | 23 | 2,632 | 2,252 |
- 1 Source: Standard Industrial Classification, Division of Statistical Standards, U S Bureau of the Budget, Washington, 1945.
304 of 304 figures sit in a row or column sum that works out.
Reader’s notes
p. 185. Eight columns: stub, then Total / A.F.L. / C.I.O. / Unaffiliated / no-representative (all five under the spanner \"Number of elections\"), then Eligible voters and Valid votes cast, which are tall headings standing outside that spanner. Arithmetic checks (performed only as a verification of column placement, nothing was altered): all four election columns sum exactly to each subtotal and to the grand total 4,663; the Manufacturing, Mining, Transportation-equipment and Transportation/communication blocks sum exactly to their eligible-voter and valid-vote subtotals; and the industry subtotals sum exactly to 511,430 and 449,673. Apparent misprint in the source: \"Leather and leather products\" shows 8,565 eligible voters but 8,780 valid votes cast — more votes cast than eligible voters. Both figures are transcribed as printed, and both are the values required for the Manufacturing subtotals (404,779 and 360,851) to add up, so the digits are read correctly; the inconsistency is in the original. Typography: the scan renders many abbreviation periods faintly or not at all. The union headings are printed as \"A. F. L\" (no visible period after L) and \"C I O.\" (periods only after the O); these are transcribed as they appear rather than regularized to \"A. F. L.\" / \"C. I. O.\". Likewise \"U S Bureau of the Budget\" in the footnote, where the periods after U and S are not visible. Footnote punctuation: the mark between \"Source\" and \"Standard\" is a damaged glyph that reads like \"!\" in the scan; it is almost certainly a colon and has been transcribed as one. The row label \"Nonmetallic mining and quarrying\" is preceded by a stray ink speck resembling a period in the left margin; treated as a scan artifact and not transcribed. The body ends at \"Services\" with no further breakdown; the footnote follows directly, so nothing appears cut off by the crop.
Source image
Source data: U.S. NLRB Annual Reports (public domain). Reconstruction by NLRB Stats Archive. Read by claude-opus-5 (effort max, prompt extract_v1) from the 300-dpi scan; stitched by page. Updated October 2026.