NLRB Stats Archive › Annual Reports › FY1954 › Geographic Distribution of Collective-Bargaining Elections, Fiscal Year 1954
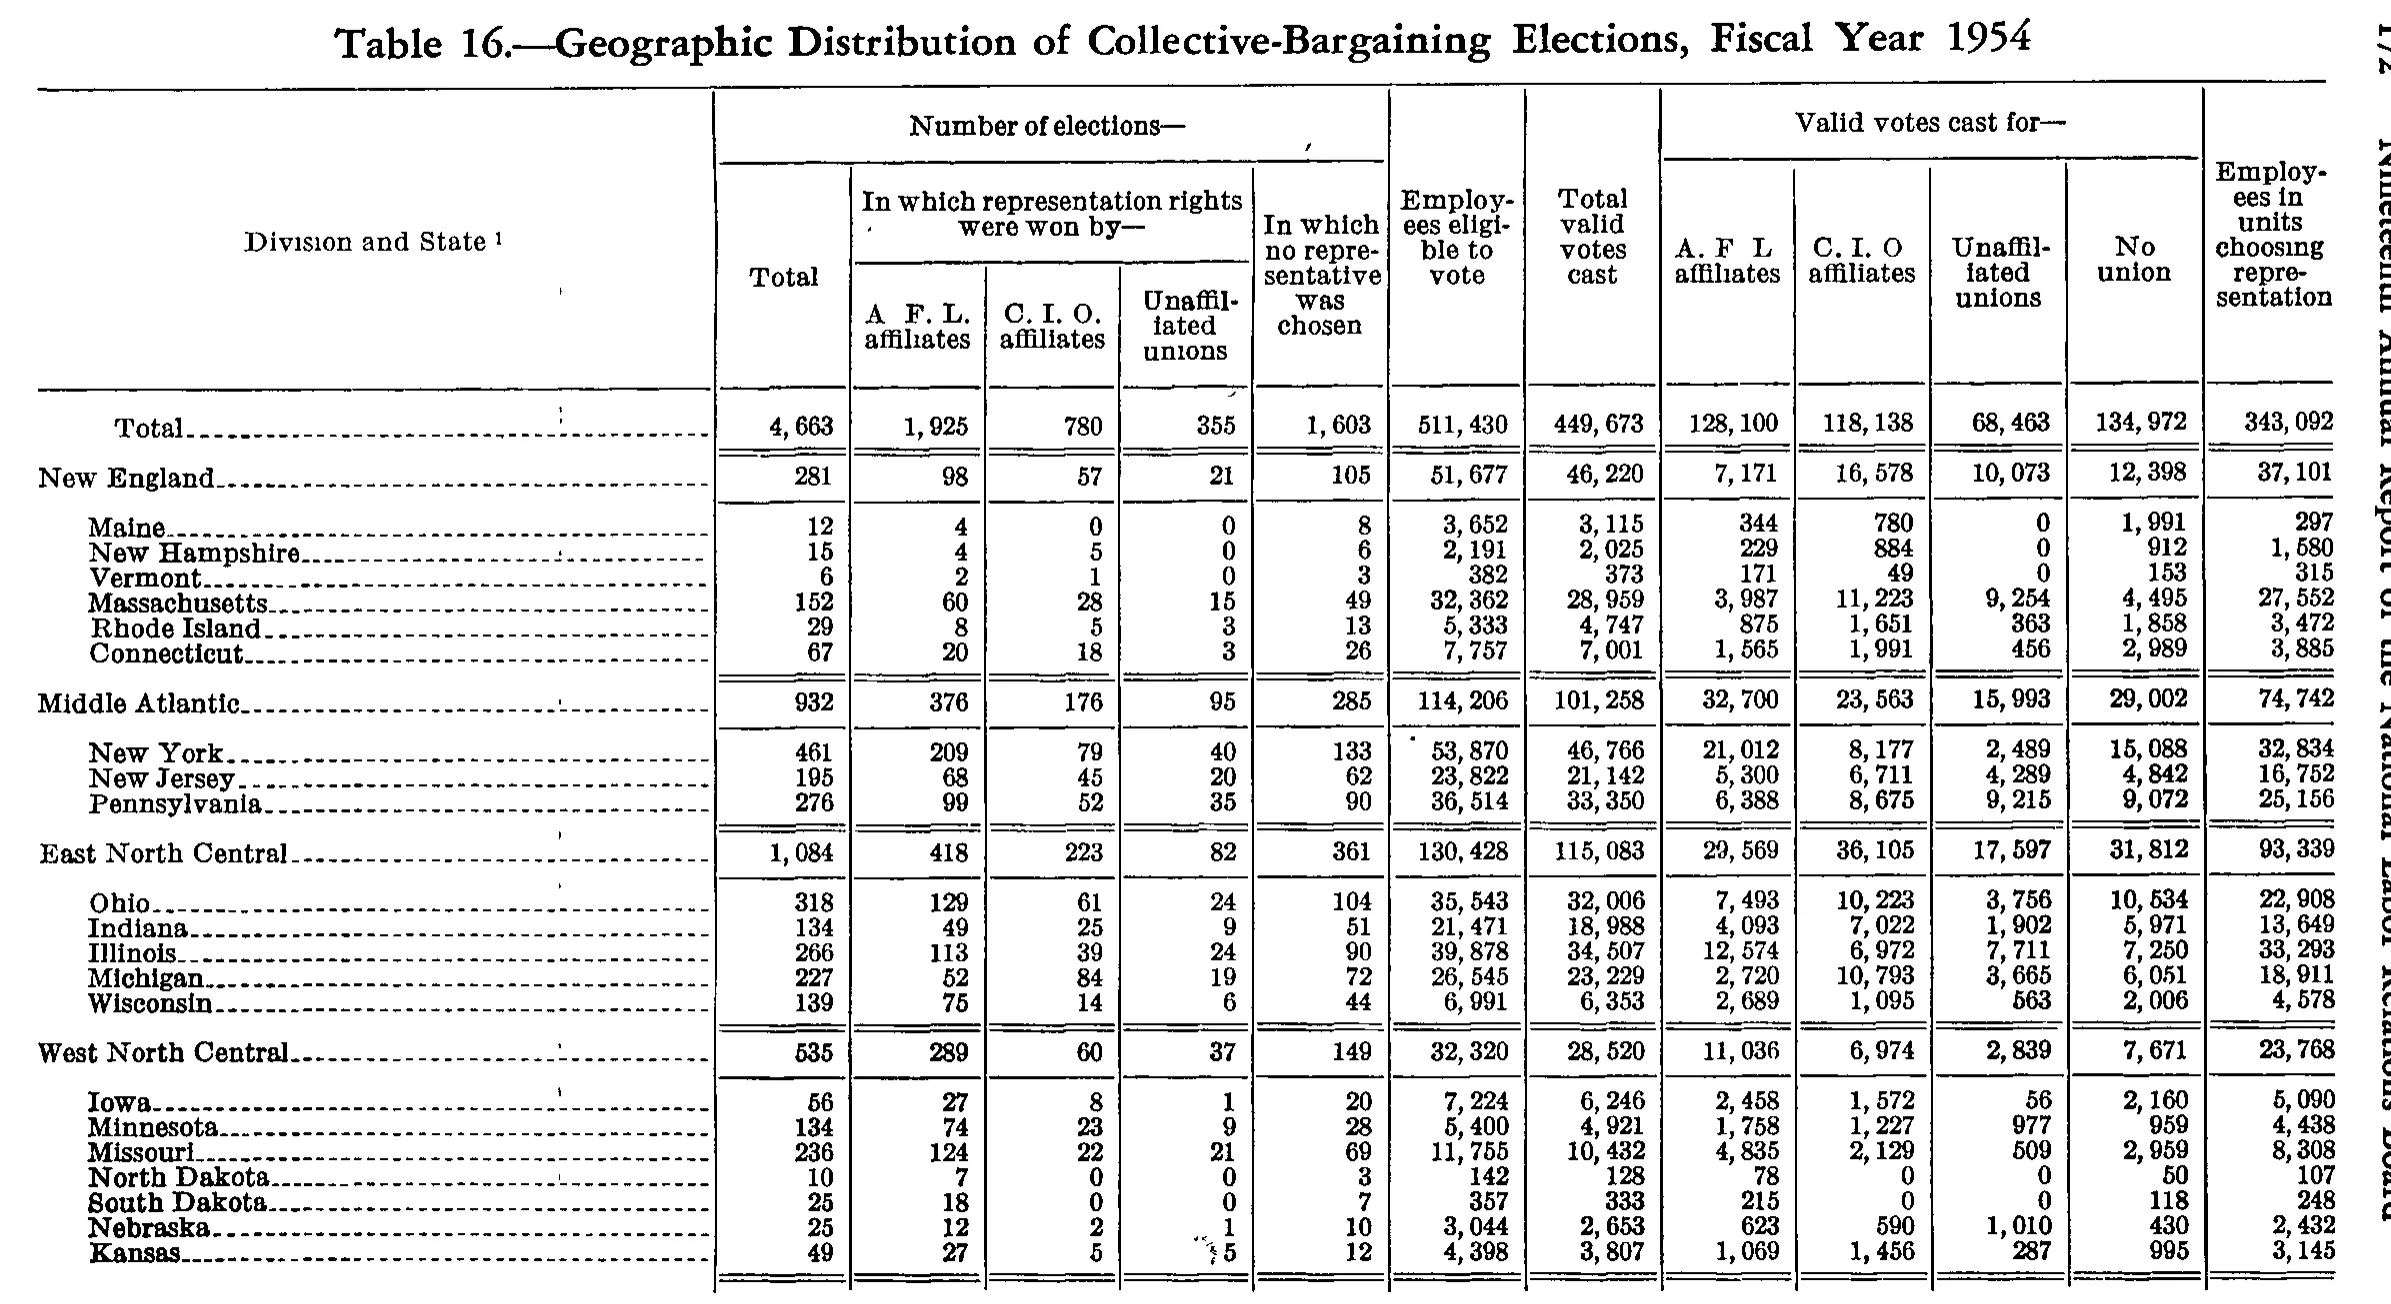
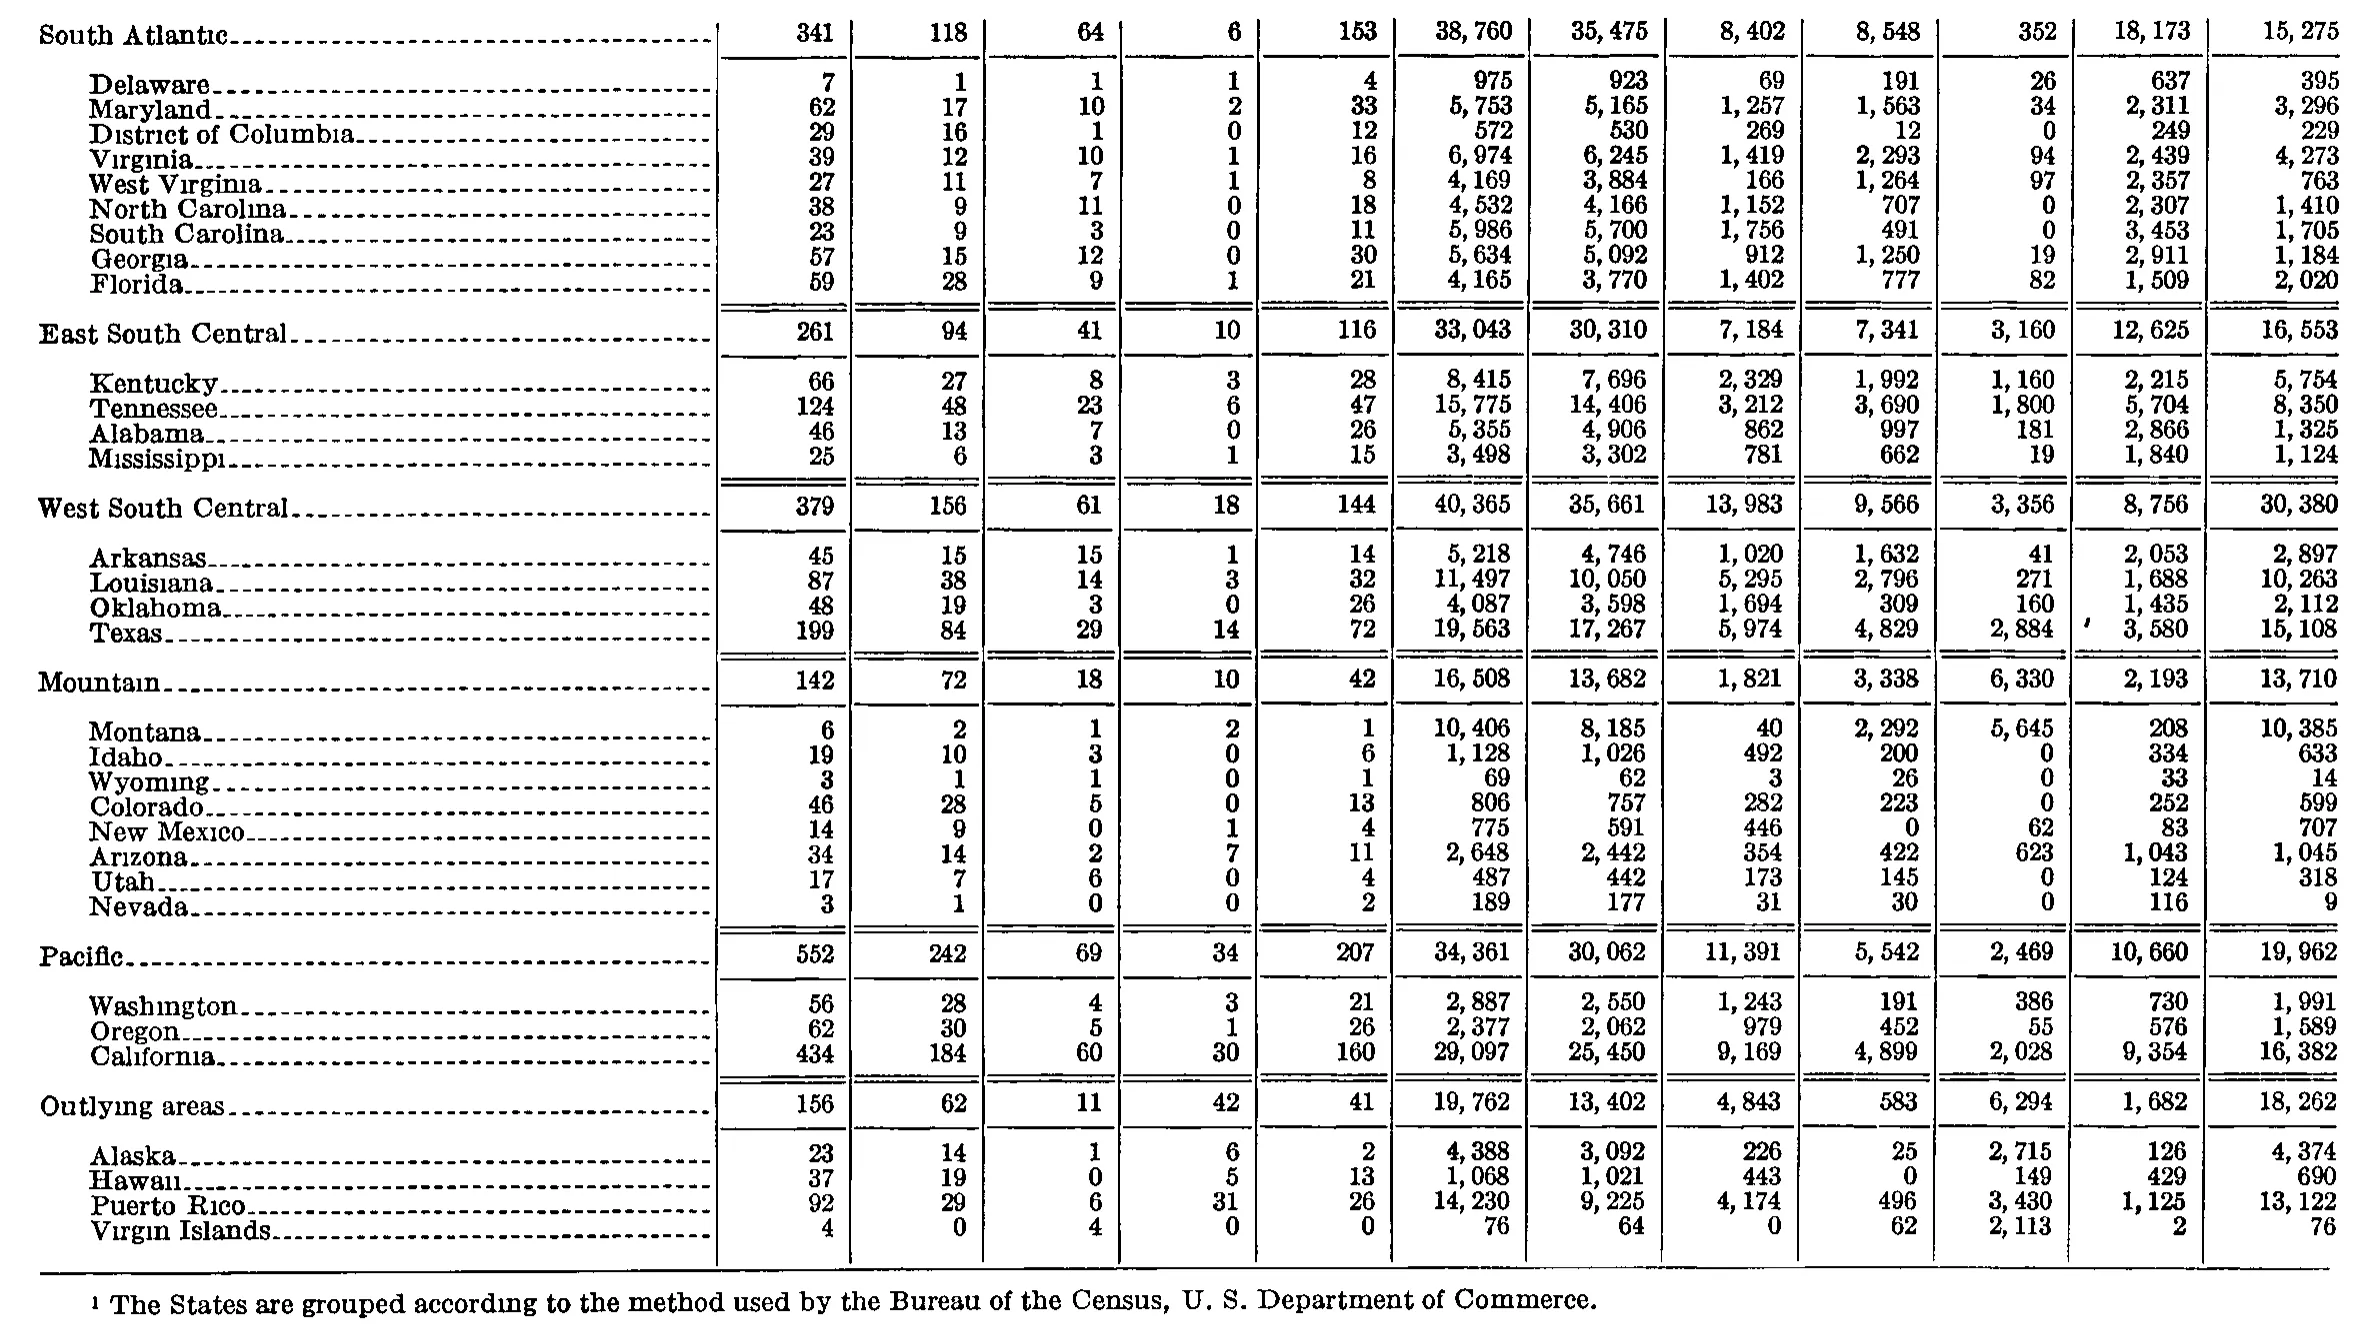
Geographic Distribution of Collective-Bargaining Elections, Fiscal Year 1954
Stitched from pp. 183–184.
| Division and State | Number of elections— | Employees eligible to vote | Total valid votes cast | Valid votes cast for— | Employees in units choosing representation | |||||||
|---|---|---|---|---|---|---|---|---|---|---|---|---|
| Division and State | Total | In which representation rights were won by— | In which no representative was chosen | Employees eligible to vote | Total valid votes cast | A. F. L. affiliates | C. I. O. affiliates | Unaffiliated unions | No union | Employees in units choosing representation | ||
| Division and State | Total | A. F. L. affiliates | C. I. O. affiliates | Unaffiliated unions | In which no representative was chosen | Employees eligible to vote | Total valid votes cast | A. F. L. affiliates | C. I. O. affiliates | Unaffiliated unions | No union | Employees in units choosing representation |
| Total | 4,663 | 1,925 | 780 | 355 | 1,603 | 511,430 | 449,673 | 128,100 | 118,138 | 68,463 | 134,972 | 343,092 |
| New England | 281 | 98 | 57 | 21 | 105 | 51,677 | 46,220 | 7,171 | 16,578 | 10,073 | 12,398 | 37,101 |
| Maine | 12 | 4 | 0 | 0 | 8 | 3,652 | 3,115 | 344 | 780 | 0 | 1,991 | 297 |
| New Hampshire | 15 | 4 | 5 | 0 | 6 | 2,191 | 2,025 | 229 | 884 | 0 | 912 | 1,580 |
| Vermont | 6 | 2 | 1 | 0 | 3 | 382 | 373 | 171 | 49 | 0 | 153 | 315 |
| Massachusetts | 152 | 60 | 28 | 15 | 49 | 32,362 | 28,959 | 3,987 | 11,223 | 9,254 | 4,495 | 27,552 |
| Rhode Island | 29 | 8 | 5 | 3 | 13 | 5,333 | 4,747 | 875 | 1,651 | 363 | 1,858 | 3,472 |
| Connecticut | 67 | 20 | 18 | 3 | 26 | 7,757 | 7,001 | 1,565 | 1,991 | 456 | 2,989 | 3,885 |
| Middle Atlantic | 932 | 376 | 176 | 95 | 285 | 114,206 | 101,258 | 32,700 | 23,563 | 15,993 | 29,002 | 74,742 |
| New York | 461 | 209 | 79 | 40 | 133 | 53,870 | 46,766 | 21,012 | 8,177 | 2,489 | 15,088 | 32,834 |
| New Jersey | 195 | 68 | 45 | 20 | 62 | 23,822 | 21,142 | 5,300 | 6,711 | 4,289 | 4,842 | 16,752 |
| Pennsylvania | 276 | 99 | 52 | 35 | 90 | 36,514 | 33,350 | 6,388 | 8,675 | 9,215 | 9,072 | 25,156 |
| East North Central | 1,084 | 418 | 223 | 82 | 361 | 130,428 | 115,083 | 29,569 | 36,105 | 17,597 | 31,812 | 93,339 |
| Ohio | 318 | 129 | 61 | 24 | 104 | 35,543 | 32,006 | 7,493 | 10,223 | 3,756 | 10,534 | 22,908 |
| Indiana | 134 | 49 | 25 | 9 | 51 | 21,471 | 18,988 | 4,093 | 7,022 | 1,902 | 5,971 | 13,649 |
| Illinois | 266 | 113 | 39 | 24 | 90 | 39,878 | 34,507 | 12,574 | 6,972 | 7,711 | 7,250 | 33,293 |
| Michigan | 227 | 52 | 84 | 19 | 72 | 26,545 | 23,229 | 2,720 | 10,793 | 3,665 | 6,051 | 18,911 |
| Wisconsin | 139 | 75 | 14 | 6 | 44 | 6,991 | 6,353 | 2,689 | 1,095 | 563 | 2,006 | 4,578 |
| West North Central | 535 | 289 | 60 | 37 | 149 | 32,320 | 28,520 | 11,036 | 6,974 | 2,839 | 7,671 | 23,768 |
| Iowa | 56 | 27 | 8 | 1 | 20 | 7,224 | 6,246 | 2,458 | 1,572 | 56 | 2,160 | 5,090 |
| Minnesota | 134 | 74 | 23 | 9 | 28 | 5,400 | 4,921 | 1,758 | 1,227 | 977 | 959 | 4,438 |
| Missouri | 236 | 124 | 22 | 21 | 69 | 11,755 | 10,432 | 4,835 | 2,129 | 509 | 2,959 | 8,308 |
| North Dakota | 10 | 7 | 0 | 0 | 3 | 142 | 128 | 78 | 0 | 0 | 50 | 107 |
| South Dakota | 25 | 18 | 0 | 0 | 7 | 357 | 333 | 215 | 0 | 0 | 118 | 248 |
| Nebraska | 25 | 12 | 2 | 1 | 10 | 3,044 | 2,653 | 623 | 590 | 1,010 | 430 | 2,432 |
| Kansas | 49 | 27 | 5 | 5 | 12 | 4,398 | 3,807 | 1,069 | 1,456 | 287 | 995 | 3,145 |
| South Atlantic | 341 | 118 | 64 | 6 | 153 | 38,760 | 35,475 | 8,402 | 8,548 | 352 | 18,173 | 15,275 |
| Delaware | 7 | 1 | 1 | 1 | 4 | 975 | 923 | 69 | 191 | 26 | 637 | 395 |
| Maryland | 62 | 17 | 10 | 2 | 33 | 5,753 | 5,165 | 1,257 | 1,563 | 34 | 2,311 | 3,296 |
| District of Columbia | 29 | 16 | 1 | 0 | 12 | 572 | 530 | 269 | 12 | 0 | 249 | 229 |
| Virginia | 39 | 12 | 10 | 1 | 16 | 6,974 | 6,245 | 1,419 | 2,293 | 94 | 2,439 | 4,273 |
| West Virginia | 27 | 11 | 7 | 1 | 8 | 4,169 | 3,884 | 166 | 1,264 | 97 | 2,357 | 763 |
| North Carolina | 38 | 9 | 11 | 0 | 18 | 4,532 | 4,166 | 1,152 | 707 | 0 | 2,307 | 1,410 |
| South Carolina | 23 | 9 | 3 | 0 | 11 | 5,986 | 5,700 | 1,756 | 491 | 0 | 3,453 | 1,705 |
| Georgia | 57 | 15 | 12 | 0 | 30 | 5,634 | 5,092 | 912 | 1,250 | 19 | 2,911 | 1,184 |
| Florida | 59 | 28 | 9 | 1 | 21 | 4,165 | 3,770 | 1,402 | 777 | 82 | 1,509 | 2,020 |
| East South Central | 261 | 94 | 41 | 10 | 116 | 33,043 | 30,310 | 7,184 | 7,341 | 3,160 | 12,625 | 16,553 |
| Kentucky | 66 | 27 | 8 | 3 | 28 | 8,415 | 7,696 | 2,329 | 1,992 | 1,160 | 2,215 | 5,754 |
| Tennessee | 124 | 48 | 23 | 6 | 47 | 15,775 | 14,406 | 3,212 | 3,690 | 1,800 | 5,704 | 8,350 |
| Alabama | 46 | 13 | 7 | 0 | 26 | 5,355 | 4,906 | 862 | 997 | 181 | 2,866 | 1,325 |
| Mississippi | 25 | 6 | 3 | 1 | 15 | 3,498 | 3,302 | 781 | 662 | 19 | 1,840 | 1,124 |
| West South Central | 379 | 156 | 61 | 18 | 144 | 40,365 | 35,661 | 13,983 | 9,566 | 3,356 | 8,756 | 30,380 |
| Arkansas | 45 | 15 | 15 | 1 | 14 | 5,218 | 4,746 | 1,020 | 1,632 | 41 | 2,053 | 2,897 |
| Louisiana | 87 | 38 | 14 | 3 | 32 | 11,497 | 10,050 | 5,295 | 2,796 | 271 | 1,688 | 10,263 |
| Oklahoma | 48 | 19 | 3 | 0 | 26 | 4,087 | 3,598 | 1,694 | 309 | 160 | 1,435 | 2,112 |
| Texas | 199 | 84 | 29 | 14 | 72 | 19,563 | 17,267 | 5,974 | 4,829 | 2,884 | 3,580 | 15,108 |
| Mountain | 142 | 72 | 18 | 10 | 42 | 16,508 | 13,682 | 1,821 | 3,338 | 6,330 | 2,193 | 13,710 |
| Montana | 6 | 2 | 1 | 2 | 1 | 10,406 | 8,185 | 40 | 2,292 | 5,645 | 208 | 10,385 |
| Idaho | 19 | 10 | 3 | 0 | 6 | 1,128 | 1,026 | 492 | 200 | 0 | 334 | 633 |
| Wyoming | 3 | 1 | 1 | 0 | 1 | 69 | 62 | 3 | 26 | 0 | 33 | 14 |
| Colorado | 46 | 28 | 5 | 0 | 13 | 806 | 757 | 282 | 223 | 0 | 252 | 599 |
| New Mexico | 14 | 9 | 0 | 1 | 4 | 775 | 591 | 446 | 0 | 62 | 83 | 707 |
| Arizona | 34 | 14 | 2 | 7 | 11 | 2,648 | 2,442 | 354 | 422 | 623 | 1,043 | 1,045 |
| Utah | 17 | 7 | 6 | 0 | 4 | 487 | 442 | 173 | 145 | 0 | 124 | 318 |
| Nevada | 3 | 1 | 0 | 0 | 2 | 189 | 177 | 31 | 30 | 0 | 116 | 9 |
| Pacific | 552 | 242 | 69 | 34 | 207 | 34,361 | 30,062 | 11,391 | 5,542 | 2,469 | 10,660 | 19,962 |
| Washington | 56 | 28 | 4 | 3 | 21 | 2,887 | 2,550 | 1,243 | 191 | 386 | 730 | 1,991 |
| Oregon | 62 | 30 | 5 | 1 | 26 | 2,377 | 2,062 | 979 | 452 | 55 | 576 | 1,589 |
| California | 434 | 184 | 60 | 30 | 160 | 29,097 | 25,450 | 9,169 | 4,899 | 2,028 | 9,354 | 16,382 |
| Outlying areas | 156 | 62 | 11 | 42 | 41 | 19,762 | 13,402 | 4,843 | 583 | 6,294 | 1,682 | 18,262 |
| Alaska | 23 | 14 | 1 | 6 | 2 | 4,388 | 3,092 | 226 | 25 | 2,715 | 126 | 4,374 |
| Hawaii | 37 | 19 | 0 | 5 | 13 | 1,068 | 1,021 | 443 | 0 | 149 | 429 | 690 |
| Puerto Rico | 92 | 29 | 6 | 31 | 26 | 14,230 | 9,225 | 4,174 | 496 | 3,430 | 1,125 | 13,122 |
| Virgin Islands | 4 | 0 | 4 | 0 | 0 | 76 | 64 | 0 | 62 | 2,113 | 2 | 76 |
- 1 The States are grouped according to the method used by the Bureau of the Census, U. S. Department of Commerce.
724 of 725 figures sit in a row or column sum that works out. 2 cells break a sum: 'Virgin Islands', column 8: prints 64, columns 9 to 12 add to 2,177; 'Outlying areas', column 11: prints 6,294, rows 'Alaska' to 'Virgin Islands' add to 8,407.
Reader’s notes
p. 183. The table is cut off by the crop: it ends after Kansas with a double rule at the page foot, and the remaining geographic divisions (South Atlantic onward) continue on following pages. The grand Total row (4,663 elections) therefore exceeds the sum of the four divisions printed here (2,832). No footnote text is printed on this page, although the stub heading carries a raised "1" marker whose text must appear elsewhere (probably at the end of the continued table). 13 columns. Header spanning: the rule under "Number of elections—" is faint at its right end, so I could not be certain whether that spanner covers only the four columns Total/A.F.L./C.I.O./Unaffiliated or also the fifth column "In which no representative was chosen". I treated it as spanning all five (the logical and usual arrangement for this table), and treated "Total" and "In which no representative was chosen" as tall headings repeated down levels 2-3. The four "Valid votes cast for—" subheadings are printed one level higher than the election-column subheadings, so they too are repeated in levels 2 and 3. In the scan several abbreviation periods have dropped out: the stub-side column reads "A F. L." and the votes-side column reads "A. F L" / "C. I. O"; I transcribed all four as the intended "A. F. L. affiliates" and "C. I. O. affiliates". Small ink smudges sit just left of the value in the "Unaffiliated unions" (elections) column for Nebraska (read as 1) and Kansas (read as 5); both readings are confirmed by the column and row sums. Faint stray marks also appear in the stub area of several rows (e.g. a tick above Massachusetts and Iowa) and a stray comma-like mark above the "In which no representative was chosen" heading; none are footnote markers. Arithmetic verification: every one of the four division subtotals reproduces the sum of its states in all 12 value columns, and in every data row the four vote-component columns sum to "Total valid votes cast". No misprints detected.
p. 184. The crop is a continuation page: no column headings or caption are printed on it, so header_rows is empty. The stub carries a two-level hierarchy (flush-left census regions, indented States); indentation is not reproduced in the cell text, but every indented State row belongs to the flush-left region row above it. The table begins mid-list (earlier regions are on the preceding page) and ends with Virgin Islands, after which footnote 1 is printed. Arithmetic check: I summed each region's State rows against its region total for all 12 data columns. All six regions reconcile exactly in all columns with ONE exception — the Virgin Islands cell in column 10 (the column reading 352 / 3,160 / 3,356 / 6,330 / 2,469 / 6,294 for the six regions). The Outlying areas total of 6,294 equals Alaska 2,715 + Hawaii 149 + Puerto Rico 3,430 exactly, i.e. it leaves nothing for Virgin Islands, yet "2,113" is legibly printed in that cell. I transcribed it as printed; it appears to be a misprint or a stray slug from typesetting (it is also an implausible value, since Virgin Islands shows only 76 in the column 6 total). Treat that one cell as doubtful. A small stray apostrophe-like mark sits in the Texas row between the column-10 value (2,884) and the column-11 value (3,580). It is an ink speck, not a digit or a footnote marker, so it is not transcribed. The scan sets digit groups with a space after the comma ("38, 760"); these are normalized to "38,760" per instructions. Several diacritic-looking specks over "i" in Atlantic/District/Virginia/Mississippi/Pacific/Washington/Oregon/Hawaii are scanning artifacts of the worn type and are ignored.
Source image
Source data: U.S. NLRB Annual Reports (public domain). Reconstruction by NLRB Stats Archive. Read by claude-opus-5 (effort max, prompt extract_v1) from the 300-dpi scan; stitched by page. Updated October 2026.