NLRB Stats Archive › Annual Reports › FY1954 › Size of Units in Collective-Bargaining and Decertification Elections, Fiscal Year 1954
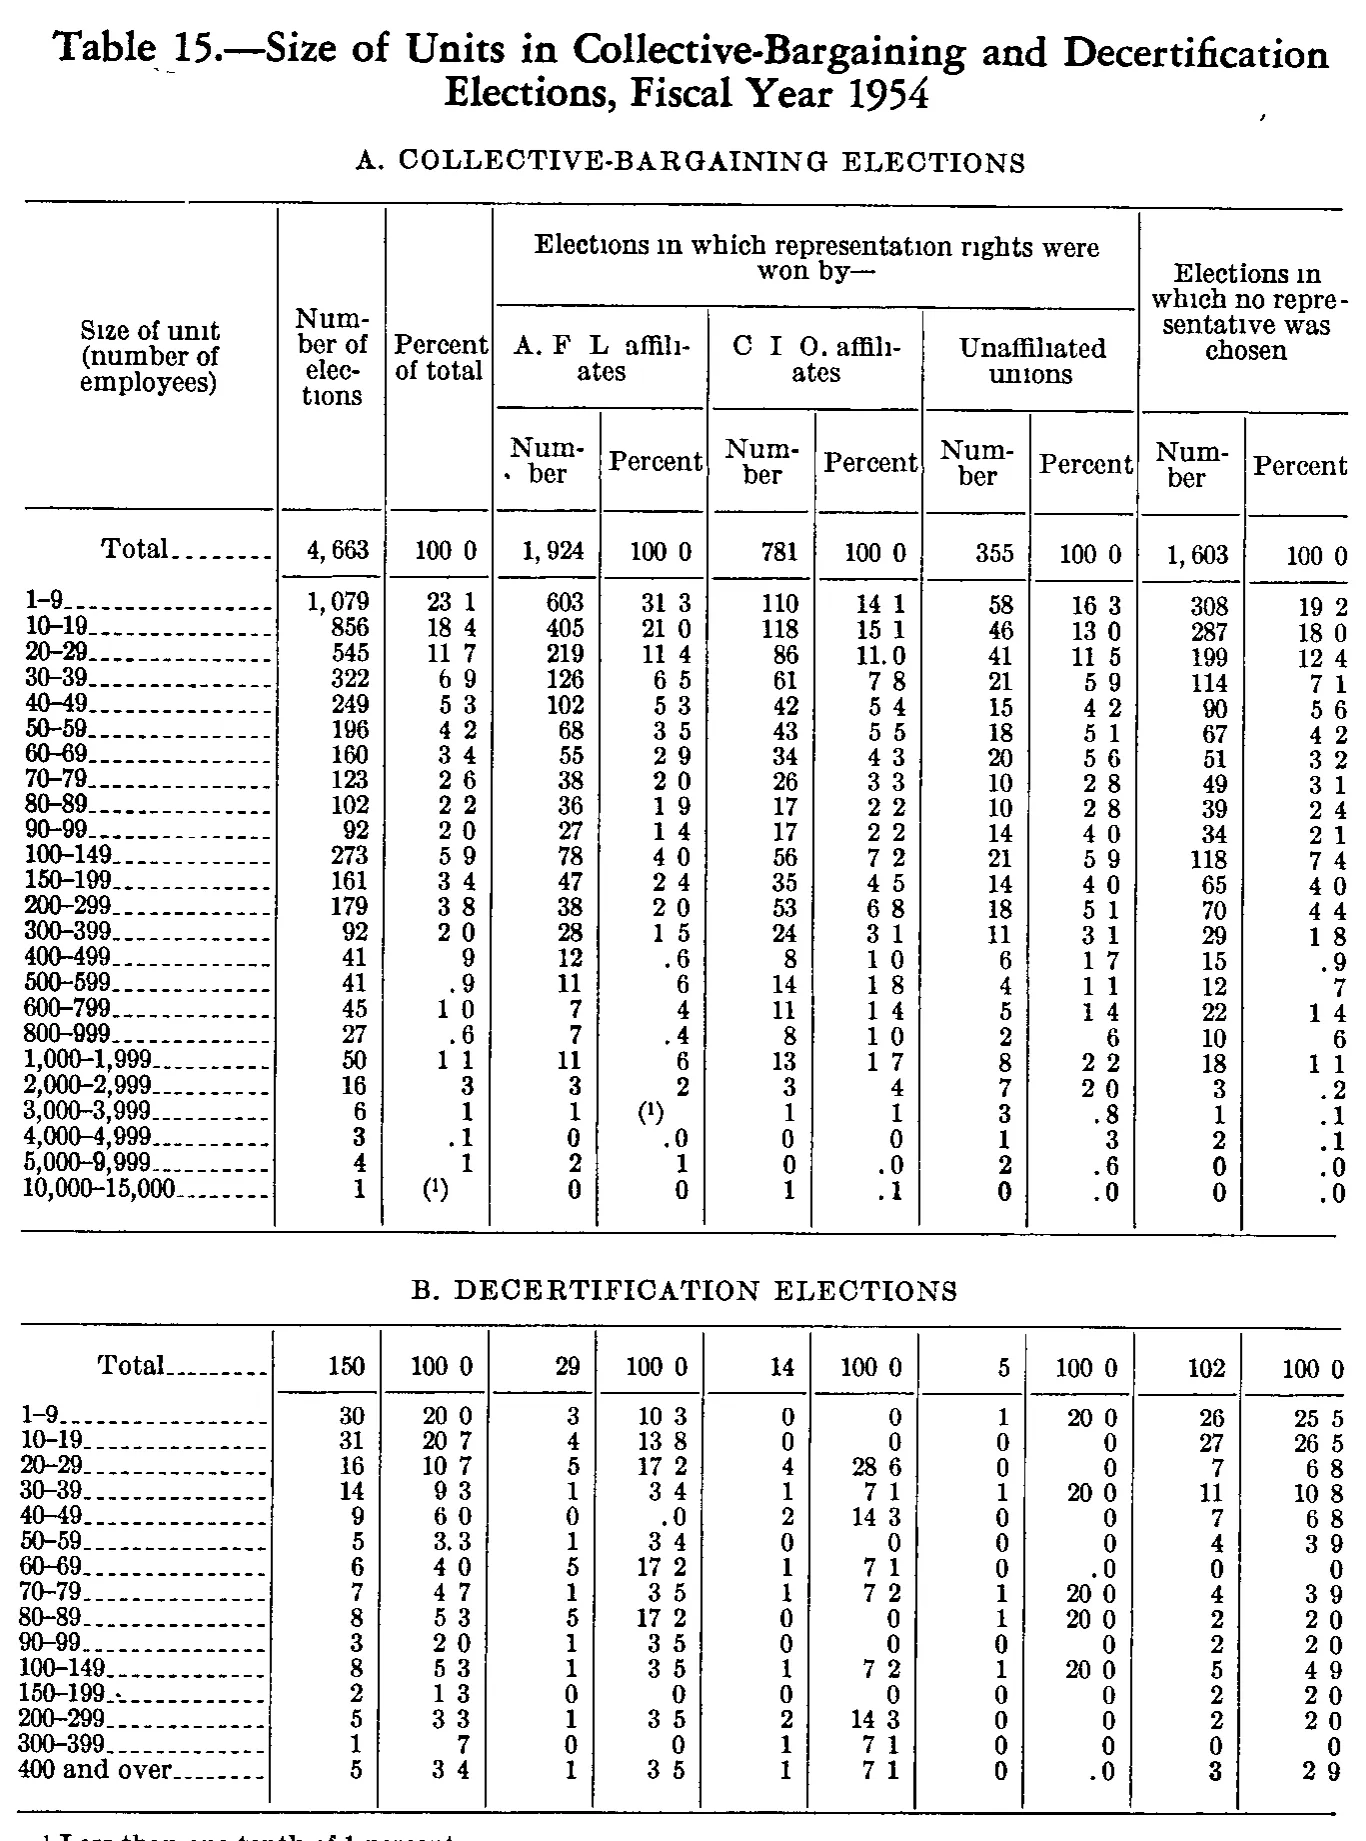
Size of Units in Collective-Bargaining and Decertification Elections, Fiscal Year 1954
| Size of unit (number of employees) | Number of elections | Percent of total | Elections in which representation rights were won by— | Elections in which no representative was chosen | ||||||
|---|---|---|---|---|---|---|---|---|---|---|
| Size of unit (number of employees) | Number of elections | Percent of total | A. F. L. affiliates | C. I. O. affiliates | Unaffiliated unions | Elections in which no representative was chosen | ||||
| Size of unit (number of employees) | Number of elections | Percent of total | Number | Percent | Number | Percent | Number | Percent | Number | Percent |
| A. COLLECTIVE-BARGAINING ELECTIONS | ||||||||||
| Total | 4,663 | 100.0 | 1,924 | 100.0 | 781 | 100.0 | 355 | 100.0 | 1,603 | 100.0 |
| 1-9 | 1,079 | 23.1 | 603 | 31.3 | 110 | 14.1 | 58 | 16.3 | 308 | 19.2 |
| 10-19 | 856 | 18.4 | 405 | 21.0 | 118 | 15.1 | 46 | 13.0 | 287 | 18.0 |
| 20-29 | 545 | 11.7 | 219 | 11.4 | 86 | 11.0 | 41 | 11.5 | 199 | 12.4 |
| 30-39 | 322 | 6.9 | 126 | 6.5 | 61 | 7.8 | 21 | 5.9 | 114 | 7.1 |
| 40-49 | 249 | 5.3 | 102 | 5.3 | 42 | 5.4 | 15 | 4.2 | 90 | 5.6 |
| 50-59 | 196 | 4.2 | 68 | 3.5 | 43 | 5.5 | 18 | 5.1 | 67 | 4.2 |
| 60-69 | 160 | 3.4 | 55 | 2.9 | 34 | 4.3 | 20 | 5.6 | 51 | 3.2 |
| 70-79 | 123 | 2.6 | 38 | 2.0 | 26 | 3.3 | 10 | 2.8 | 49 | 3.1 |
| 80-89 | 102 | 2.2 | 36 | 1.9 | 17 | 2.2 | 10 | 2.8 | 39 | 2.4 |
| 90-99 | 92 | 2.0 | 27 | 1.4 | 17 | 2.2 | 14 | 4.0 | 34 | 2.1 |
| 100-149 | 273 | 5.9 | 78 | 4.0 | 56 | 7.2 | 21 | 5.9 | 118 | 7.4 |
| 150-199 | 161 | 3.4 | 47 | 2.4 | 35 | 4.5 | 14 | 4.0 | 65 | 4.0 |
| 200-299 | 179 | 3.8 | 38 | 2.0 | 53 | 6.8 | 18 | 5.1 | 70 | 4.4 |
| 300-399 | 92 | 2.0 | 28 | 1.5 | 24 | 3.1 | 11 | 3.1 | 29 | 1.8 |
| 400-499 | 41 | .9 | 12 | .6 | 8 | 1.0 | 6 | 1.7 | 15 | .9 |
| 500-599 | 41 | .9 | 11 | .6 | 14 | 1.8 | 4 | 1.1 | 12 | .7 |
| 600-799 | 45 | 1.0 | 7 | .4 | 11 | 1.4 | 5 | 1.4 | 22 | 1.4 |
| 800-999 | 27 | .6 | 7 | .4 | 8 | 1.0 | 2 | .6 | 10 | .6 |
| 1,000-1,999 | 50 | 1.1 | 11 | .6 | 13 | 1.7 | 8 | 2.2 | 18 | 1.1 |
| 2,000-2,999 | 16 | .3 | 3 | .2 | 3 | .4 | 7 | 2.0 | 3 | .2 |
| 3,000-3,999 | 6 | .1 | 1 | 1 | .1 | 3 | .8 | 1 | .1 | |
| 4,000-4,999 | 3 | .1 | 0 | .0 | 0 | 0 | 1 | .3 | 2 | .1 |
| 5,000-9,999 | 4 | .1 | 2 | .1 | 0 | .0 | 2 | .6 | 0 | .0 |
| 10,000-15,000 | 1 | 0 | 0 | 1 | .1 | 0 | .0 | 0 | .0 | |
| B. DECERTIFICATION ELECTIONS | ||||||||||
| Total | 150 | 100.0 | 29 | 100.0 | 14 | 100.0 | 5 | 100.0 | 102 | 100.0 |
| 1-9 | 30 | 20.0 | 3 | 10.3 | 0 | 0 | 1 | 20.0 | 26 | 25.5 |
| 10-19 | 31 | 20.7 | 4 | 13.8 | 0 | 0 | 0 | 0 | 27 | 26.5 |
| 20-29 | 16 | 10.7 | 5 | 17.2 | 4 | 28.6 | 0 | 0 | 7 | 6.8 |
| 30-39 | 14 | 9.3 | 1 | 3.4 | 1 | 7.1 | 1 | 20.0 | 11 | 10.8 |
| 40-49 | 9 | 6.0 | 0 | .0 | 2 | 14.3 | 0 | 0 | 7 | 6.8 |
| 50-59 | 5 | 3.3 | 1 | 3.4 | 0 | 0 | 0 | 0 | 4 | 3.9 |
| 60-69 | 6 | 4.0 | 5 | 17.2 | 1 | 7.1 | 0 | .0 | 0 | 0 |
| 70-79 | 7 | 4.7 | 1 | 3.5 | 1 | 7.2 | 1 | 20.0 | 4 | 3.9 |
| 80-89 | 8 | 5.3 | 5 | 17.2 | 0 | 0 | 1 | 20.0 | 2 | 2.0 |
| 90-99 | 3 | 2.0 | 1 | 3.5 | 0 | 0 | 0 | 0 | 2 | 2.0 |
| 100-149 | 8 | 5.3 | 1 | 3.5 | 1 | 7.2 | 1 | 20.0 | 5 | 4.9 |
| 150-199 | 2 | 1.3 | 0 | 0 | 0 | 0 | 0 | 0 | 2 | 2.0 |
| 200-299 | 5 | 3.3 | 1 | 3.5 | 2 | 14.3 | 0 | 0 | 2 | 2.0 |
| 300-399 | 1 | .7 | 0 | 0 | 1 | 7.1 | 0 | 0 | 0 | 0 |
| 400 and over | 5 | 3.4 | 1 | 3.5 | 1 | 7.1 | 0 | .0 | 3 | 2.9 |
- 1 Less than one-tenth of 1 percent.
177 of 177 figures sit in a row or column sum that works out.
Reader’s notes
p. 182. Structure: the page carries one table with two stacked sections, "A. COLLECTIVE-BARGAINING ELECTIONS" (printed above the column headings) and "B. DECERTIFICATION ELECTIONS" (printed between the two bodies). Both are transcribed as label-only section rows. Section B repeats section A's eleven columns but prints no headings of its own, so the headings are given once. Decimal points: this is a 1-bit scan in which the decimal point of the percent columns very often drops out, so values print as "100 0", "23 1", "11 5". I have restored the point throughout ("100.0", "23.1", "11.5"), as with the comma-space rule. By the same logic a bare right-aligned digit in a percent column has been read as a leading-point fraction: panel A 400-499 and 500-599 "Percent of total" = ".9"; 2,000-2,999 "Percent of total" = ".3" and A.F.L. Percent = ".2"; 3,000-3,999 and 5,000-9,999 "Percent of total" = ".1"; C.I.O. Percent ".4" (2,000-2,999) and ".1" (3,000-3,999); Unaffiliated Percent ".3" (4,000-4,999). Each of these is consistent with the printed counts, so I am confident in the reading, but the points themselves are not legible on this scan. Zero cells: in the percent columns a zero is printed sometimes as "0" and sometimes as ".0". At this resolution the presence or absence of the leading point on a zero is the least certain detail in the grid; I transcribed each as it appeared, but individual zero cells (notably panel B, C.I.O. Percent and Unaffiliated Percent) could go either way. "(^1)" cells: at panel A row 3,000-3,999 (A.F.L. Percent) and row 10,000-15,000 (Percent of total) the value position holds a parenthesised raised 1, i.e. the reference to footnote 1 ("Less than one-tenth of 1 percent") standing in place of a number, not a printed value. Headings: the periods in "A. F. L. affiliates" and "C. I. O. affiliates" are faint or broken on the scan (the C.I.O. line reads roughly "C I O. affili-ates"); I have set them in the conventional form. The em dash closing "won by—" is printed. Doubtful digits: panel B, "400 and over", "Percent of total" reads as 3.4 but 5 of 150 is 3.3, and the neighbouring 200-299 row with the same count of 5 prints 3.3 — the digit is legible as 4 but may be a misprint or a scan artefact. Printed values that disagree with the counts, transcribed as printed and not corrected: panel A 10-19, "Elections in which no representative was chosen" Percent prints 18.0 where 287 of 1,603 is 17.9; panel A 90-99 and 150-199, Unaffiliated Percent prints 4.0 where 14 of 355 is 3.9; panel B 70-79 and 100-149, C.I.O. Percent prints 7.2 where 1 of 14 is 7.1, and A.F.L. Percent prints 3.5 in four rows but 3.4 in two others for the same 1 of 29. Crop: the footnote line at the foot of the page is clipped by the bottom edge of the image — the marker and the words are readable but the descenders are cut, and the terminal period is inferred. Verification: every count column was summed against its printed total. Panel A: 4,663; 1,924; 781; 355; 1,603 — all five agree. Panel B: 150; 29; 14; 5; 102 — all five agree.
Source image
Source data: U.S. NLRB Annual Reports (public domain). Reconstruction by NLRB Stats Archive. Read by claude-opus-5 (effort max, prompt extract_v1) from the 300-dpi scan; stitched by page. Updated October 2026.