NLRB Stats Archive › Annual Reports › FY1954 › Industrial Distribution of Unfair Labor Practice and Representation Cases Received, Fiscal Year 1954
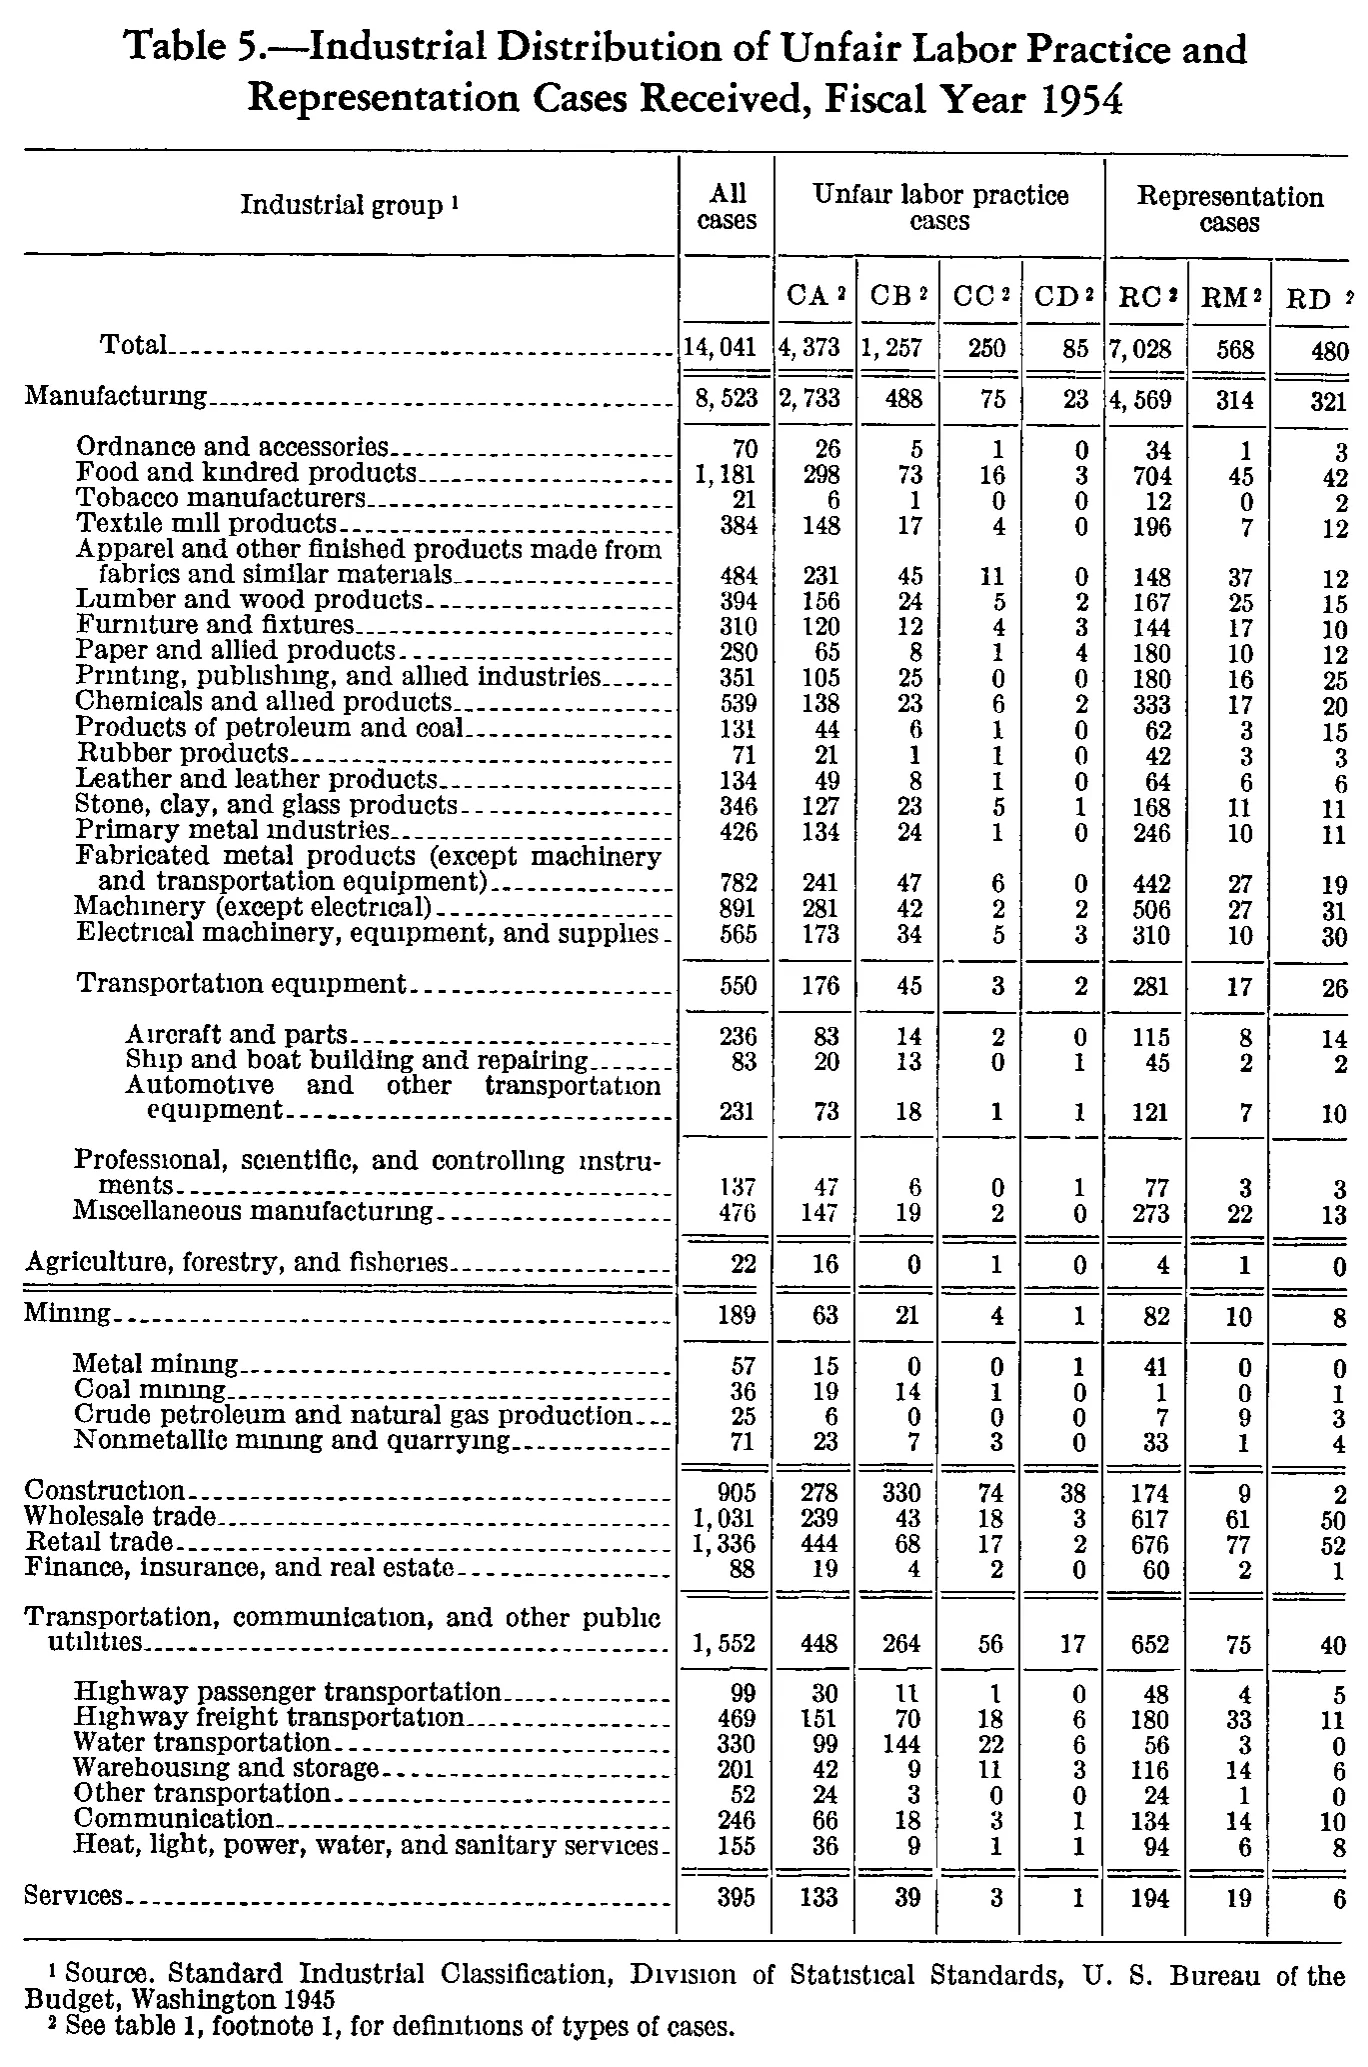
Industrial Distribution of Unfair Labor Practice and Representation Cases Received, Fiscal Year 1954
| Industrial group | All cases | Unfair labor practice cases | Representation cases | |||||
|---|---|---|---|---|---|---|---|---|
| Industrial group | All cases | CA | CB | CC | CD | RC | RM | RD |
| Total | 14,041 | 4,373 | 1,257 | 250 | 85 | 7,028 | 568 | 480 |
| Manufacturing | 8,523 | 2,733 | 488 | 75 | 23 | 4,569 | 314 | 321 |
| Ordnance and accessories | 70 | 26 | 5 | 1 | 0 | 34 | 1 | 3 |
| Food and kindred products | 1,181 | 298 | 73 | 16 | 3 | 704 | 45 | 42 |
| Tobacco manufacturers | 21 | 6 | 1 | 0 | 0 | 12 | 0 | 2 |
| Textile mill products | 384 | 148 | 17 | 4 | 0 | 196 | 7 | 12 |
| Apparel and other finished products made from fabrics and similar materials | 484 | 231 | 45 | 11 | 0 | 148 | 37 | 12 |
| Lumber and wood products | 394 | 156 | 24 | 5 | 2 | 167 | 25 | 15 |
| Furniture and fixtures | 310 | 120 | 12 | 4 | 3 | 144 | 17 | 10 |
| Paper and allied products | 280 | 65 | 8 | 1 | 4 | 180 | 10 | 12 |
| Printing, publishing, and allied industries | 351 | 105 | 25 | 0 | 0 | 180 | 16 | 25 |
| Chemicals and allied products | 539 | 138 | 23 | 6 | 2 | 333 | 17 | 20 |
| Products of petroleum and coal | 131 | 44 | 6 | 1 | 0 | 62 | 3 | 15 |
| Rubber products | 71 | 21 | 1 | 1 | 0 | 42 | 3 | 3 |
| Leather and leather products | 134 | 49 | 8 | 1 | 0 | 64 | 6 | 6 |
| Stone, clay, and glass products | 346 | 127 | 23 | 5 | 1 | 168 | 11 | 11 |
| Primary metal industries | 426 | 134 | 24 | 1 | 0 | 246 | 10 | 11 |
| Fabricated metal products (except machinery and transportation equipment) | 782 | 241 | 47 | 6 | 0 | 442 | 27 | 19 |
| Machinery (except electrical) | 891 | 281 | 42 | 2 | 2 | 506 | 27 | 31 |
| Electrical machinery, equipment, and supplies | 565 | 173 | 34 | 5 | 3 | 310 | 10 | 30 |
| Transportation equipment | 550 | 176 | 45 | 3 | 2 | 281 | 17 | 26 |
| Aircraft and parts | 236 | 83 | 14 | 2 | 0 | 115 | 8 | 14 |
| Ship and boat building and repairing | 83 | 20 | 13 | 0 | 1 | 45 | 2 | 2 |
| Automotive and other transportation equipment | 231 | 73 | 18 | 1 | 1 | 121 | 7 | 10 |
| Professional, scientific, and controlling instruments | 137 | 47 | 6 | 0 | 1 | 77 | 3 | 3 |
| Miscellaneous manufacturing | 476 | 147 | 19 | 2 | 0 | 273 | 22 | 13 |
| Agriculture, forestry, and fisheries | 22 | 16 | 0 | 1 | 0 | 4 | 1 | 0 |
| Mining | 189 | 63 | 21 | 4 | 1 | 82 | 10 | 8 |
| Metal mining | 57 | 15 | 0 | 0 | 1 | 41 | 0 | 0 |
| Coal mining | 36 | 19 | 14 | 1 | 0 | 1 | 0 | 1 |
| Crude petroleum and natural gas production | 25 | 6 | 0 | 0 | 0 | 7 | 9 | 3 |
| Nonmetallic mining and quarrying | 71 | 23 | 7 | 3 | 0 | 33 | 1 | 4 |
| Construction | 905 | 278 | 330 | 74 | 38 | 174 | 9 | 2 |
| Wholesale trade | 1,031 | 239 | 43 | 18 | 3 | 617 | 61 | 50 |
| Retail trade | 1,336 | 444 | 68 | 17 | 2 | 676 | 77 | 52 |
| Finance, insurance, and real estate | 88 | 19 | 4 | 2 | 0 | 60 | 2 | 1 |
| Transportation, communication, and other public utilities | 1,552 | 448 | 264 | 56 | 17 | 652 | 75 | 40 |
| Highway passenger transportation | 99 | 30 | 11 | 1 | 0 | 48 | 4 | 5 |
| Highway freight transportation | 469 | 151 | 70 | 18 | 6 | 180 | 33 | 11 |
| Water transportation | 330 | 99 | 144 | 22 | 6 | 56 | 3 | 0 |
| Warehousing and storage | 201 | 42 | 9 | 11 | 3 | 116 | 14 | 6 |
| Other transportation | 52 | 24 | 3 | 0 | 0 | 24 | 1 | 0 |
| Communication | 246 | 66 | 18 | 3 | 1 | 134 | 14 | 10 |
| Heat, light, power, water, and sanitary services | 155 | 36 | 9 | 1 | 1 | 94 | 6 | 8 |
| Services | 395 | 133 | 39 | 3 | 1 | 194 | 19 | 6 |
- 1 Source. Standard Industrial Classification, Division of Statistical Standards, U. S. Bureau of the Budget, Washington 1945
- 2 See table 1, footnote 1, for definitions of types of cases.
324 of 324 figures sit in a row or column sum that works out.
Reader’s notes
p. 170. Nine columns: stub plus All cases, CA, CB, CC, CD (under "Unfair labor practice cases") and RC, RM, RD (under "Representation cases"). The upper heading level leaves the stub and "All cases" cells spanning both levels, so those two headings are repeated in each level. Arithmetic cross-checks all pass as transcribed: every row's seven case-type cells sum to its "All cases" figure; the 21 manufacturing detail lines sum to Manufacturing (8,523); the three transportation-equipment sublines sum to 550; the four mining sublines sum to 189; the seven transportation/communication sublines sum to 1,552; and the nine major-division lines sum to the Total row (14,041). This gives strong independent confirmation of the digits and of the column each one sits in. A few cells worth flagging even though they verify arithmetically: "Crude petroleum and natural gas production" has RM = 9 against RC = 7, unusual for this table but confirmed by the row sum of 25. "Water transportation" has CB = 144, larger than its CA = 99, also confirmed by the row sum of 330. The stub label on the tobacco line is printed "Tobacco manufacturers" (the Standard Industrial Classification wording is "Tobacco manufactures"); transcribed as printed. The scan renders many dotted i's faintly (e.g. "Manufacturing", "Mining", "Printing"), but the words are unambiguous. No rows are cut off by the crop; the table ends with the Services line above the footnotes.
Source image
Source data: U.S. NLRB Annual Reports (public domain). Reconstruction by NLRB Stats Archive. Read by claude-opus-5 (effort max, prompt extract_v1) from the 300-dpi scan; stitched by page. Updated October 2026.