NLRB Stats Archive › Annual Reports › FY1953 › Geographic Distribution of Collective-Bargaining Elections, Fiscal Year 1953
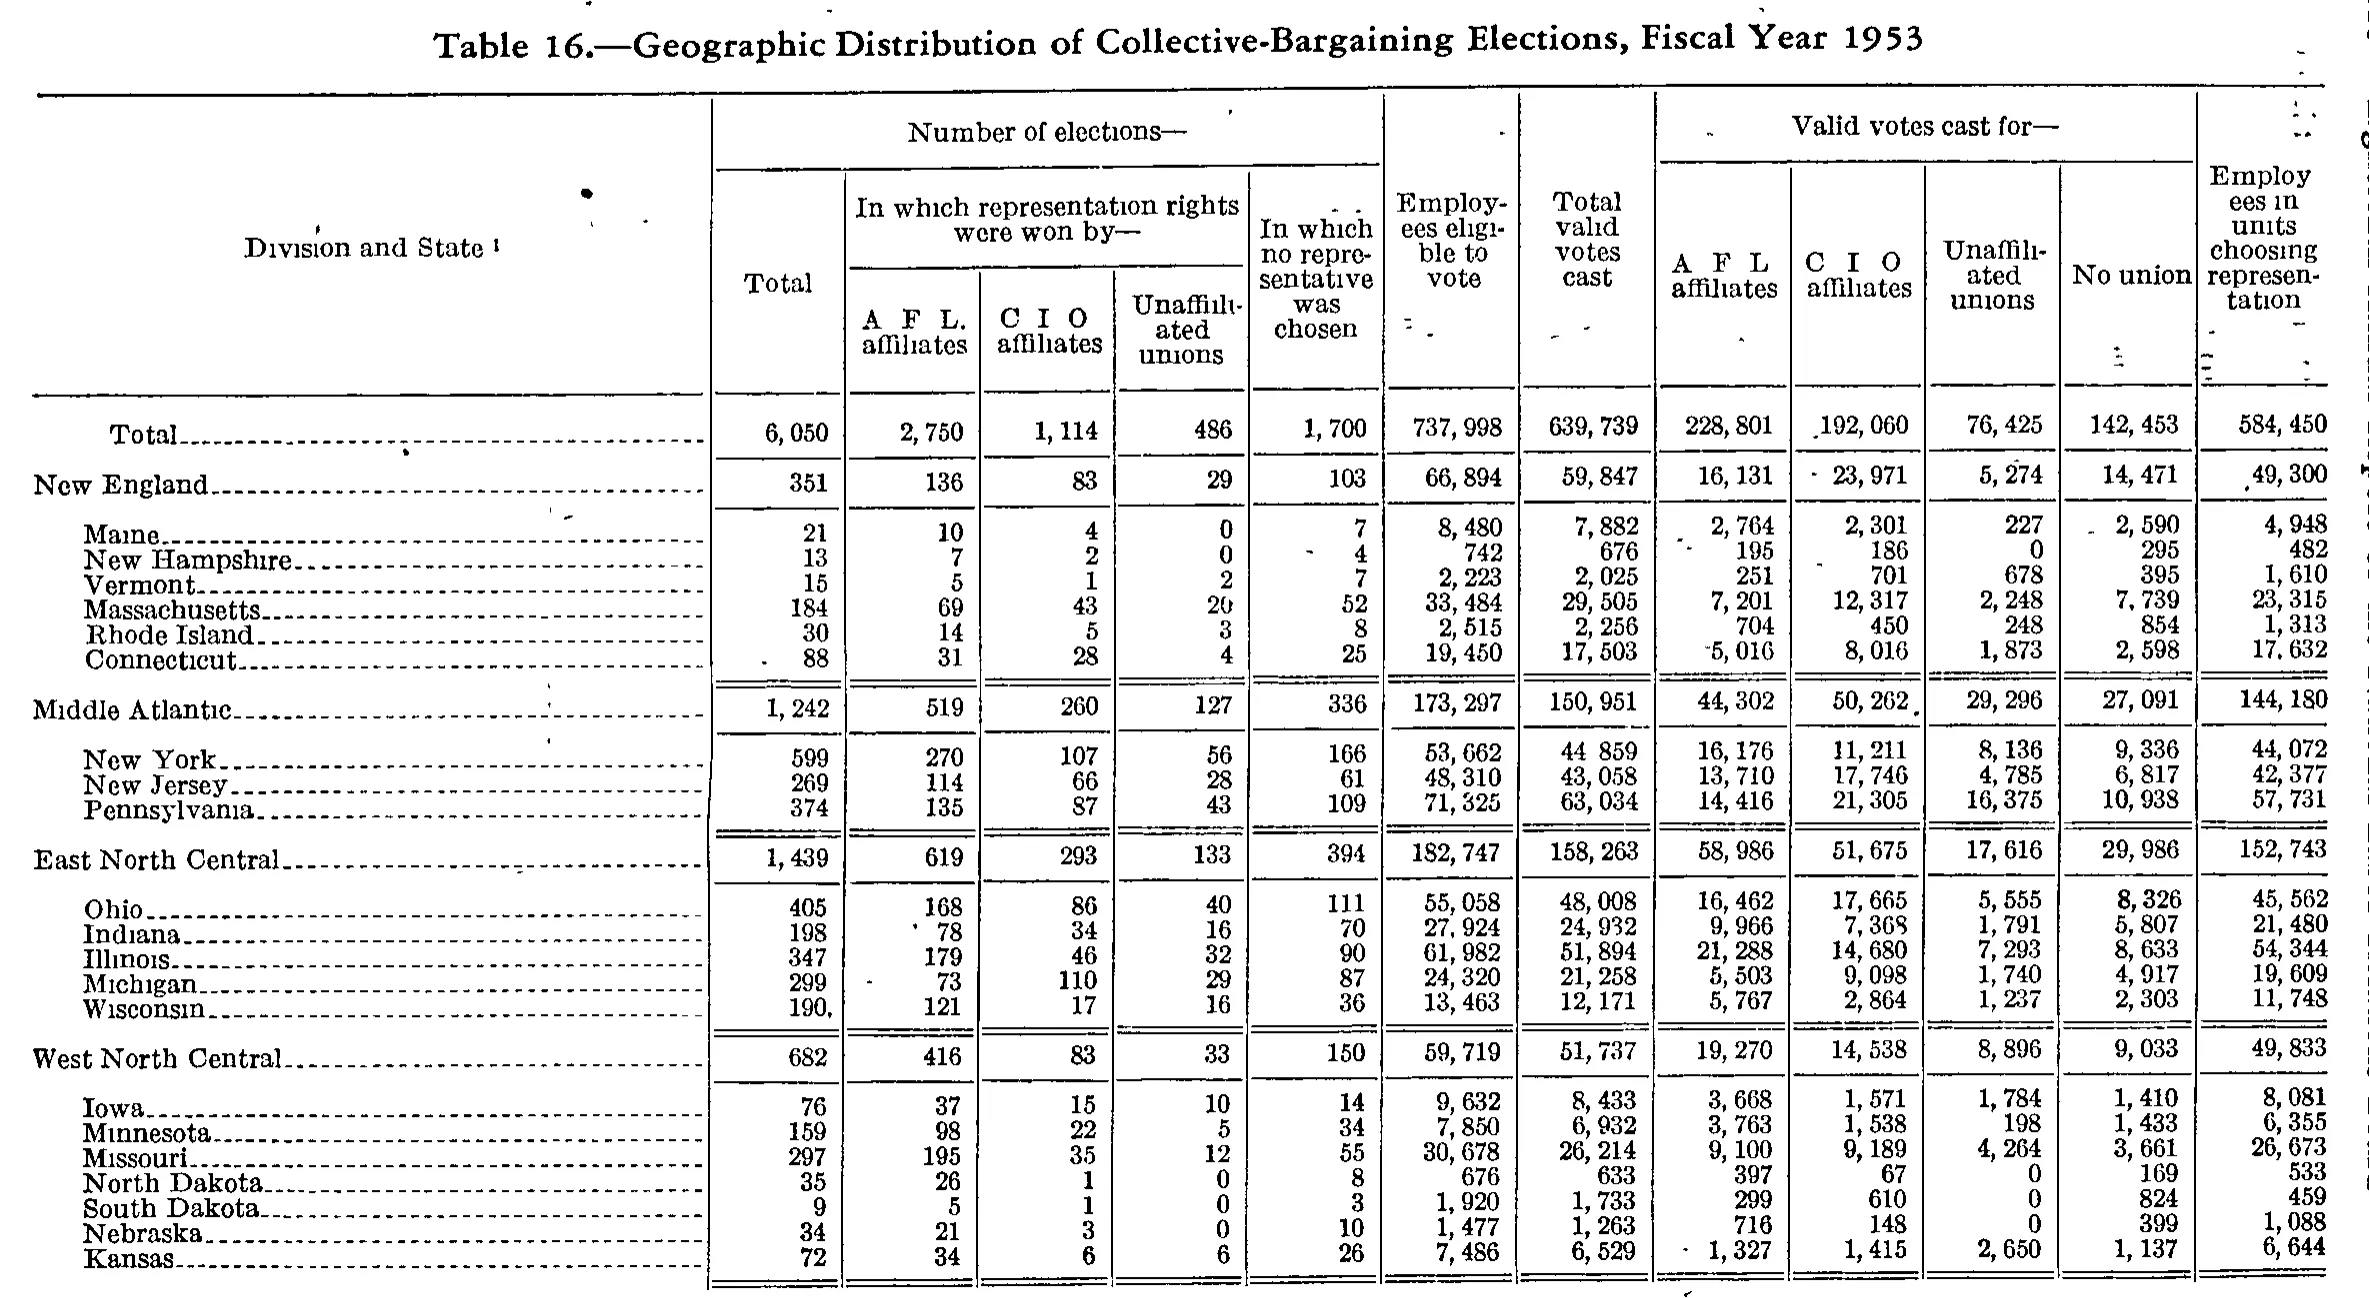
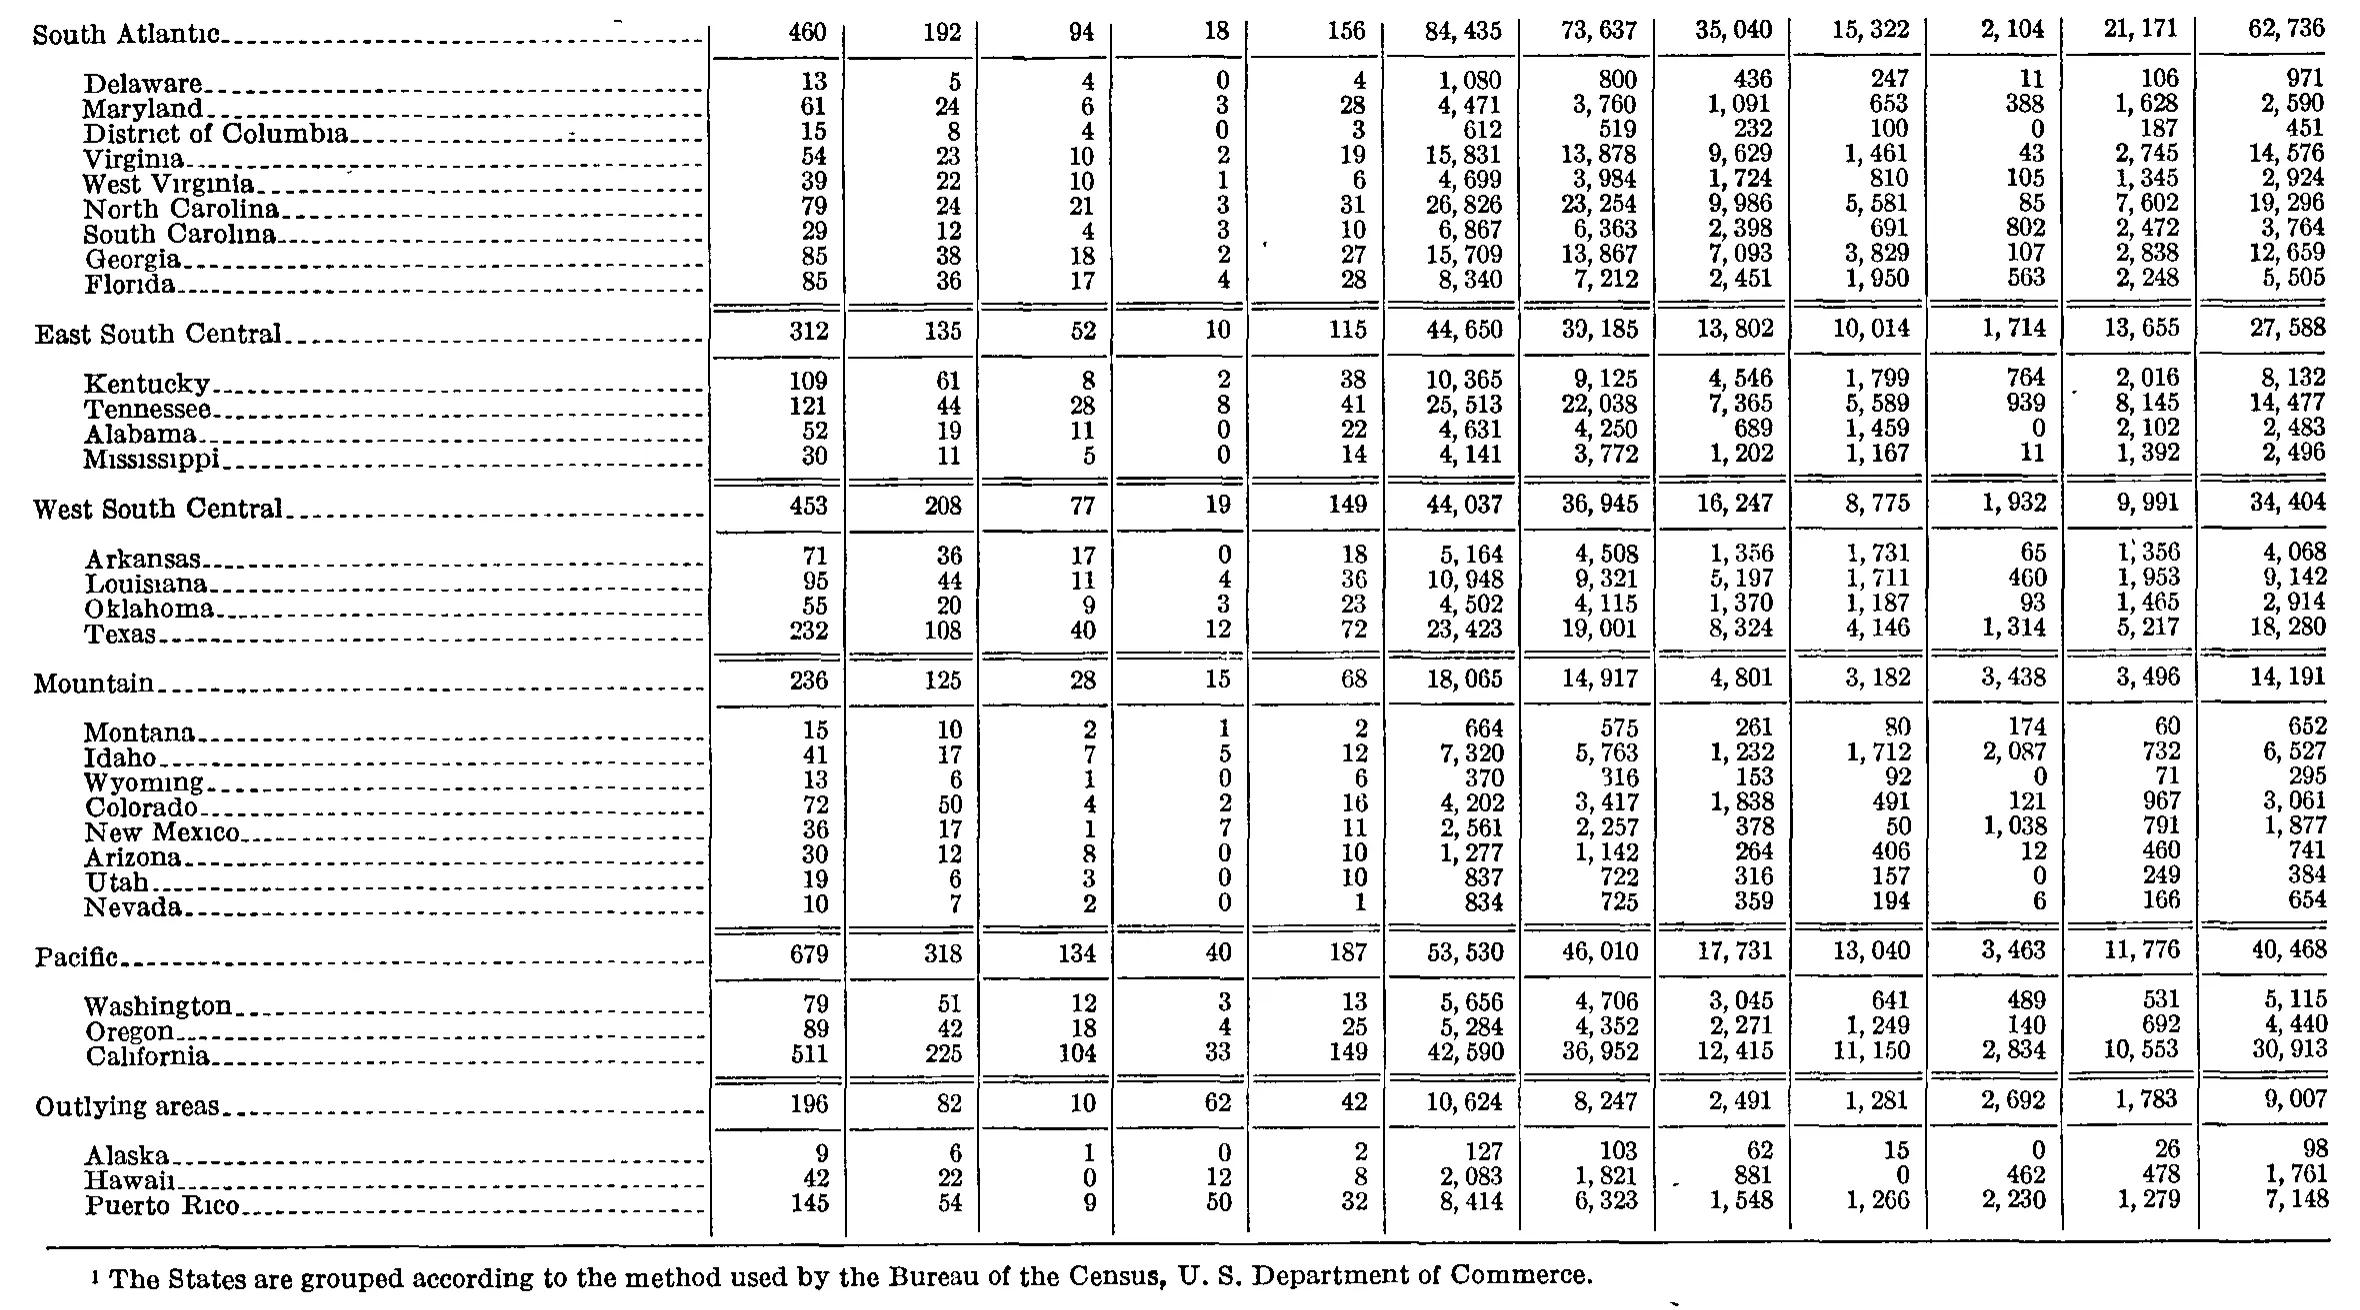
Geographic Distribution of Collective-Bargaining Elections, Fiscal Year 1953
Stitched from pp. 121–122.
| Division and State | Number of elections— | Employees eligible to vote | Total valid votes cast | Valid votes cast for— | Employees in units choosing representation | |||||||
|---|---|---|---|---|---|---|---|---|---|---|---|---|
| Division and State | Total | In which representation rights were won by— | In which no representative was chosen | Employees eligible to vote | Total valid votes cast | A F L affiliates | C I O affiliates | Unaffiliated unions | No union | Employees in units choosing representation | ||
| Division and State | Total | A F L. affiliates | C I O affiliates | Unaffiliated unions | In which no representative was chosen | Employees eligible to vote | Total valid votes cast | A F L affiliates | C I O affiliates | Unaffiliated unions | No union | Employees in units choosing representation |
| Total | 6,050 | 2,750 | 1,114 | 486 | 1,700 | 737,998 | 639,739 | 228,801 | 192,060 | 76,425 | 142,453 | 584,450 |
| New England | 351 | 136 | 83 | 29 | 103 | 66,894 | 59,847 | 16,131 | 23,971 | 5,274 | 14,471 | 49,300 |
| Maine | 21 | 10 | 4 | 0 | 7 | 8,480 | 7,882 | 2,764 | 2,301 | 227 | 2,590 | 4,948 |
| New Hampshire | 13 | 7 | 2 | 0 | 4 | 742 | 676 | 195 | 186 | 0 | 295 | 482 |
| Vermont | 15 | 5 | 1 | 2 | 7 | 2,223 | 2,025 | 251 | 701 | 678 | 395 | 1,610 |
| Massachusetts | 184 | 69 | 43 | 20 | 52 | 33,484 | 29,505 | 7,201 | 12,317 | 2,248 | 7,739 | 23,315 |
| Rhode Island | 30 | 14 | 5 | 3 | 8 | 2,515 | 2,256 | 704 | 450 | 248 | 854 | 1,313 |
| Connecticut | 88 | 31 | 28 | 4 | 25 | 19,450 | 17,503 | 5,016 | 8,016 | 1,873 | 2,598 | 17,632 |
| Middle Atlantic | 1,242 | 519 | 260 | 127 | 336 | 173,297 | 150,951 | 44,302 | 50,262 | 29,296 | 27,091 | 144,180 |
| New York | 599 | 270 | 107 | 56 | 166 | 53,662 | 44,859 | 16,176 | 11,211 | 8,136 | 9,336 | 44,072 |
| New Jersey | 269 | 114 | 66 | 28 | 61 | 48,310 | 43,058 | 13,710 | 17,746 | 4,785 | 6,817 | 42,377 |
| Pennsylvania | 374 | 135 | 87 | 43 | 109 | 71,325 | 63,034 | 14,416 | 21,305 | 16,375 | 10,938 | 57,731 |
| East North Central | 1,439 | 619 | 293 | 133 | 394 | 182,747 | 158,263 | 58,986 | 51,675 | 17,616 | 29,986 | 152,743 |
| Ohio | 405 | 168 | 86 | 40 | 111 | 55,058 | 48,008 | 16,462 | 17,665 | 5,555 | 8,326 | 45,562 |
| Indiana | 198 | 78 | 34 | 16 | 70 | 27,924 | 24,932 | 9,966 | 7,368 | 1,791 | 5,807 | 21,480 |
| Illinois | 347 | 179 | 46 | 32 | 90 | 61,982 | 51,894 | 21,288 | 14,680 | 7,293 | 8,633 | 54,344 |
| Michigan | 299 | 73 | 110 | 29 | 87 | 24,320 | 21,258 | 5,503 | 9,098 | 1,740 | 4,917 | 19,609 |
| Wisconsin | 190 | 121 | 17 | 16 | 36 | 13,463 | 12,171 | 5,767 | 2,864 | 1,237 | 2,303 | 11,748 |
| West North Central | 682 | 416 | 83 | 33 | 150 | 59,719 | 51,737 | 19,270 | 14,538 | 8,896 | 9,033 | 49,833 |
| Iowa | 76 | 37 | 15 | 10 | 14 | 9,632 | 8,433 | 3,668 | 1,571 | 1,784 | 1,410 | 8,081 |
| Minnesota | 159 | 98 | 22 | 5 | 34 | 7,850 | 6,932 | 3,763 | 1,538 | 198 | 1,433 | 6,355 |
| Missouri | 297 | 195 | 35 | 12 | 55 | 30,678 | 26,214 | 9,100 | 9,189 | 4,264 | 3,661 | 26,673 |
| North Dakota | 35 | 26 | 1 | 0 | 8 | 676 | 633 | 397 | 67 | 0 | 169 | 533 |
| South Dakota | 9 | 5 | 1 | 0 | 3 | 1,920 | 1,733 | 299 | 610 | 0 | 824 | 459 |
| Nebraska | 34 | 21 | 3 | 0 | 10 | 1,477 | 1,263 | 716 | 148 | 0 | 399 | 1,088 |
| Kansas | 72 | 34 | 6 | 6 | 26 | 7,486 | 6,529 | 1,327 | 1,415 | 2,650 | 1,137 | 6,644 |
| South Atlantic | 460 | 192 | 94 | 18 | 156 | 84,435 | 73,637 | 35,040 | 15,322 | 2,104 | 21,171 | 62,736 |
| Delaware | 13 | 5 | 4 | 0 | 4 | 1,080 | 800 | 436 | 247 | 11 | 106 | 971 |
| Maryland | 61 | 24 | 6 | 3 | 28 | 4,471 | 3,760 | 1,091 | 653 | 388 | 1,628 | 2,590 |
| District of Columbia | 15 | 8 | 4 | 0 | 3 | 612 | 519 | 232 | 100 | 0 | 187 | 451 |
| Virginia | 54 | 23 | 10 | 2 | 19 | 15,831 | 13,878 | 9,629 | 1,461 | 43 | 2,745 | 14,576 |
| West Virginia | 39 | 22 | 10 | 1 | 6 | 4,699 | 3,984 | 1,724 | 810 | 105 | 1,345 | 2,924 |
| North Carolina | 79 | 24 | 21 | 3 | 31 | 26,826 | 23,254 | 9,986 | 5,581 | 85 | 7,602 | 19,296 |
| South Carolina | 29 | 12 | 4 | 3 | 10 | 6,867 | 6,363 | 2,398 | 691 | 802 | 2,472 | 3,764 |
| Georgia | 85 | 38 | 18 | 2 | 27 | 15,709 | 13,867 | 7,093 | 3,829 | 107 | 2,838 | 12,659 |
| Florida | 85 | 36 | 17 | 4 | 28 | 8,340 | 7,212 | 2,451 | 1,950 | 563 | 2,248 | 5,505 |
| East South Central | 312 | 135 | 52 | 10 | 115 | 44,650 | 39,185 | 13,802 | 10,014 | 1,714 | 13,655 | 27,588 |
| Kentucky | 109 | 61 | 8 | 2 | 38 | 10,365 | 9,125 | 4,546 | 1,799 | 764 | 2,016 | 8,132 |
| Tennessee | 121 | 44 | 28 | 8 | 41 | 25,513 | 22,038 | 7,365 | 5,589 | 939 | 8,145 | 14,477 |
| Alabama | 52 | 19 | 11 | 0 | 22 | 4,631 | 4,250 | 689 | 1,459 | 0 | 2,102 | 2,483 |
| Mississippi | 30 | 11 | 5 | 0 | 14 | 4,141 | 3,772 | 1,202 | 1,167 | 11 | 1,392 | 2,496 |
| West South Central | 453 | 208 | 77 | 19 | 149 | 44,037 | 36,945 | 16,247 | 8,775 | 1,932 | 9,991 | 34,404 |
| Arkansas | 71 | 36 | 17 | 0 | 18 | 5,164 | 4,508 | 1,356 | 1,731 | 65 | 1,356 | 4,068 |
| Louisiana | 95 | 44 | 11 | 4 | 36 | 10,948 | 9,321 | 5,197 | 1,711 | 460 | 1,953 | 9,142 |
| Oklahoma | 55 | 20 | 9 | 3 | 23 | 4,502 | 4,115 | 1,370 | 1,187 | 93 | 1,465 | 2,914 |
| Texas | 232 | 108 | 40 | 12 | 72 | 23,423 | 19,001 | 8,324 | 4,146 | 1,314 | 5,217 | 18,280 |
| Mountain | 236 | 125 | 28 | 15 | 68 | 18,065 | 14,917 | 4,801 | 3,182 | 3,438 | 3,496 | 14,191 |
| Montana | 15 | 10 | 2 | 1 | 2 | 664 | 575 | 261 | 80 | 174 | 60 | 652 |
| Idaho | 41 | 17 | 7 | 5 | 12 | 7,320 | 5,763 | 1,232 | 1,712 | 2,087 | 732 | 6,527 |
| Wyoming | 13 | 6 | 1 | 0 | 6 | 370 | 316 | 153 | 92 | 0 | 71 | 295 |
| Colorado | 72 | 50 | 4 | 2 | 16 | 4,202 | 3,417 | 1,838 | 491 | 121 | 967 | 3,061 |
| New Mexico | 36 | 17 | 1 | 7 | 11 | 2,561 | 2,257 | 378 | 50 | 1,038 | 791 | 1,877 |
| Arizona | 30 | 12 | 8 | 0 | 10 | 1,277 | 1,142 | 264 | 406 | 12 | 460 | 741 |
| Utah | 19 | 6 | 3 | 0 | 10 | 837 | 722 | 316 | 157 | 0 | 249 | 384 |
| Nevada | 10 | 7 | 2 | 0 | 1 | 834 | 725 | 359 | 194 | 6 | 166 | 654 |
| Pacific | 679 | 318 | 134 | 40 | 187 | 53,530 | 46,010 | 17,731 | 13,040 | 3,463 | 11,776 | 40,468 |
| Washington | 79 | 51 | 12 | 3 | 13 | 5,656 | 4,706 | 3,045 | 641 | 489 | 531 | 5,115 |
| Oregon | 89 | 42 | 18 | 4 | 25 | 5,284 | 4,352 | 2,271 | 1,249 | 140 | 692 | 4,440 |
| California | 511 | 225 | 104 | 33 | 149 | 42,590 | 36,952 | 12,415 | 11,150 | 2,834 | 10,553 | 30,913 |
| Outlying areas | 196 | 82 | 10 | 62 | 42 | 10,624 | 8,247 | 2,491 | 1,281 | 2,692 | 1,783 | 9,007 |
| Alaska | 9 | 6 | 1 | 0 | 2 | 127 | 103 | 62 | 15 | 0 | 26 | 98 |
| Hawaii | 42 | 22 | 0 | 12 | 8 | 2,083 | 1,821 | 881 | 0 | 462 | 478 | 1,761 |
| Puerto Rico | 145 | 54 | 9 | 50 | 32 | 8,414 | 6,323 | 1,548 | 1,266 | 2,230 | 1,279 | 7,148 |
- 1 The States are grouped according to the method used by the Bureau of the Census, U. S. Department of Commerce.
730 of 730 figures sit in a row or column sum that works out.
Reader’s notes
p. 121. The table is cut off by the crop: the body ends after "Kansas" at the bottom rule, and the remaining census divisions (South Atlantic, East/West South Central, Mountain, Pacific, etc.) continue on the following page. The footnote keyed by the raised "1" on the stub heading "Division and State" is not printed within this crop, so `footnotes` is empty. Doubtful cells, all transcribed as the arithmetic confirms them: - Wisconsin, "Number of elections / Total": printed as "190," with a stray comma after the digits (a type artifact); transcribed as "190", which equals 121+17+16+36. - New York, "Total valid votes cast": the thousands comma is missing or not inked, printed as "44 859"; transcribed as "44,859", which equals 16,176+11,211+8,136+9,336. - Maine and Connecticut, "Valid votes cast for—A F L affiliates" (2,764 and 5,016) and Massachusetts/Indiana/Michigan "A F L. affiliates" elections column (69, 78, 73): each is preceded by a stray ink mark or dash in the gutter, not a footnote marker or digit; the marks were dropped. - Scan speckles leave faint marks in the heading band (e.g. above "Employees eligible to vote" and in the right margin); they are not footnote markers. Heading note: the elections group prints "A F L." with a terminal period while the valid-votes group prints "A F L" without one; both are kept as printed. Letterspaced initialisms ("A F L", "C I O") are kept with their printed spacing. Verification: for every row the four "Valid votes cast for—" columns sum exactly to "Total valid votes cast", and the four election-outcome columns sum exactly to "Number of elections—Total", including all four division subtotals and the grand Total row. No printed value appears to be a misprint.
p. 122. This crop is a continuation page: no column headings are printed on it, so header_rows is empty. The grid has 13 columns (stub plus 12 numeric columns), read from the vertical column rules. The table begins mid-list with the "South Atlantic" regional line, so the earlier regions (New England through West North Central) and any grand-total line are on the preceding page, outside this crop. The stub column shows only indentation plus leader dots; the regional lines (South Atlantic, East South Central, West South Central, Mountain, Pacific, Outlying areas) are set flush left and carry subtotal values, while the State lines are indented under them. Verification: every one of the 12 numeric columns sums exactly from its State lines to the printed regional line, for all six regions. No arithmetic discrepancy was found, which makes transposition or digit-substitution errors unlikely anywhere in the grid. Two cells worth flagging even though they reconcile: in the Alabama row, column 8 (689) is smaller than column 9 (1,459), the reverse of the pattern in neighbouring rows; and in the New Mexico row, column 9 (50) is unusually small. Both values were confirmed by the regional column sums for East South Central and Mountain respectively, so they are transcribed as printed and are almost certainly correct. Stray ink specks appear in the scan to the right of the South Carolina row (between columns 4 and 5), in the Kentucky row near column 11, and in the Hawaii row near column 8; these are flyspecks, not digits or decimal points, and were not transcribed. A faint stray mark also sits below the footnote rule at the bottom edge.
Source image
Source data: U.S. NLRB Annual Reports (public domain). Reconstruction by NLRB Stats Archive. Read by claude-opus-5 (effort max, prompt extract_v1) from the 300-dpi scan; stitched by page. Updated October 2026.