NLRB Stats Archive › Annual Reports › FY1953 › Size of Units in Collective-Bargaining and Decertification Elections, Fiscal Year 1953
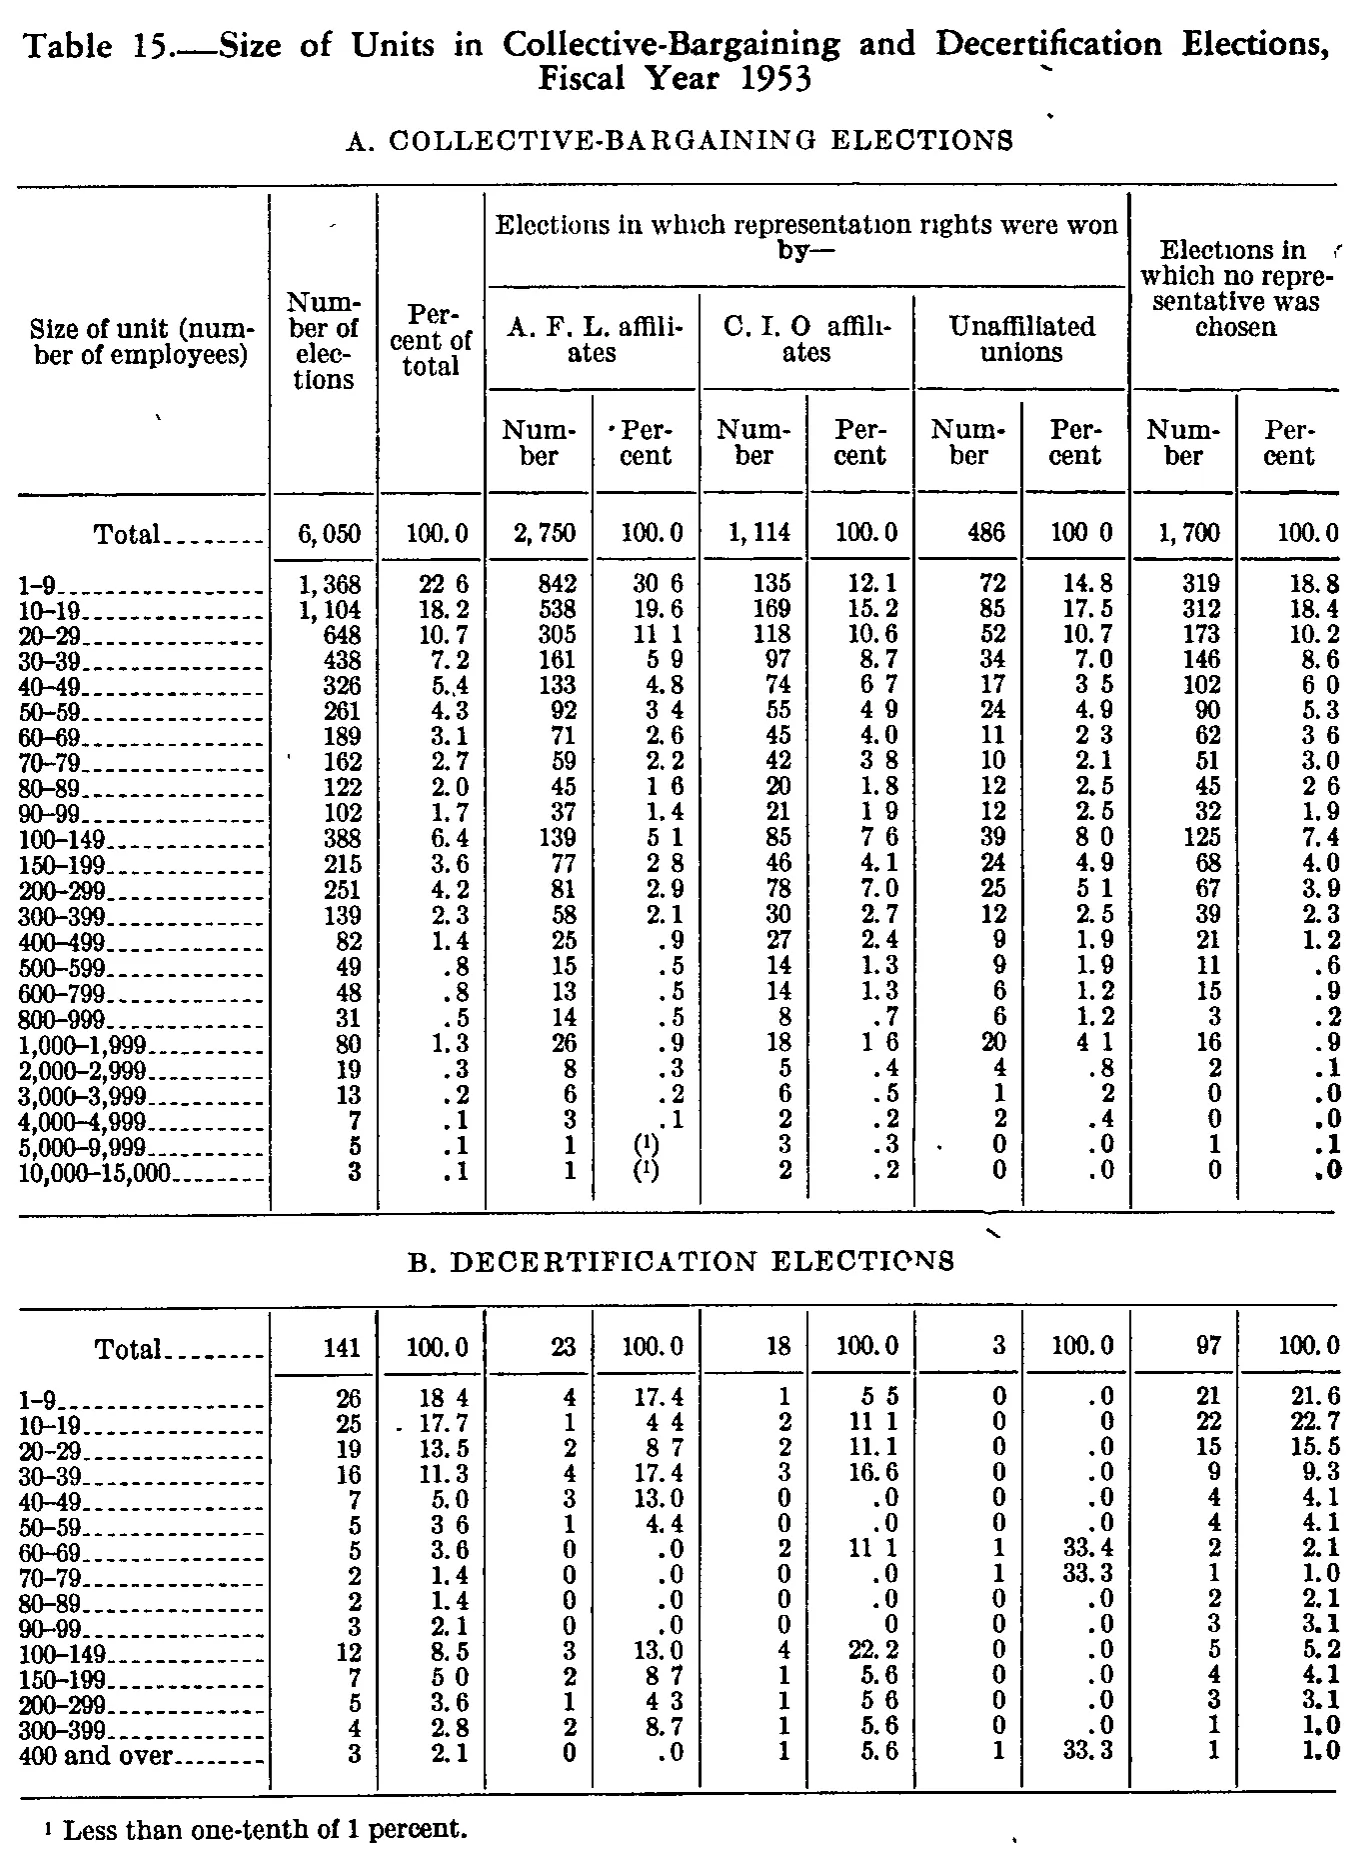
Size of Units in Collective-Bargaining and Decertification Elections, Fiscal Year 1953
| Size of unit (number of employees) | Number of elections | Percent of total | Elections in which representation rights were won by— | Elections in which no representative was chosen | ||||||
|---|---|---|---|---|---|---|---|---|---|---|
| Size of unit (number of employees) | Number of elections | Percent of total | A. F. L. affiliates | C. I. O affiliates | Unaffiliated unions | Elections in which no representative was chosen | ||||
| Size of unit (number of employees) | Number of elections | Percent of total | Number | Percent | Number | Percent | Number | Percent | Number | Percent |
| A. COLLECTIVE-BARGAINING ELECTIONS | ||||||||||
| Total | 6,050 | 100.0 | 2,750 | 100.0 | 1,114 | 100.0 | 486 | 100.0 | 1,700 | 100.0 |
| 1-9 | 1,368 | 22.6 | 842 | 30.6 | 135 | 12.1 | 72 | 14.8 | 319 | 18.8 |
| 10-19 | 1,104 | 18.2 | 538 | 19.6 | 169 | 15.2 | 85 | 17.5 | 312 | 18.4 |
| 20-29 | 648 | 10.7 | 305 | 11.1 | 118 | 10.6 | 52 | 10.7 | 173 | 10.2 |
| 30-39 | 438 | 7.2 | 161 | 5.9 | 97 | 8.7 | 34 | 7.0 | 146 | 8.6 |
| 40-49 | 326 | 5.4 | 133 | 4.8 | 74 | 6.7 | 17 | 3.5 | 102 | 6.0 |
| 50-59 | 261 | 4.3 | 92 | 3.4 | 55 | 4.9 | 24 | 4.9 | 90 | 5.3 |
| 60-69 | 189 | 3.1 | 71 | 2.6 | 45 | 4.0 | 11 | 2.3 | 62 | 3.6 |
| 70-79 | 162 | 2.7 | 59 | 2.2 | 42 | 3.8 | 10 | 2.1 | 51 | 3.0 |
| 80-89 | 122 | 2.0 | 45 | 1.6 | 20 | 1.8 | 12 | 2.5 | 45 | 2.6 |
| 90-99 | 102 | 1.7 | 37 | 1.4 | 21 | 1.9 | 12 | 2.5 | 32 | 1.9 |
| 100-149 | 388 | 6.4 | 139 | 5.1 | 85 | 7.6 | 39 | 8.0 | 125 | 7.4 |
| 150-199 | 215 | 3.6 | 77 | 2.8 | 46 | 4.1 | 24 | 4.9 | 68 | 4.0 |
| 200-299 | 251 | 4.2 | 81 | 2.9 | 78 | 7.0 | 25 | 5.1 | 67 | 3.9 |
| 300-399 | 139 | 2.3 | 58 | 2.1 | 30 | 2.7 | 12 | 2.5 | 39 | 2.3 |
| 400-499 | 82 | 1.4 | 25 | .9 | 27 | 2.4 | 9 | 1.9 | 21 | 1.2 |
| 500-599 | 49 | .8 | 15 | .5 | 14 | 1.3 | 9 | 1.9 | 11 | .6 |
| 600-799 | 48 | .8 | 13 | .5 | 14 | 1.3 | 6 | 1.2 | 15 | .9 |
| 800-999 | 31 | .5 | 14 | .5 | 8 | .7 | 6 | 1.2 | 3 | .2 |
| 1,000-1,999 | 80 | 1.3 | 26 | .9 | 18 | 1.6 | 20 | 4.1 | 16 | .9 |
| 2,000-2,999 | 19 | .3 | 8 | .3 | 5 | .4 | 4 | .8 | 2 | .1 |
| 3,000-3,999 | 13 | .2 | 6 | .2 | 6 | .5 | 1 | .2 | 0 | .0 |
| 4,000-4,999 | 7 | .1 | 3 | .1 | 2 | .2 | 2 | .4 | 0 | .0 |
| 5,000-9,999 | 5 | .1 | 1 | 3 | .3 | 0 | .0 | 1 | .1 | |
| 10,000-15,000 | 3 | .1 | 1 | 2 | .2 | 0 | .0 | 0 | .0 | |
| B. DECERTIFICATION ELECTIONS | ||||||||||
| Total | 141 | 100.0 | 23 | 100.0 | 18 | 100.0 | 3 | 100.0 | 97 | 100.0 |
| 1-9 | 26 | 18.4 | 4 | 17.4 | 1 | 5.5 | 0 | .0 | 21 | 21.6 |
| 10-19 | 25 | 17.7 | 1 | 4.4 | 2 | 11.1 | 0 | .0 | 22 | 22.7 |
| 20-29 | 19 | 13.5 | 2 | 8.7 | 2 | 11.1 | 0 | .0 | 15 | 15.5 |
| 30-39 | 16 | 11.3 | 4 | 17.4 | 3 | 16.6 | 0 | .0 | 9 | 9.3 |
| 40-49 | 7 | 5.0 | 3 | 13.0 | 0 | .0 | 0 | .0 | 4 | 4.1 |
| 50-59 | 5 | 3.6 | 1 | 4.4 | 0 | .0 | 0 | .0 | 4 | 4.1 |
| 60-69 | 5 | 3.6 | 0 | .0 | 2 | 11.1 | 1 | 33.4 | 2 | 2.1 |
| 70-79 | 2 | 1.4 | 0 | .0 | 0 | .0 | 1 | 33.3 | 1 | 1.0 |
| 80-89 | 2 | 1.4 | 0 | .0 | 0 | .0 | 0 | .0 | 2 | 2.1 |
| 90-99 | 3 | 2.1 | 0 | .0 | 0 | .0 | 0 | .0 | 3 | 3.1 |
| 100-149 | 12 | 8.5 | 3 | 13.0 | 4 | 22.2 | 0 | .0 | 5 | 5.2 |
| 150-199 | 7 | 5.0 | 2 | 8.7 | 1 | 5.6 | 0 | .0 | 4 | 4.1 |
| 200-299 | 5 | 3.6 | 1 | 4.3 | 1 | 5.6 | 0 | .0 | 3 | 3.1 |
| 300-399 | 4 | 2.8 | 2 | 8.7 | 1 | 5.6 | 0 | .0 | 1 | 1.0 |
| 400 and over | 3 | 2.1 | 0 | .0 | 1 | 5.6 | 1 | 33.3 | 1 | 1.0 |
- 1 Less than one-tenth of 1 percent.
178 of 178 figures sit in a row or column sum that works out.
Reader’s notes
p. 120. Eleven columns: stub, Number of elections, Percent of total, three two-column union groups under "Elections in which representation rights were won by—", and two columns under "Elections in which no representative was chosen". Structure: the page holds two stacked panels, A (collective-bargaining elections) and B (decertification elections), that share a single set of column headings printed once at the top. The panel label "A. COLLECTIVE-BARGAINING ELECTIONS" is printed above the column headings (between the caption and the table rules) and "B. DECERTIFICATION ELECTIONS" between the two bodies; both are transcribed as label-only section rows in reading order, so row 1 of the grid sits above the heading rows on the page. Decimal points: this scan prints many decimal points faintly or not at all, so numerous percent cells read as a digit gap (e.g. Total/Unaffiliated unions Percent prints as "100 0"; row 1-9 Percent of total as "22 6"; A.F.L. Percent in rows 30-39, 50-59, 80-89, 100-149, 150-199, 1,000-1,999 similarly). Every value in these columns is a one-decimal percentage and all ten percent columns sum exactly to their printed totals, so the gaps are faded periods and I have written the decimal point in each case. Two cells show only "0" with no visible leading period in the Percent column that follows the Unaffiliated unions / C. I. O counts: panel B row 10-19 (Unaffiliated unions Percent) and panel B row 90-99 (C. I. O Percent). I transcribed both as ".0" to match every other zero-percent cell in those columns; the column totals confirm the value is zero either way. The A.F.L. Percent cells for panel A rows 5,000-9,999 and 10,000-15,000 hold a parenthesized superscript 1 in place of a value (the "less than one-tenth of 1 percent" footnote); transcribed as "(^1)". Verification: in both panels all five count columns and all five percent columns add exactly to the printed totals (panel A: 6,050 / 2,750 / 1,114 / 486 / 1,700, and each percent column to 100.0; panel B: 141 / 23 / 18 / 3 / 97, each percent column to 100.0). No internal inconsistencies or suspected misprints found. The group heading over the C. I. O columns is printed "C. I. O affiliates" with no period after the O; transcribed as printed. A stray ink mark precedes the A.F.L. "Percent" heading and the "17.7" in panel B row 10-19; both are scan artifacts, not characters.
Source image
Source data: U.S. NLRB Annual Reports (public domain). Reconstruction by NLRB Stats Archive. Read by claude-opus-5 (effort max, prompt extract_v1) from the 300-dpi scan; stitched by page. Updated October 2026.