NLRB Stats Archive › Annual Reports › FY1953 › Voting in collective-bargaining elections in which a representative was not chosen
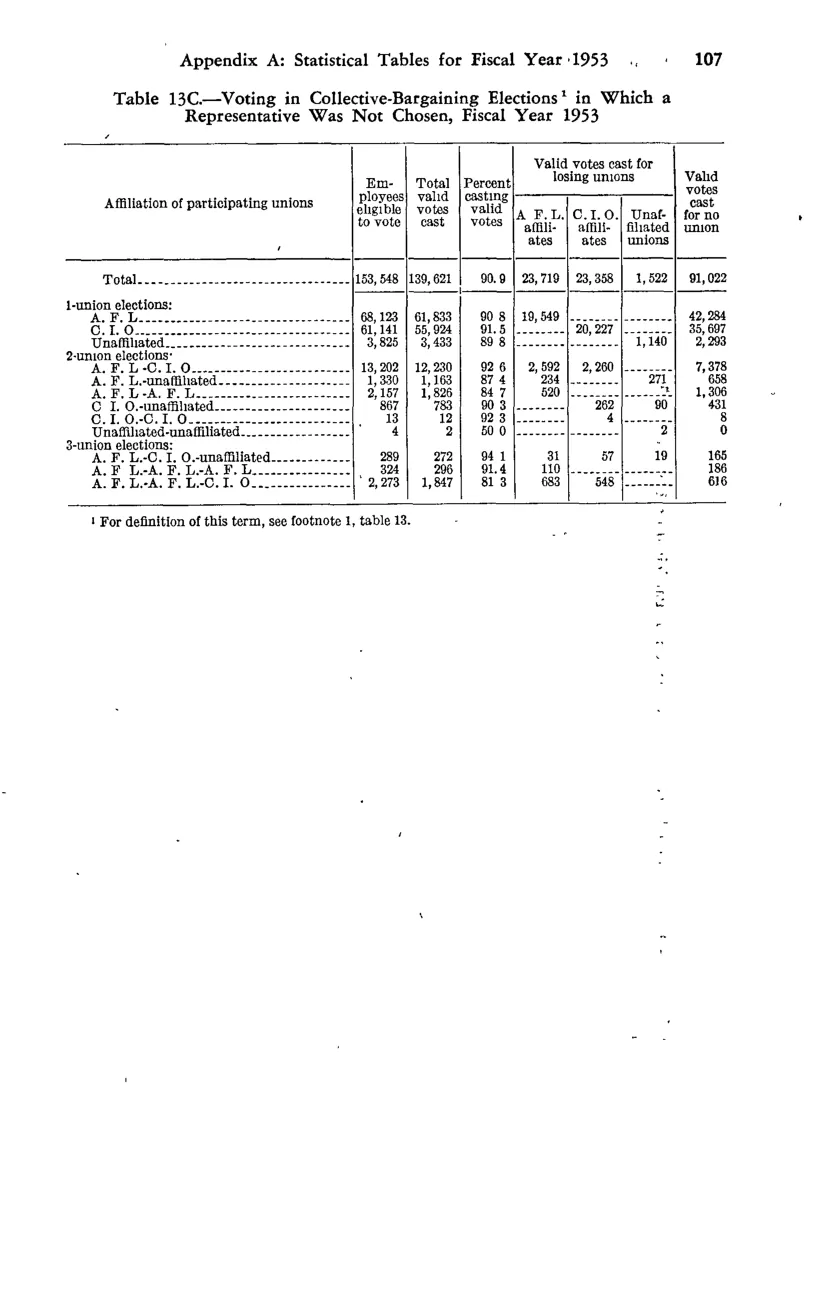
Voting in collective-bargaining elections in which a representative was not chosen
| Affiliation of participating unions | Employees eligible to vote | Total valid votes cast | Percent casting valid votes | Valid votes cast for losing unions | Valid votes cast for losing unions | Valid votes cast for losing unions | Valid votes cast for no union |
|---|---|---|---|---|---|---|---|
| Affiliation of participating unions | Employees eligible to vote | Total valid votes cast | Percent casting valid votes | AFL affiliates | CIO affiliates | Unaffiliated unions | Valid votes cast for no union |
| Total | 153,548 | 139,621 | 90.9 | 23,719 | 23,358 | 1,522 | 91,022 |
| 1-union elections, AFL | 68,123 | 61,833 | 90.8 | 19,549 | 42,284 | ||
| 1-union elections, CIO | 61,141 | 55,924 | 91.5 | 20,227 | 35,697 | ||
| 1-union elections, Unaffiliated | 3,825 | 3,433 | 89.8 | 1,140 | 2,293 | ||
| 2-union elections, AFL-CIO | 13,202 | 12,230 | 92.6 | 2,592 | 2,260 | 7,378 | |
| 2-union elections, AFL-Unaffiliated | 1,330 | 1,163 | 87.4 | 234 | 271 | 658 | |
| 2-union elections, A.F.L.-A.F.L. | 2,157 | 1,825 | 84.7 | 520 | 1,306 | ||
| 2-union elections, CIO-Unaffiliated | 867 | 783 | 90.3 | 262 | 90 | 431 | |
| 2-union elections, C.I.O.-C.I.O. | 13 | 12 | 92.3 | 4 | 8 | ||
| 2-union elections, Unaffiliated-Unaffiliated | 4 | 2 | 50 | 2 | |||
| 3-union elections, AFL-CIO-Unaffiliated | 289 | 272 | 94.1 | 31 | 57 | 19 | 165 |
| 3-union elections, AFL-AFL-AFL | 324 | 296 | 91.4 | 110 | 186 | ||
| 3-union elections, AFL-AFL-CIO | 2,273 | 1,847 | 81.3 | 683 | 548 | 616 |
Source image
Source data: U.S. NLRB Annual Reports (public domain). Reconstruction by NLRB Stats Archive. Updated June 2026.