NLRB Stats Archive › Annual Reports › FY1953 › Results of Union-Shop Deauthorization Polls, Fiscal Year 1953
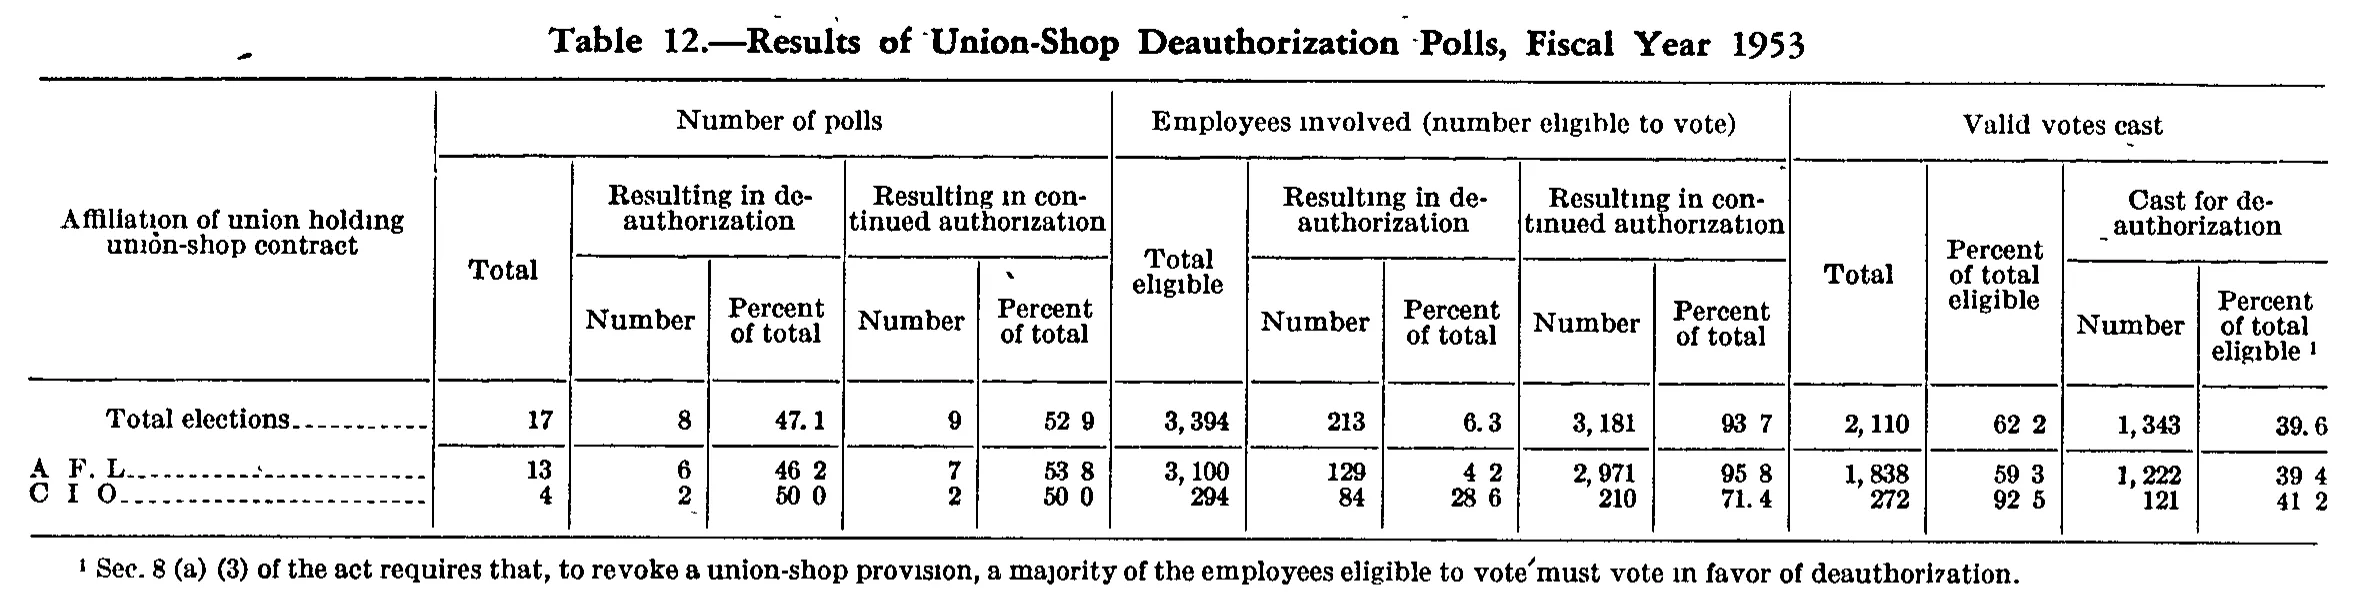
Results of Union-Shop Deauthorization Polls, Fiscal Year 1953
| Affiliation of union holding union-shop contract | Number of polls | Employees involved (number eligible to vote) | Valid votes cast | |||||||||||
|---|---|---|---|---|---|---|---|---|---|---|---|---|---|---|
| Affiliation of union holding union-shop contract | Total | Resulting in deauthorization | Resulting in continued authorization | Total eligible | Resulting in deauthorization | Resulting in continued authorization | Total | Percent of total eligible | Cast for deauthorization | |||||
| Affiliation of union holding union-shop contract | Total | Number | Percent of total | Number | Percent of total | Total eligible | Number | Percent of total | Number | Percent of total | Total | Percent of total eligible | Number | Percent of total eligible |
| Total elections | 17 | 8 | 47.1 | 9 | 52.9 | 3,394 | 213 | 6.3 | 3,181 | 93.7 | 2,110 | 62.2 | 1,343 | 39.6 |
| A. F. L. | 13 | 6 | 46.2 | 7 | 53.8 | 3,100 | 129 | 4.2 | 2,971 | 95.8 | 1,838 | 59.3 | 1,222 | 39.4 |
| C. I. O. | 4 | 2 | 50.0 | 2 | 50.0 | 294 | 84 | 28.6 | 210 | 71.4 | 272 | 92.5 | 121 | 41.2 |
- 1 Sec. 8 (a) (3) of the act requires that, to revoke a union-shop provision, a majority of the employees eligible to vote must vote in favor of deauthorization.
24 of 24 figures sit in a row or column sum that works out.
Reader’s notes
p. 115. Small table, 15 columns, 3 header levels, 3 body rows; nothing is cut off by the crop. Decimal points: many of the percent cells print with the decimal point dropped out or nearly invisible in this 1-bit scan, so the image literally reads "52 9", "93 7", "62 2", "46 2", "53 8", "4 2", "95 8", "59 3", "39 4", "50 0" (twice), "28 6", "92 5", "41 2". All of these are one-decimal percentages in a column whose other cells (47.1, 6.3, 39.6, 71.4) do show the point clearly, and every one of them matches the ratio of the corresponding count to its total, so I transcribed them with the decimal point restored. Row labels: the periods in the stub labels are faint/partly lost among the leader dots; the image reads roughly "A F. L." and "C I O." I transcribed them in the report's standard form, "A. F. L." and "C. I. O." Internal consistency: the two affiliation rows sum exactly to the "Total elections" row in every count column (13+4=17, 6+2=8, 7+2=9, 3,100+294=3,394, 129+84=213, 2,971+210=3,181, 1,838+272=2,110, 1,222+121=1,343), and every printed percent agrees with its computed ratio. No apparent misprints. The footnote marker 1 is attached only to the last column's heading ("Percent of total eligible"), not to the identically worded heading in the "Valid votes cast / Percent of total eligible" column to its left.
Source image
Source data: U.S. NLRB Annual Reports (public domain). Reconstruction by NLRB Stats Archive. Read by claude-opus-5 (effort max, prompt extract_v1) from the 300-dpi scan; stitched by page. Updated October 2026.