NLRB Stats Archive › Annual Reports › FY1953 › Industrial Distribution of Unfair Labor Practice and Representation Cases Received, Fiscal Year 1953
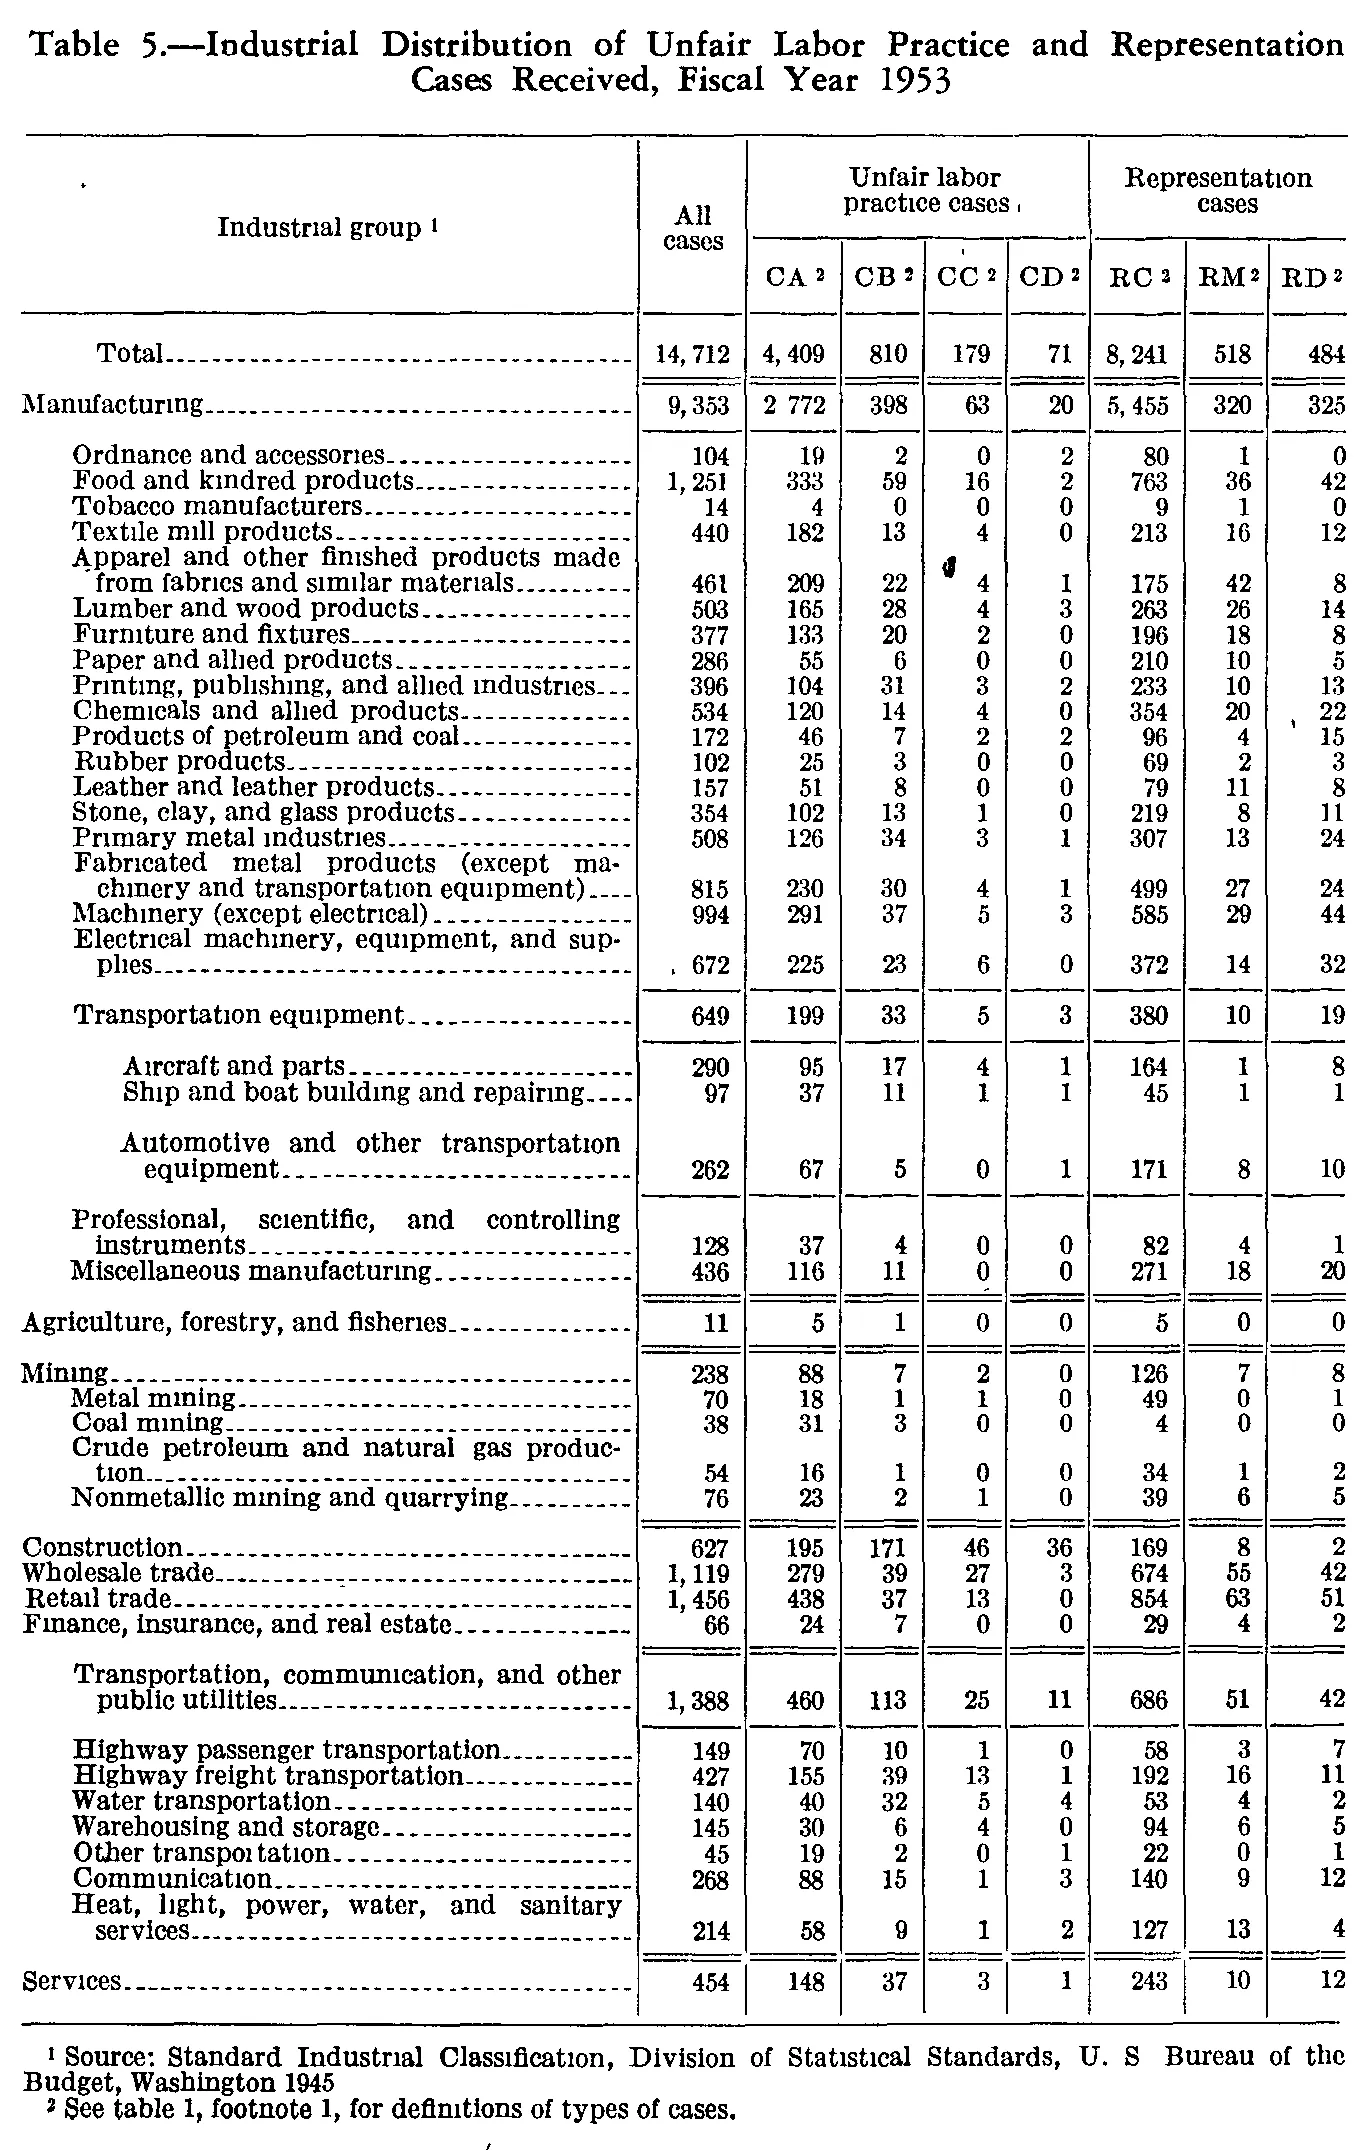
Industrial Distribution of Unfair Labor Practice and Representation Cases Received, Fiscal Year 1953
| Industrial group | All cases | Unfair labor practice cases | Representation cases | |||||
|---|---|---|---|---|---|---|---|---|
| Industrial group | All cases | CA | CB | CC | CD | RC | RM | RD |
| Total | 14,712 | 4,409 | 810 | 179 | 71 | 8,241 | 518 | 484 |
| Manufacturing | 9,353 | 2,772 | 398 | 63 | 20 | 5,455 | 320 | 325 |
| Ordnance and accessories | 104 | 19 | 2 | 0 | 2 | 80 | 1 | 0 |
| Food and kindred products | 1,251 | 333 | 59 | 16 | 2 | 763 | 36 | 42 |
| Tobacco manufacturers | 14 | 4 | 0 | 0 | 0 | 9 | 1 | 0 |
| Textile mill products | 440 | 182 | 13 | 4 | 0 | 213 | 16 | 12 |
| Apparel and other finished products made from fabrics and similar materials | 461 | 209 | 22 | 4 | 1 | 175 | 42 | 8 |
| Lumber and wood products | 503 | 165 | 28 | 4 | 3 | 263 | 26 | 14 |
| Furniture and fixtures | 377 | 133 | 20 | 2 | 0 | 196 | 18 | 8 |
| Paper and allied products | 286 | 55 | 6 | 0 | 0 | 210 | 10 | 5 |
| Printing, publishing, and allied industries | 396 | 104 | 31 | 3 | 2 | 233 | 10 | 13 |
| Chemicals and allied products | 534 | 120 | 14 | 4 | 0 | 354 | 20 | 22 |
| Products of petroleum and coal | 172 | 46 | 7 | 2 | 2 | 96 | 4 | 15 |
| Rubber products | 102 | 25 | 3 | 0 | 0 | 69 | 2 | 3 |
| Leather and leather products | 157 | 51 | 8 | 0 | 0 | 79 | 11 | 8 |
| Stone, clay, and glass products | 354 | 102 | 13 | 1 | 0 | 219 | 8 | 11 |
| Primary metal industries | 508 | 126 | 34 | 3 | 1 | 307 | 13 | 24 |
| Fabricated metal products (except machinery and transportation equipment) | 815 | 230 | 30 | 4 | 1 | 499 | 27 | 24 |
| Machinery (except electrical) | 994 | 291 | 37 | 5 | 3 | 585 | 29 | 44 |
| Electrical machinery, equipment, and supplies | 672 | 225 | 23 | 6 | 0 | 372 | 14 | 32 |
| Transportation equipment | 649 | 199 | 33 | 5 | 3 | 380 | 10 | 19 |
| Aircraft and parts | 290 | 95 | 17 | 4 | 1 | 164 | 1 | 8 |
| Ship and boat building and repairing | 97 | 37 | 11 | 1 | 1 | 45 | 1 | 1 |
| Automotive and other transportation equipment | 262 | 67 | 5 | 0 | 1 | 171 | 8 | 10 |
| Professional, scientific, and controlling instruments | 128 | 37 | 4 | 0 | 0 | 82 | 4 | 1 |
| Miscellaneous manufacturing | 436 | 116 | 11 | 0 | 0 | 271 | 18 | 20 |
| Agriculture, forestry, and fisheries | 11 | 5 | 1 | 0 | 0 | 5 | 0 | 0 |
| Mining | 238 | 88 | 7 | 2 | 0 | 126 | 7 | 8 |
| Metal mining | 70 | 18 | 1 | 1 | 0 | 49 | 0 | 1 |
| Coal mining | 38 | 31 | 3 | 0 | 0 | 4 | 0 | 0 |
| Crude petroleum and natural gas production | 54 | 16 | 1 | 0 | 0 | 34 | 1 | 2 |
| Nonmetallic mining and quarrying | 76 | 23 | 2 | 1 | 0 | 39 | 6 | 5 |
| Construction | 627 | 195 | 171 | 46 | 36 | 169 | 8 | 2 |
| Wholesale trade | 1,119 | 279 | 39 | 27 | 3 | 674 | 55 | 42 |
| Retail trade | 1,456 | 438 | 37 | 13 | 0 | 854 | 63 | 51 |
| Finance, insurance, and real estate | 66 | 24 | 7 | 0 | 0 | 29 | 4 | 2 |
| Transportation, communication, and other public utilities | 1,388 | 460 | 113 | 25 | 11 | 686 | 51 | 42 |
| Highway passenger transportation | 149 | 70 | 10 | 1 | 0 | 58 | 3 | 7 |
| Highway freight transportation | 427 | 155 | 39 | 13 | 1 | 192 | 16 | 11 |
| Water transportation | 140 | 40 | 32 | 5 | 4 | 53 | 4 | 2 |
| Warehousing and storage | 145 | 30 | 6 | 4 | 0 | 94 | 6 | 5 |
| Other transportation | 45 | 19 | 2 | 0 | 1 | 22 | 0 | 1 |
| Communication | 268 | 88 | 15 | 1 | 3 | 140 | 9 | 12 |
| Heat, light, power, water, and sanitary services | 214 | 58 | 9 | 1 | 2 | 127 | 13 | 4 |
| Services | 454 | 148 | 37 | 3 | 1 | 243 | 10 | 12 |
- 1 Source: Standard Industrial Classification, Division of Statistical Standards, U. S Bureau of the Budget, Washington 1945
- 2 See table 1, footnote 1, for definitions of types of cases.
317 of 317 figures sit in a row or column sum that works out.
Reader’s notes
p. 108. Nine columns: stub, All cases, then CA/CB/CC/CD under "Unfair labor practice cases" and RC/RM/RD under "Representation cases". Arithmetic verification: every data row's seven case-type cells sum exactly to its "All cases" value, and each of the eight numeric columns sums (Manufacturing + Agriculture + Mining + Construction + Wholesale + Retail + Finance + Transportation/communication + Services) exactly to the printed Total row; the Manufacturing subtotals likewise equal the sum of their detail lines. No internal inconsistency was found. Doubtful cells, all resolved by that arithmetic: - Manufacturing, CA column: printed as "2 772" with the digit-grouping comma apparently broken or dropped in the typesetting; transcribed as "2,772" (confirmed by the manufacturing detail lines, which sum to 2,772). - "Apparel and other finished products made from fabrics and similar materials", CC column: an ink smudge/stray mark sits just left of the digit; the value reads 4 and is confirmed by the row sum (461). - "Electrical machinery, equipment, and supplies", All cases column: a stray mark precedes 672; read as 672, confirmed by the row sum and the Manufacturing subtotal. - "Chemicals and allied products", RD column: a stray tick mark appears left of 22 in the margin; it is not a footnote marker and the value reads 22, confirmed by the row sum (534). Heading marker: the "RC" column heading's raised marker is faint and could be read as a 3, but the only footnotes printed are 1 and 2, and every other case-type heading (CA, CB, CC, CD, RM, RD) carries a raised 2, so it is transcribed as RC^2. The scan is a 1-bit halftone with some broken serifs (several "i" dots missing in row labels, e.g. "Manufacturing", "Primary metal industries"); row-label spellings are given in their intended modern form as printed.
Source image
Source data: U.S. NLRB Annual Reports (public domain). Reconstruction by NLRB Stats Archive. Read by claude-opus-5 (effort max, prompt extract_v1) from the 300-dpi scan; stitched by page. Updated October 2026.