NLRB Stats Archive › Annual Reports › FY1952 › Size of unit in collective bargaining and decertification elections conducted during fiscal year 1952
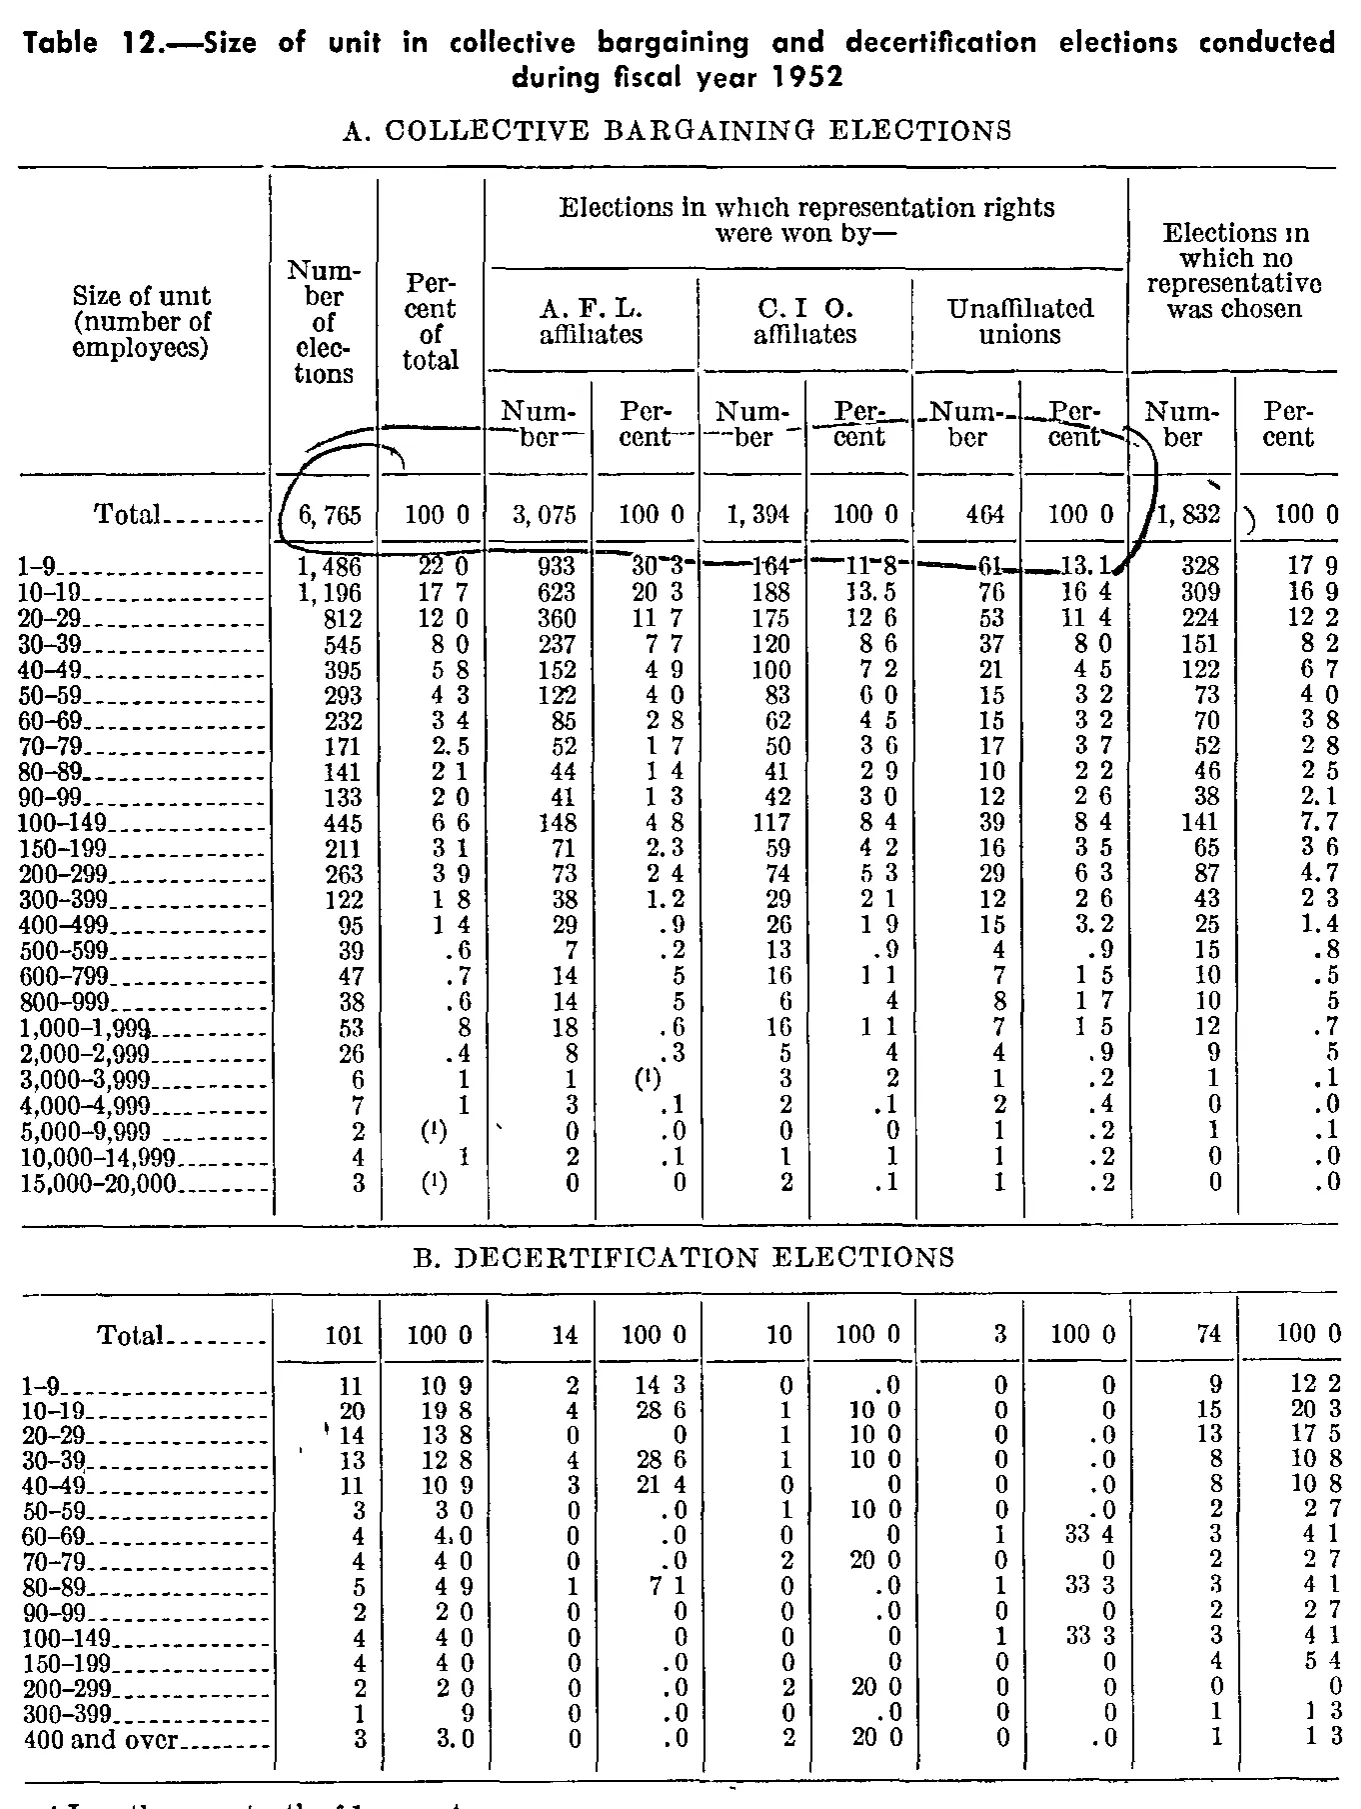
Size of unit in collective bargaining and decertification elections conducted during fiscal year 1952
| Size of unit (number of employees) | Number of elections | Percent of total | Elections in which representation rights were won by— | Elections in which no representative was chosen | ||||||
|---|---|---|---|---|---|---|---|---|---|---|
| Size of unit (number of employees) | Number of elections | Percent of total | A. F. L. affiliates | C. I. O. affiliates | Unaffiliated unions | Elections in which no representative was chosen | ||||
| Size of unit (number of employees) | Number of elections | Percent of total | Number | Percent | Number | Percent | Number | Percent | Number | Percent |
| A. COLLECTIVE BARGAINING ELECTIONS | ||||||||||
| Total | 6,765 | 100.0 | 3,075 | 100.0 | 1,394 | 100.0 | 464 | 100.0 | 1,832 | 100.0 |
| 1-9 | 1,486 | 22.0 | 933 | 30.3 | 164 | 11.8 | 61 | 13.1 | 328 | 17.9 |
| 10-19 | 1,196 | 17.7 | 623 | 20.3 | 188 | 13.5 | 76 | 16.4 | 309 | 16.9 |
| 20-29 | 812 | 12.0 | 360 | 11.7 | 175 | 12.6 | 53 | 11.4 | 224 | 12.2 |
| 30-39 | 545 | 8.0 | 237 | 7.7 | 120 | 8.6 | 37 | 8.0 | 151 | 8.2 |
| 40-49 | 395 | 5.8 | 152 | 4.9 | 100 | 7.2 | 21 | 4.5 | 122 | 6.7 |
| 50-59 | 293 | 4.3 | 122 | 4.0 | 83 | 6.0 | 15 | 3.2 | 73 | 4.0 |
| 60-69 | 232 | 3.4 | 85 | 2.8 | 62 | 4.5 | 15 | 3.2 | 70 | 3.8 |
| 70-79 | 171 | 2.5 | 52 | 1.7 | 50 | 3.6 | 17 | 3.7 | 52 | 2.8 |
| 80-89 | 141 | 2.1 | 44 | 1.4 | 41 | 2.9 | 10 | 2.2 | 46 | 2.5 |
| 90-99 | 133 | 2.0 | 41 | 1.3 | 42 | 3.0 | 12 | 2.6 | 38 | 2.1 |
| 100-149 | 445 | 6.6 | 148 | 4.8 | 117 | 8.4 | 39 | 8.4 | 141 | 7.7 |
| 150-199 | 211 | 3.1 | 71 | 2.3 | 59 | 4.2 | 16 | 3.5 | 65 | 3.6 |
| 200-299 | 263 | 3.9 | 73 | 2.4 | 74 | 5.3 | 29 | 6.3 | 87 | 4.7 |
| 300-399 | 122 | 1.8 | 38 | 1.2 | 29 | 2.1 | 12 | 2.6 | 43 | 2.3 |
| 400-499 | 95 | 1.4 | 29 | .9 | 26 | 1.9 | 15 | 3.2 | 25 | 1.4 |
| 500-599 | 39 | .6 | 7 | .2 | 13 | .9 | 4 | .9 | 15 | .8 |
| 600-799 | 47 | .7 | 14 | .5 | 16 | 1.1 | 7 | 1.5 | 10 | .5 |
| 800-999 | 38 | .6 | 14 | .5 | 6 | .4 | 8 | 1.7 | 10 | .5 |
| 1,000-1,999 | 53 | .8 | 18 | .6 | 16 | 1.1 | 7 | 1.5 | 12 | .7 |
| 2,000-2,999 | 26 | .4 | 8 | .3 | 5 | .4 | 4 | .9 | 9 | .5 |
| 3,000-3,999 | 6 | .1 | 1 | 3 | .2 | 1 | .2 | 1 | .1 | |
| 4,000-4,999 | 7 | .1 | 3 | .1 | 2 | .1 | 2 | .4 | 0 | .0 |
| 5,000-9,999 | 2 | 0 | .0 | 0 | 0 | 1 | .2 | 1 | .1 | |
| 10,000-14,999 | 4 | .1 | 2 | .1 | 1 | .1 | 1 | .2 | 0 | .0 |
| 15,000-20,000 | 3 | 0 | 0 | 2 | .1 | 1 | .2 | 0 | .0 | |
| B. DECERTIFICATION ELECTIONS | ||||||||||
| Total | 101 | 100.0 | 14 | 100.0 | 10 | 100.0 | 3 | 100.0 | 74 | 100.0 |
| 1-9 | 11 | 10.9 | 2 | 14.3 | 0 | .0 | 0 | 0 | 9 | 12.2 |
| 10-19 | 20 | 19.8 | 4 | 28.6 | 1 | 10.0 | 0 | 0 | 15 | 20.3 |
| 20-29 | 14 | 13.8 | 0 | 0 | 1 | 10.0 | 0 | .0 | 13 | 17.5 |
| 30-39 | 13 | 12.8 | 4 | 28.6 | 1 | 10.0 | 0 | .0 | 8 | 10.8 |
| 40-49 | 11 | 10.9 | 3 | 21.4 | 0 | 0 | 0 | .0 | 8 | 10.8 |
| 50-59 | 3 | 3.0 | 0 | .0 | 1 | 10.0 | 0 | .0 | 2 | 2.7 |
| 60-69 | 4 | 4.0 | 0 | .0 | 0 | 0 | 1 | 33.4 | 3 | 4.1 |
| 70-79 | 4 | 4.0 | 0 | .0 | 2 | 20.0 | 0 | 0 | 2 | 2.7 |
| 80-89 | 5 | 4.9 | 1 | 7.1 | 0 | .0 | 1 | 33.3 | 3 | 4.1 |
| 90-99 | 2 | 2.0 | 0 | 0 | 0 | 0 | 0 | 0 | 2 | 2.7 |
| 100-149 | 4 | 4.0 | 0 | 0 | 0 | 0 | 1 | 33.3 | 3 | 4.1 |
| 150-199 | 4 | 4.0 | 0 | .0 | 0 | 0 | 0 | 0 | 4 | 5.4 |
| 200-299 | 2 | 2.0 | 0 | .0 | 2 | 20.0 | 0 | 0 | 0 | 0 |
| 300-399 | 1 | .9 | 0 | .0 | 0 | 0 | 0 | 0 | 1 | 1.3 |
| 400 and over | 3 | 3.0 | 0 | .0 | 2 | 20.0 | 0 | .0 | 1 | 1.3 |
- 1 Less than one-tenth of 1 percent.
173 of 173 figures sit in a row or column sum that works out.
Reader’s notes
p. 305. Structure: one table with 11 columns and two stacked panels, "A. COLLECTIVE BARGAINING ELECTIONS" (printed between the caption and the column headings) and "B. DECERTIFICATION ELECTIONS" (printed mid-page); both are transcribed as label-only section rows. The column headings are printed once, above panel A, and panel B reuses them. Decimal points: this is a 1-bit scan in which the period of most decimal fractions has dropped out, so the percent columns largely read as "100 0", "22 0", "30 3", "8" etc. I have restored the decimal points ("100.0", "22.0", "30.3", ".8"), since the percent columns are unambiguously one-decimal percentages and every restored value is confirmed by recomputation against the printed counts and totals. Cells where the scan shows a bare "0" with no visible point in a percent column are left as "0"; cells where the point is visible are written ".0". That "0" vs ".0" distinction in the zero-percent cells is the least reliable part of this transcription. Footnote-reference cells: three cells carry the footnote reference in place of a value, printed as a parenthesised raised 1. They are written "(^1)": panel A, row 3,000-3,999, column "A. F. L. affiliates / Number... Percent"; panel A, row 5,000-9,999, column "Percent of total"; panel A, row 15,000-20,000, column "Percent of total". In panel A rows 3,000-3,999, 4,000-4,999 and 10,000-14,999 the "Percent of total" cell shows a bare "1" with no parentheses and no visible point; I read these as ".1". For 10,000-14,999 that is arithmetically odd (4/6,765 = 0.06 percent, which should be the "(1)" reference like the 5,000-9,999 row), so that one cell may instead be a "(1)" whose parentheses were lost in the scan. Hand annotation: a heavy hand-drawn ink loop runs across the "Total" row and the "1-9" row of panel A, enclosing the "Number of elections" total and sweeping right to the "Elections in which no representative was chosen" column. It overstrikes parts of the 1-9 row's percent figures; those values are nevertheless legible and all check out against the counts. Arithmetic checks: all five numeric columns of panel A sum exactly to the printed totals (6,765 / 3,075 / 1,394 / 464 / 1,832), as do all five of panel B (101 / 14 / 10 / 3 / 74). Printed roundings transcribed as-is, not corrected: panel A row 30-39 "Percent of total" prints 8.0 where 545/6,765 gives 8.1. Panel B uses truncation rather than rounding in several rows (20-29 prints 13.8 and 17.5; 30-39 prints 12.8; 80-89 prints 4.9; 300-399 prints .9 and 1.3). Panel B "Unaffiliated unions / Percent" prints 33.4 for row 60-69 against 33.3 for rows 80-89 and 100-149; 33.4 is what is printed and makes the column total 100.0. Heading wording: "C. I. O. affiliates" is printed with the period after the "I" missing in the scan ("C. I O."); I have written the standard form. The footnote line at the foot of the page is clipped by the bottom edge of the crop — only the upper part of the letters is visible — so "1 Less than one-tenth of 1 percent." is read partly from letter shapes and from the standard wording used with this reference elsewhere in the report.
Source image
Source data: U.S. NLRB Annual Reports (public domain). Reconstruction by NLRB Stats Archive. Read by claude-opus-5 (effort max, prompt extract_v1) from the 300-dpi scan; stitched by page. Updated October 2026.