NLRB Stats Archive › Annual Reports › FY1952 › Industrial distribution of unfair labor practice and representation cases received, fiscal year 1952
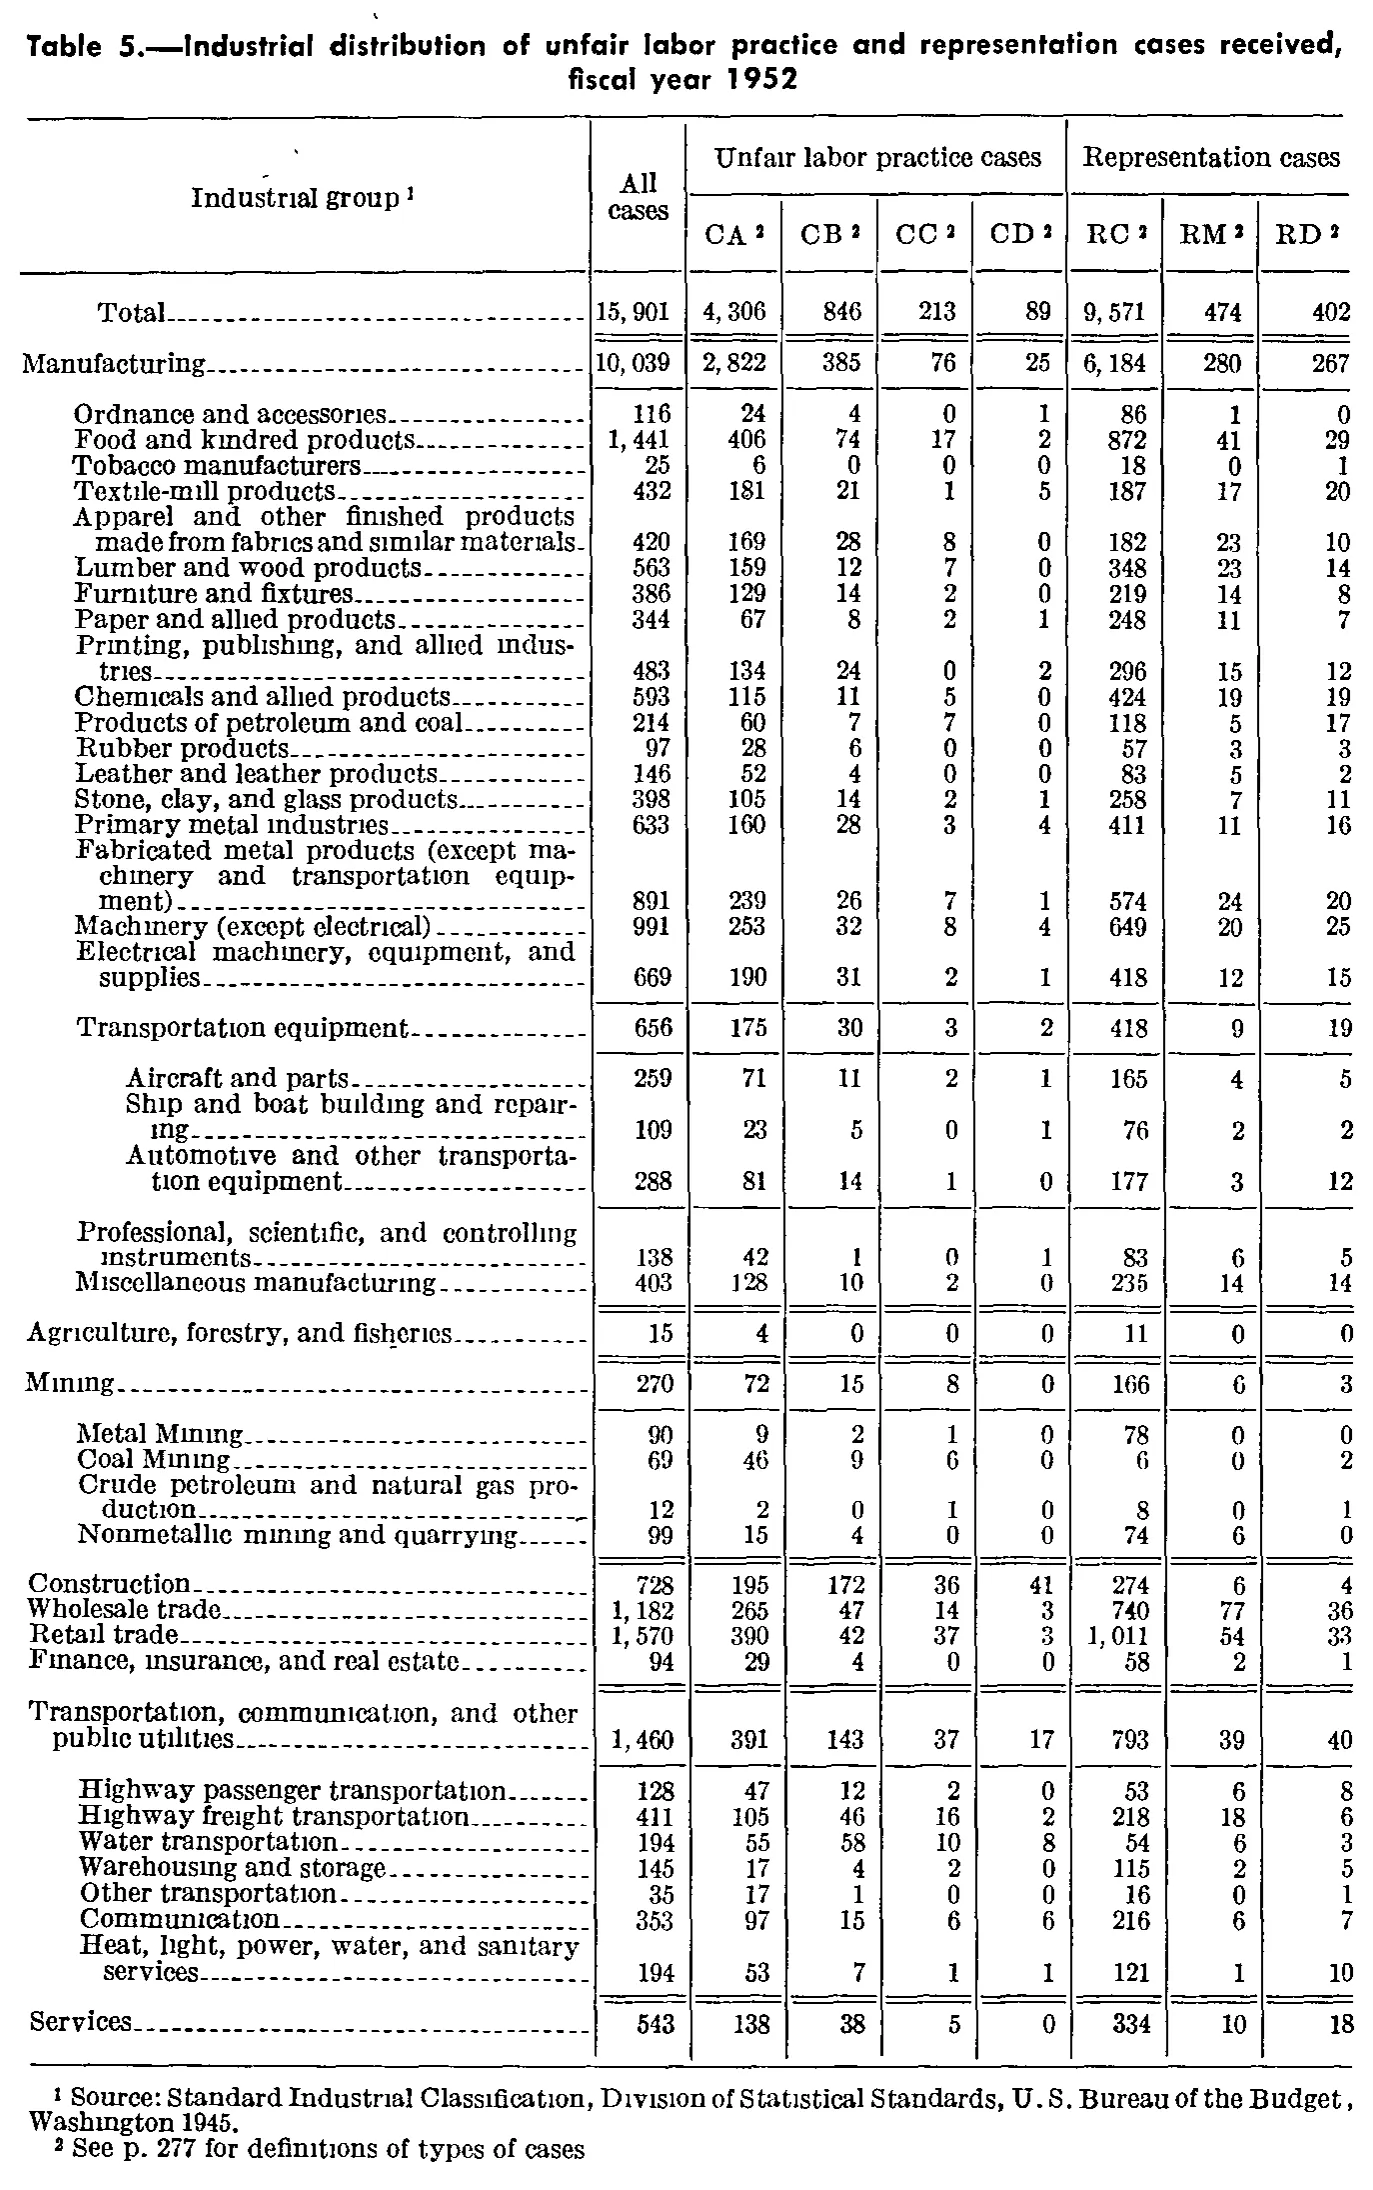
Industrial distribution of unfair labor practice and representation cases received, fiscal year 1952
| Industrial group | All cases | Unfair labor practice cases | Representation cases | |||||
|---|---|---|---|---|---|---|---|---|
| Industrial group | All cases | CA | CB | CC | CD | RC | RM | RD |
| Total | 15,901 | 4,306 | 846 | 213 | 89 | 9,571 | 474 | 402 |
| Manufacturing | 10,039 | 2,822 | 385 | 76 | 25 | 6,184 | 280 | 267 |
| Ordnance and accessories | 116 | 24 | 4 | 0 | 1 | 86 | 1 | 0 |
| Food and kindred products | 1,441 | 406 | 74 | 17 | 2 | 872 | 41 | 29 |
| Tobacco manufacturers | 25 | 6 | 0 | 0 | 0 | 18 | 0 | 1 |
| Textile-mill products | 432 | 181 | 21 | 1 | 5 | 187 | 17 | 20 |
| Apparel and other finished products made from fabrics and similar materials | 420 | 169 | 28 | 8 | 0 | 182 | 23 | 10 |
| Lumber and wood products | 563 | 159 | 12 | 7 | 0 | 348 | 23 | 14 |
| Furniture and fixtures | 386 | 129 | 14 | 2 | 0 | 219 | 14 | 8 |
| Paper and allied products | 344 | 67 | 8 | 2 | 1 | 248 | 11 | 7 |
| Printing, publishing, and allied industries | 483 | 134 | 24 | 0 | 2 | 296 | 15 | 12 |
| Chemicals and allied products | 593 | 115 | 11 | 5 | 0 | 424 | 19 | 19 |
| Products of petroleum and coal | 214 | 60 | 7 | 7 | 0 | 118 | 5 | 17 |
| Rubber products | 97 | 28 | 6 | 0 | 0 | 57 | 3 | 3 |
| Leather and leather products | 146 | 52 | 4 | 0 | 0 | 83 | 5 | 2 |
| Stone, clay, and glass products | 398 | 105 | 14 | 2 | 1 | 258 | 7 | 11 |
| Primary metal industries | 633 | 160 | 28 | 3 | 4 | 411 | 11 | 16 |
| Fabricated metal products (except machinery and transportation equipment) | 891 | 239 | 26 | 7 | 1 | 574 | 24 | 20 |
| Machinery (except electrical) | 991 | 253 | 32 | 8 | 4 | 649 | 20 | 25 |
| Electrical machinery, equipment, and supplies | 669 | 190 | 31 | 2 | 1 | 418 | 12 | 15 |
| Transportation equipment | 656 | 175 | 30 | 3 | 2 | 418 | 9 | 19 |
| Aircraft and parts | 259 | 71 | 11 | 2 | 1 | 165 | 4 | 5 |
| Ship and boat building and repairing | 109 | 23 | 5 | 0 | 1 | 76 | 2 | 2 |
| Automotive and other transportation equipment | 288 | 81 | 14 | 1 | 0 | 177 | 3 | 12 |
| Professional, scientific, and controlling instruments | 138 | 42 | 1 | 0 | 1 | 83 | 6 | 5 |
| Miscellaneous manufacturing | 403 | 128 | 10 | 2 | 0 | 235 | 14 | 14 |
| Agriculture, forestry, and fisheries | 15 | 4 | 0 | 0 | 0 | 11 | 0 | 0 |
| Mining | 270 | 72 | 15 | 8 | 0 | 166 | 6 | 3 |
| Metal Mining | 90 | 9 | 2 | 1 | 0 | 78 | 0 | 0 |
| Coal Mining | 69 | 46 | 9 | 6 | 0 | 6 | 0 | 2 |
| Crude petroleum and natural gas production | 12 | 2 | 0 | 1 | 0 | 8 | 0 | 1 |
| Nonmetallic mining and quarrying | 99 | 15 | 4 | 0 | 0 | 74 | 6 | 0 |
| Construction | 728 | 195 | 172 | 36 | 41 | 274 | 6 | 4 |
| Wholesale trade | 1,182 | 265 | 47 | 14 | 3 | 740 | 77 | 36 |
| Retail trade | 1,570 | 390 | 42 | 37 | 3 | 1,011 | 54 | 33 |
| Finance, insurance, and real estate | 94 | 29 | 4 | 0 | 0 | 58 | 2 | 1 |
| Transportation, communication, and other public utilities | 1,460 | 391 | 143 | 37 | 17 | 793 | 39 | 40 |
| Highway passenger transportation | 128 | 47 | 12 | 2 | 0 | 53 | 6 | 8 |
| Highway freight transportation | 411 | 105 | 46 | 16 | 2 | 218 | 18 | 6 |
| Water transportation | 194 | 55 | 58 | 10 | 8 | 54 | 6 | 3 |
| Warehousing and storage | 145 | 17 | 4 | 2 | 0 | 115 | 2 | 5 |
| Other transportation | 35 | 17 | 1 | 0 | 0 | 16 | 0 | 1 |
| Communication | 353 | 97 | 15 | 6 | 6 | 216 | 6 | 7 |
| Heat, light, power, water, and sanitary services | 194 | 53 | 7 | 1 | 1 | 121 | 1 | 10 |
| Services | 543 | 138 | 38 | 5 | 0 | 334 | 10 | 18 |
- 1 Source: Standard Industrial Classification, Division of Statistical Standards, U. S. Bureau of the Budget, Washington 1945.
- 2 See p. 277 for definitions of types of cases
315 of 315 figures sit in a row or column sum that works out.
Reader’s notes
p. 296. Nine columns: stub plus All cases, CA/CB/CC/CD (under "Unfair labor practice cases") and RC/RM/RD (under "Representation cases"). Arithmetic checks all pass, which supports the digit readings: every data row's seven case-type cells sum to its "All cases" value; the 21 manufacturing detail rows sum to Manufacturing 10,039; the three Transportation-equipment sub-rows (Aircraft, Ship and boat, Automotive) sum to 656; the four Mining sub-rows sum to 270 column by column; the seven Transportation/communication sub-rows sum to 1,460; and the nine major-division rows sum to Total 15,901. No misprints detected. Capitalisation kept as printed: "Metal Mining" and "Coal Mining" carry a capital M on "Mining" while all neighbouring stub labels are lower-case after the first word. Two readings worth flagging even though both are confirmed by their row sums: Water transportation has CB 58 greater than CA 55 (the only such row), and Products of petroleum and coal has RD 17 against RM 5. Footnote 2 is printed without a closing period. Indentation (major division / detail / sub-detail) is not representable in the flat grid; Transportation equipment and its three sub-rows, and Mining and its four sub-rows, are detail-level groups whose sub-rows are indented one step further in the original.
Source image
Source data: U.S. NLRB Annual Reports (public domain). Reconstruction by NLRB Stats Archive. Read by claude-opus-5 (effort max, prompt extract_v1) from the 300-dpi scan; stitched by page. Updated October 2026.