NLRB Stats Archive › Annual Reports › FY1952 › Geographic distribution of unfair labor practice and representation cases received, fiscal year 1952
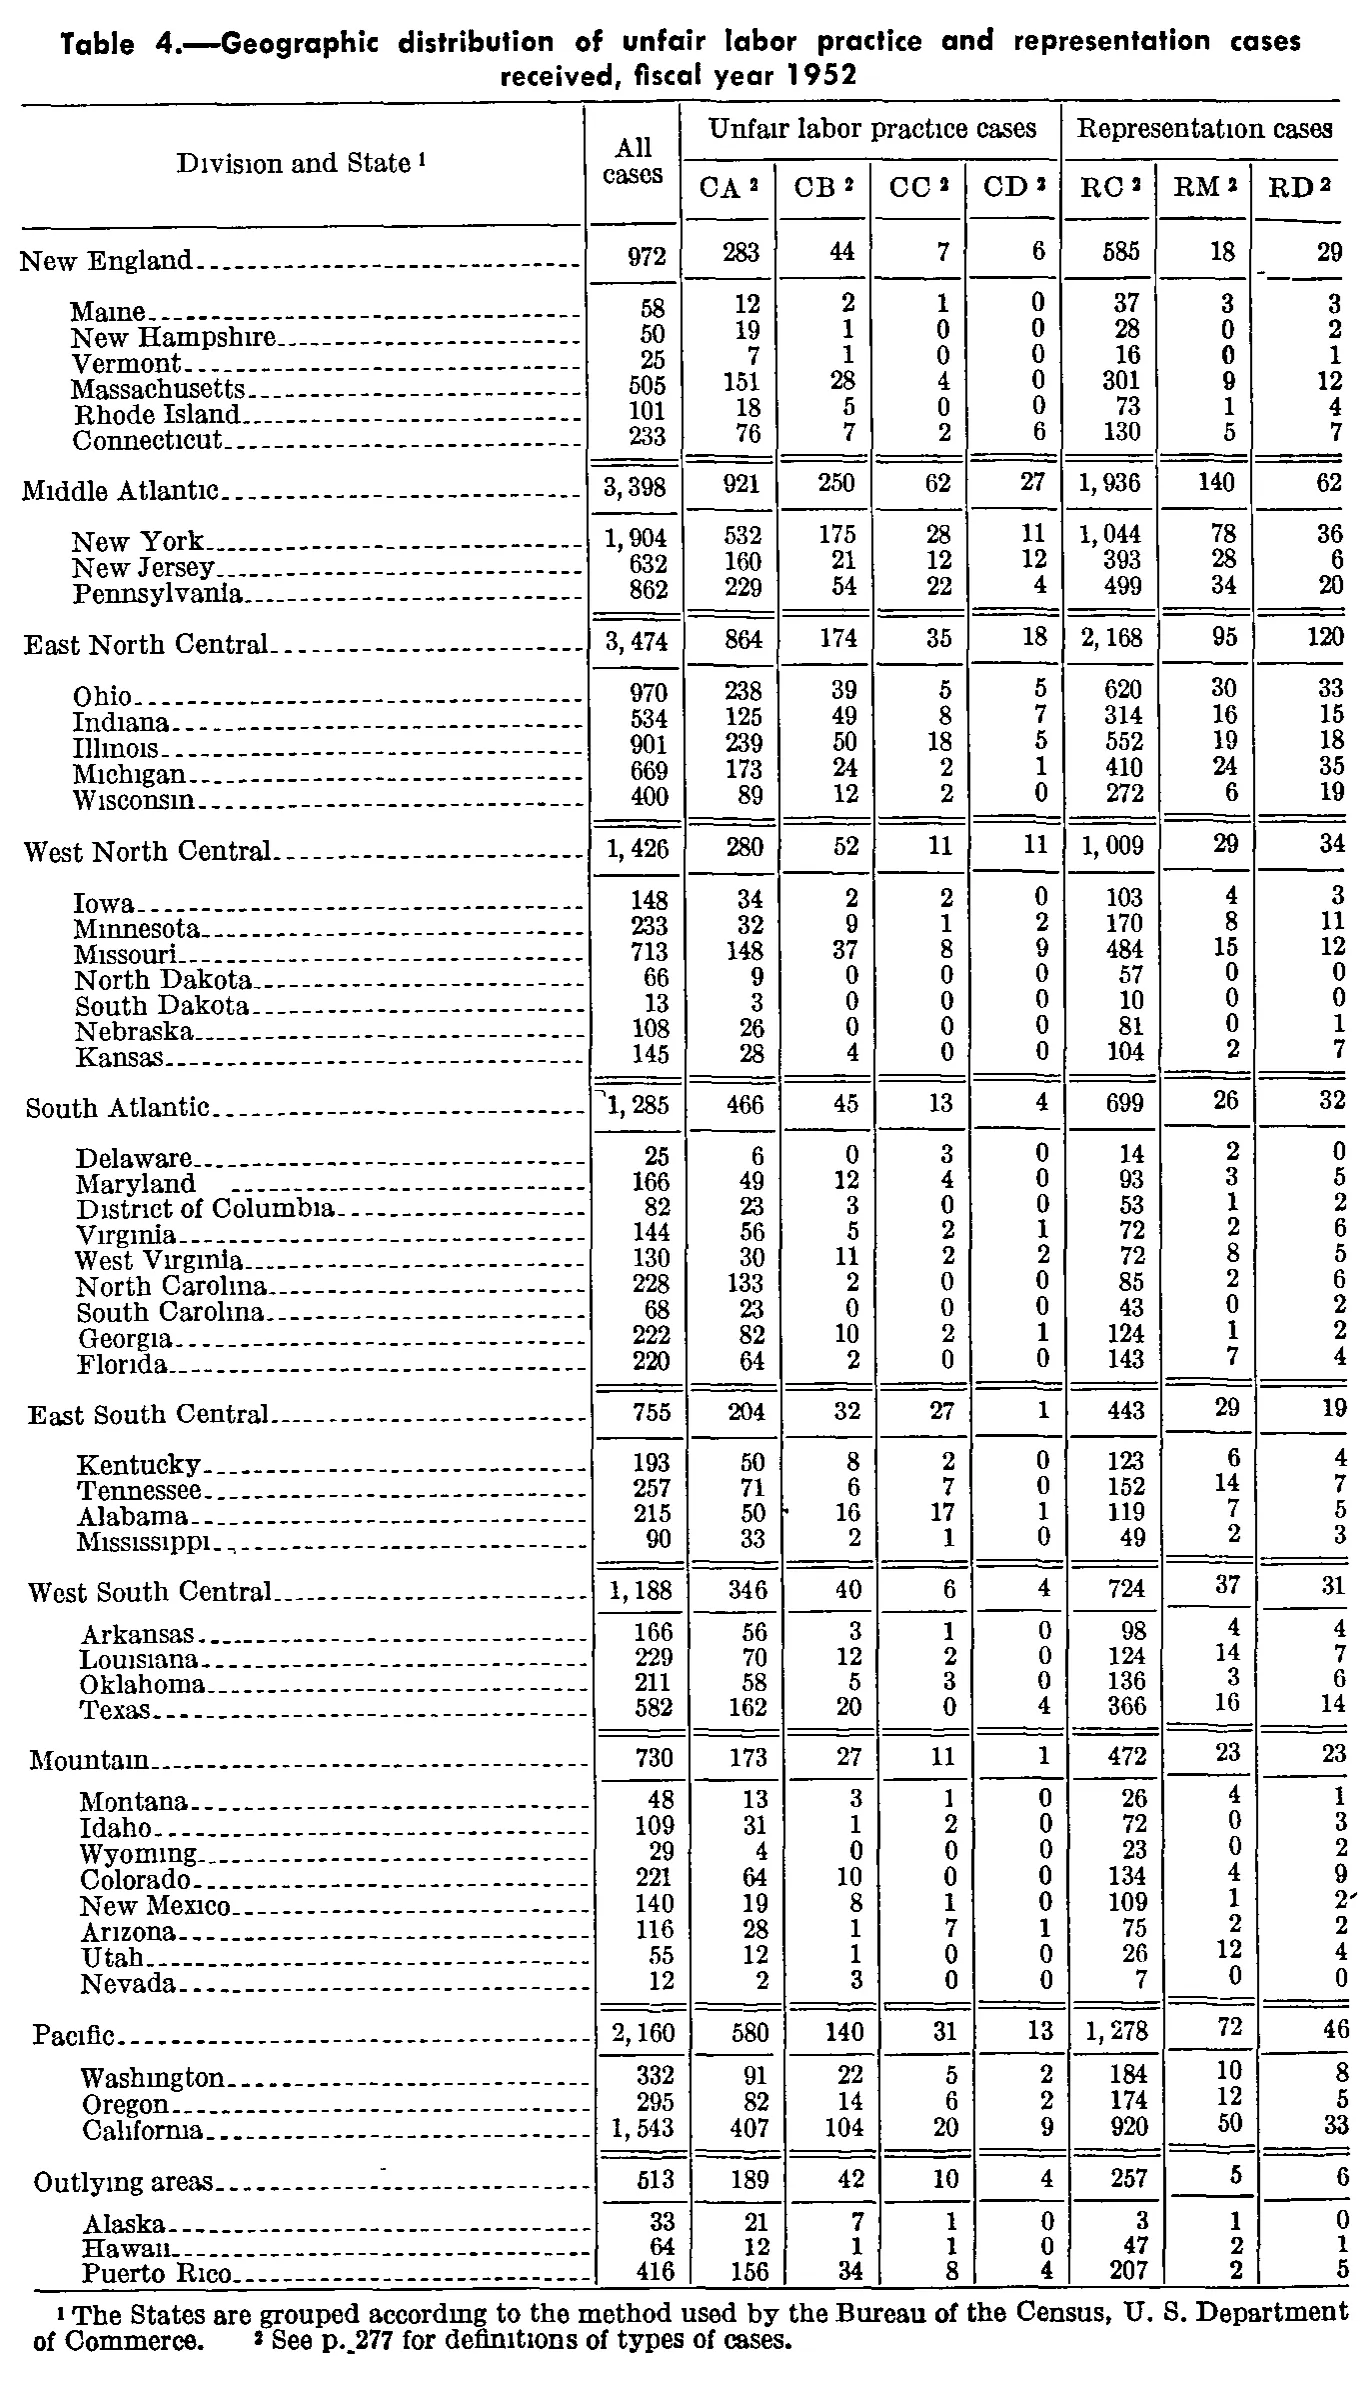
Geographic distribution of unfair labor practice and representation cases received, fiscal year 1952
| Division and State | All cases | Unfair labor practice cases | Representation cases | |||||
|---|---|---|---|---|---|---|---|---|
| Division and State | All cases | CA | CB | CC | CD | RC | RM | RD |
| New England | 972 | 283 | 44 | 7 | 6 | 585 | 18 | 29 |
| Maine | 58 | 12 | 2 | 1 | 0 | 37 | 3 | 3 |
| New Hampshire | 50 | 19 | 1 | 0 | 0 | 28 | 0 | 2 |
| Vermont | 25 | 7 | 1 | 0 | 0 | 16 | 0 | 1 |
| Massachusetts | 505 | 151 | 28 | 4 | 0 | 301 | 9 | 12 |
| Rhode Island | 101 | 18 | 5 | 0 | 0 | 73 | 1 | 4 |
| Connecticut | 233 | 76 | 7 | 2 | 6 | 130 | 5 | 7 |
| Middle Atlantic | 3,398 | 921 | 250 | 62 | 27 | 1,936 | 140 | 62 |
| New York | 1,904 | 532 | 175 | 28 | 11 | 1,044 | 78 | 36 |
| New Jersey | 632 | 160 | 21 | 12 | 12 | 393 | 28 | 6 |
| Pennsylvania | 862 | 229 | 54 | 22 | 4 | 499 | 34 | 20 |
| East North Central | 3,474 | 864 | 174 | 35 | 18 | 2,168 | 95 | 120 |
| Ohio | 970 | 238 | 39 | 5 | 5 | 620 | 30 | 33 |
| Indiana | 534 | 125 | 49 | 8 | 7 | 314 | 16 | 15 |
| Illinois | 901 | 239 | 50 | 18 | 5 | 552 | 19 | 18 |
| Michigan | 669 | 173 | 24 | 2 | 1 | 410 | 24 | 35 |
| Wisconsin | 400 | 89 | 12 | 2 | 0 | 272 | 6 | 19 |
| West North Central | 1,426 | 280 | 52 | 11 | 11 | 1,009 | 29 | 34 |
| Iowa | 148 | 34 | 2 | 2 | 0 | 103 | 4 | 3 |
| Minnesota | 233 | 32 | 9 | 1 | 2 | 170 | 8 | 11 |
| Missouri | 713 | 148 | 37 | 8 | 9 | 484 | 15 | 12 |
| North Dakota | 66 | 9 | 0 | 0 | 0 | 57 | 0 | 0 |
| South Dakota | 13 | 3 | 0 | 0 | 0 | 10 | 0 | 0 |
| Nebraska | 108 | 26 | 0 | 0 | 0 | 81 | 0 | 1 |
| Kansas | 145 | 28 | 4 | 0 | 0 | 104 | 2 | 7 |
| South Atlantic | 1,285 | 466 | 45 | 13 | 4 | 699 | 26 | 32 |
| Delaware | 25 | 6 | 0 | 3 | 0 | 14 | 2 | 0 |
| Maryland | 166 | 49 | 12 | 4 | 0 | 93 | 3 | 5 |
| District of Columbia | 82 | 23 | 3 | 0 | 0 | 53 | 1 | 2 |
| Virginia | 144 | 56 | 5 | 2 | 1 | 72 | 2 | 6 |
| West Virginia | 130 | 30 | 11 | 2 | 2 | 72 | 8 | 5 |
| North Carolina | 228 | 133 | 2 | 0 | 0 | 85 | 2 | 6 |
| South Carolina | 68 | 23 | 0 | 0 | 0 | 43 | 0 | 2 |
| Georgia | 222 | 82 | 10 | 2 | 1 | 124 | 1 | 2 |
| Florida | 220 | 64 | 2 | 0 | 0 | 143 | 7 | 4 |
| East South Central | 755 | 204 | 32 | 27 | 1 | 443 | 29 | 19 |
| Kentucky | 193 | 50 | 8 | 2 | 0 | 123 | 6 | 4 |
| Tennessee | 257 | 71 | 6 | 7 | 0 | 152 | 14 | 7 |
| Alabama | 215 | 50 | 16 | 17 | 1 | 119 | 7 | 5 |
| Mississippi | 90 | 33 | 2 | 1 | 0 | 49 | 2 | 3 |
| West South Central | 1,188 | 346 | 40 | 6 | 4 | 724 | 37 | 31 |
| Arkansas | 166 | 56 | 3 | 1 | 0 | 98 | 4 | 4 |
| Louisiana | 229 | 70 | 12 | 2 | 0 | 124 | 14 | 7 |
| Oklahoma | 211 | 58 | 5 | 3 | 0 | 136 | 3 | 6 |
| Texas | 582 | 162 | 20 | 0 | 4 | 366 | 16 | 14 |
| Mountain | 730 | 173 | 27 | 11 | 1 | 472 | 23 | 23 |
| Montana | 48 | 13 | 3 | 1 | 0 | 26 | 4 | 1 |
| Idaho | 109 | 31 | 1 | 2 | 0 | 72 | 0 | 3 |
| Wyoming | 29 | 4 | 0 | 0 | 0 | 23 | 0 | 2 |
| Colorado | 221 | 64 | 10 | 0 | 0 | 134 | 4 | 9 |
| New Mexico | 140 | 19 | 8 | 1 | 0 | 109 | 1 | 2 |
| Arizona | 116 | 28 | 1 | 7 | 1 | 75 | 2 | 2 |
| Utah | 55 | 12 | 1 | 0 | 0 | 26 | 12 | 4 |
| Nevada | 12 | 2 | 3 | 0 | 0 | 7 | 0 | 0 |
| Pacific | 2,160 | 580 | 140 | 31 | 13 | 1,278 | 72 | 46 |
| Washington | 332 | 91 | 22 | 5 | 2 | 184 | 10 | 8 |
| Oregon | 295 | 82 | 14 | 6 | 2 | 174 | 12 | 5 |
| California | 1,543 | 407 | 104 | 20 | 9 | 920 | 50 | 33 |
| Outlying areas | 513 | 189 | 42 | 10 | 4 | 257 | 5 | 6 |
| Alaska | 33 | 21 | 7 | 1 | 0 | 3 | 1 | 0 |
| Hawaii | 64 | 12 | 1 | 1 | 0 | 47 | 2 | 1 |
| Puerto Rico | 416 | 156 | 34 | 8 | 4 | 207 | 2 | 5 |
- 1 The States are grouped according to the method used by the Bureau of the Census, U. S. Department of Commerce.
- 2 See p. 277 for definitions of types of cases.
427 of 428 figures sit in a row or column sum that works out. 2 cells break a sum: 'Washington', column 2: prints 332, columns 3 to 9 add to 322; 'Pacific', column 2: prints 2,160, rows 'Washington' to 'California' add to 2,170.
Reader’s notes
p. 295. Nine columns: stub, "All cases", then four unfair-labor-practice columns (CA, CB, CC, CD) and three representation columns (RC, RM, RD). The table has no grand-total row; it begins directly with the New England division line. Division rows (New England, Middle Atlantic, etc.) are the sums of the indented State rows that follow them, and "Outlying areas" is the last such group. Arithmetic check: every State row's seven case-type cells add to its printed "All cases" value, and every division line equals both the sum of its States and the sum of its own case-type cells — with one exception. Washington: I read "All cases" as 332, but 91+22+5+2+184+10+8 = 322, and the Pacific division total of 2,160 is consistent with 322 (322+295+1,543 = 2,160) rather than with 332. So either the source misprints 332 for 322, or the second digit in this 1-bit scan is a 2 that reads as a 3 at the available resolution. I transcribed the characters as they appear; treat this one cell as doubtful. Minor rendering artifacts that are not part of the data: a stray tick after the "16" in Alabama's CB column, an apostrophe-like mark after New Mexico's RD value "2", and a leading flick before the South Atlantic total "1,285" — all read as print noise or column rules, not footnote markers or digits. Raised "1" on the stub heading and raised "2" on each case-type heading are footnote markers, recorded with carets.
Source image
Source data: U.S. NLRB Annual Reports (public domain). Reconstruction by NLRB Stats Archive. Read by claude-opus-5 (effort max, prompt extract_v1) from the 300-dpi scan; stitched by page. Updated October 2026.