NLRB Stats Archive › Annual Reports › FY1951 › Geographic distribution of union-shop authorization polls, outcome, eligible voters, and valid votes cast during fiscal year 1951
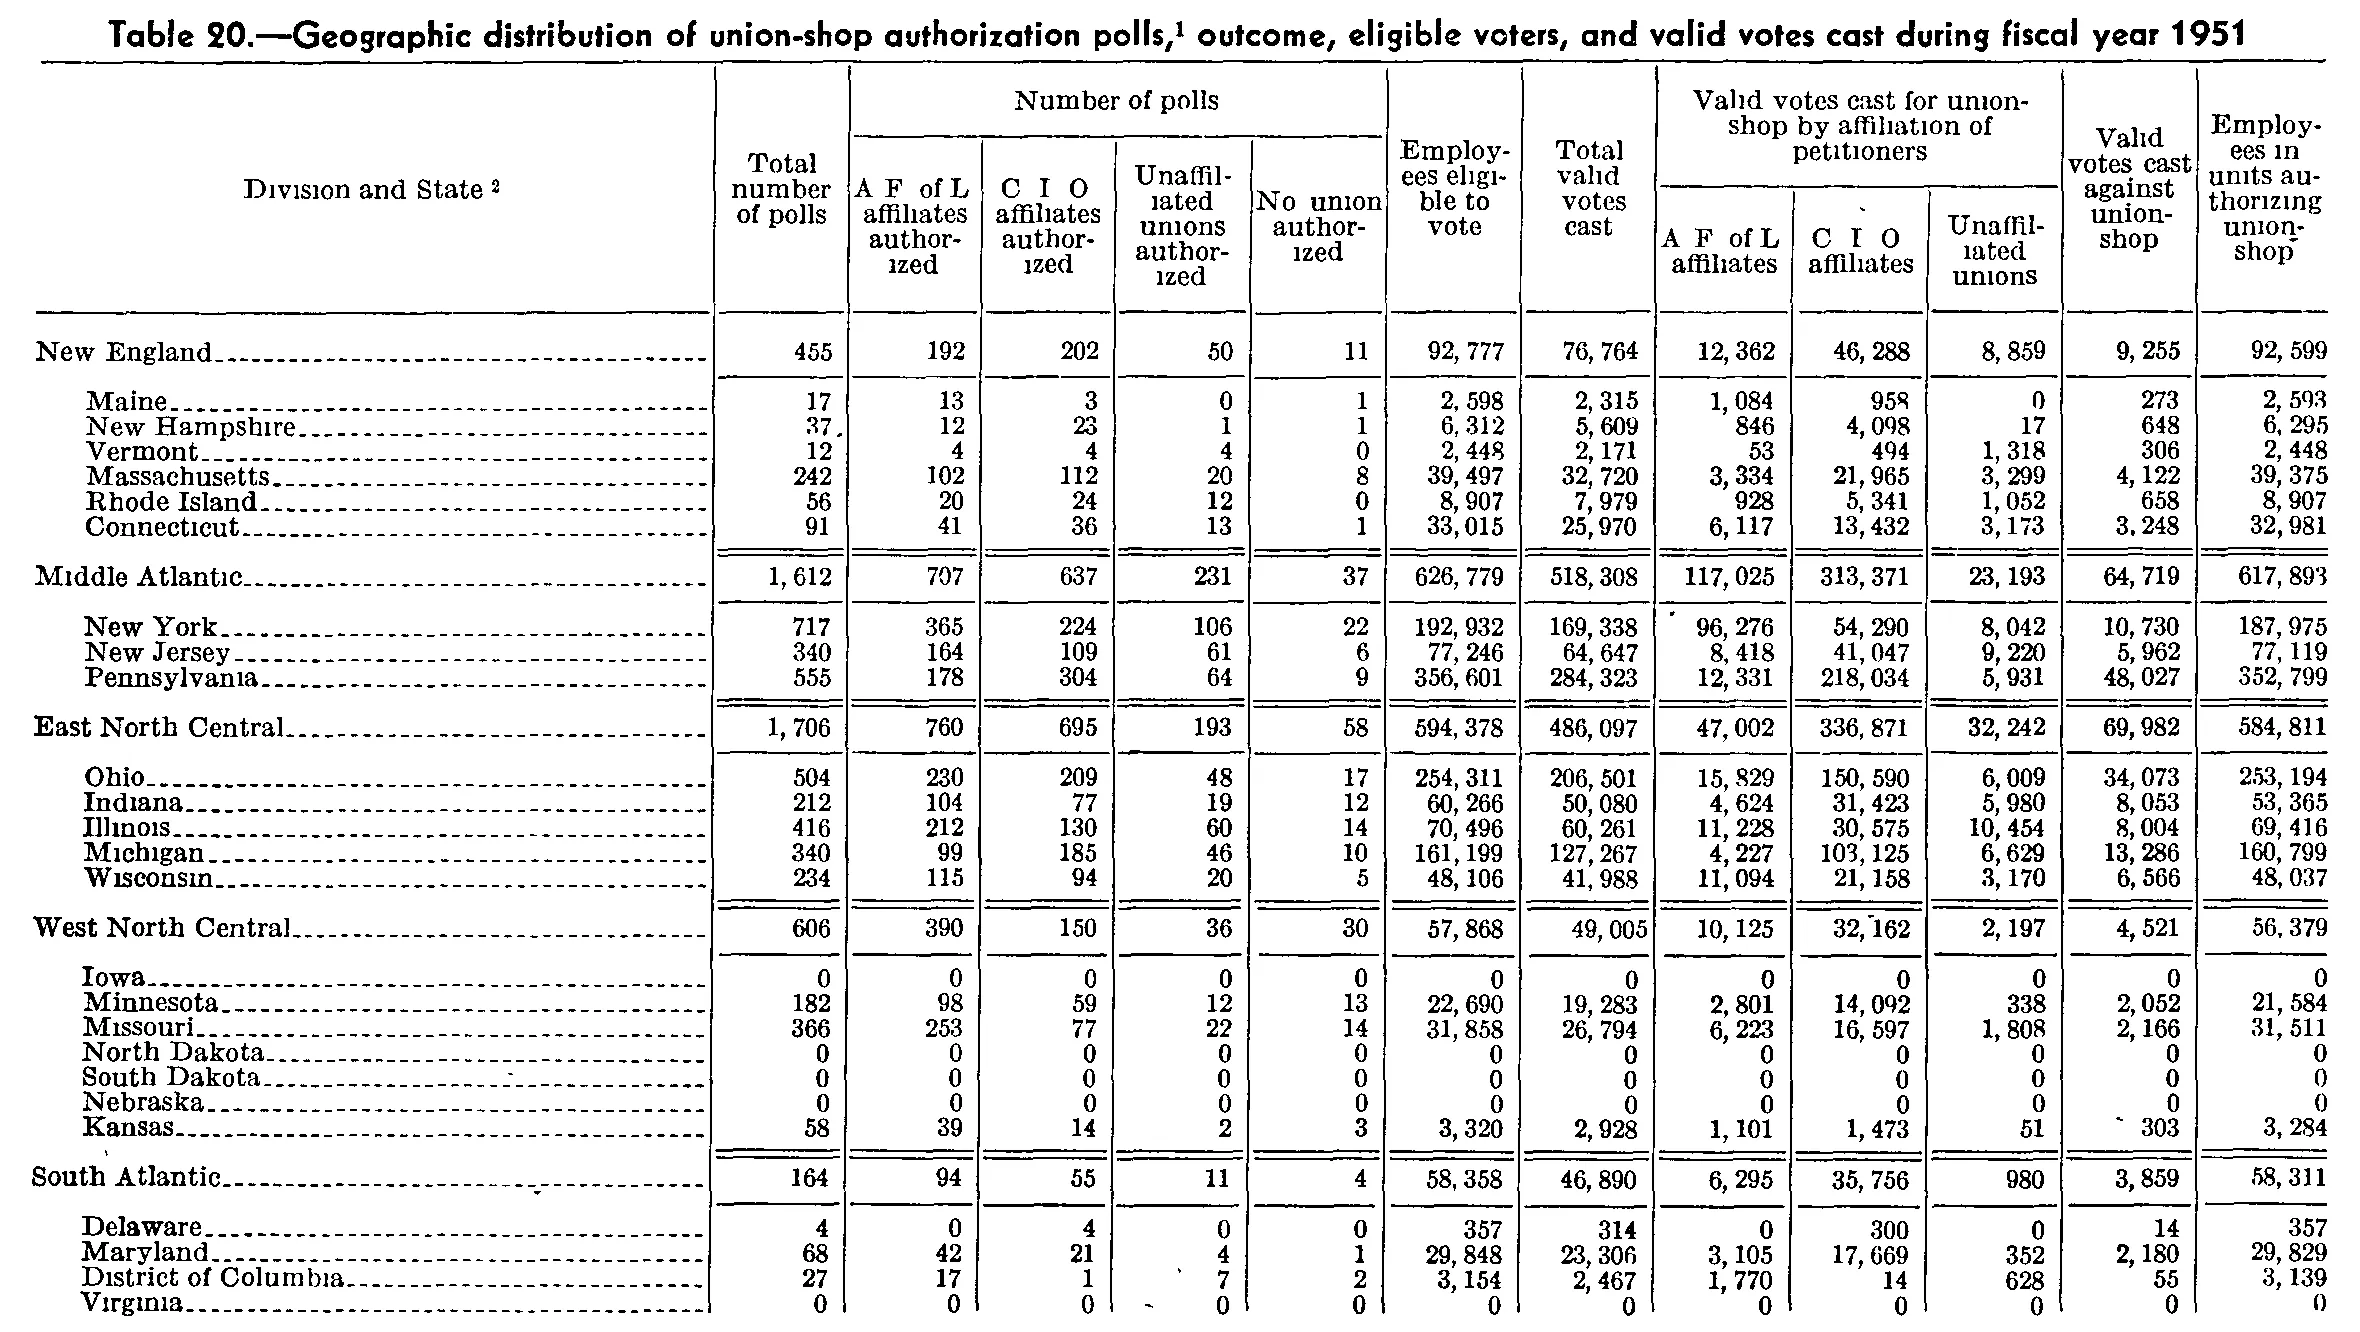
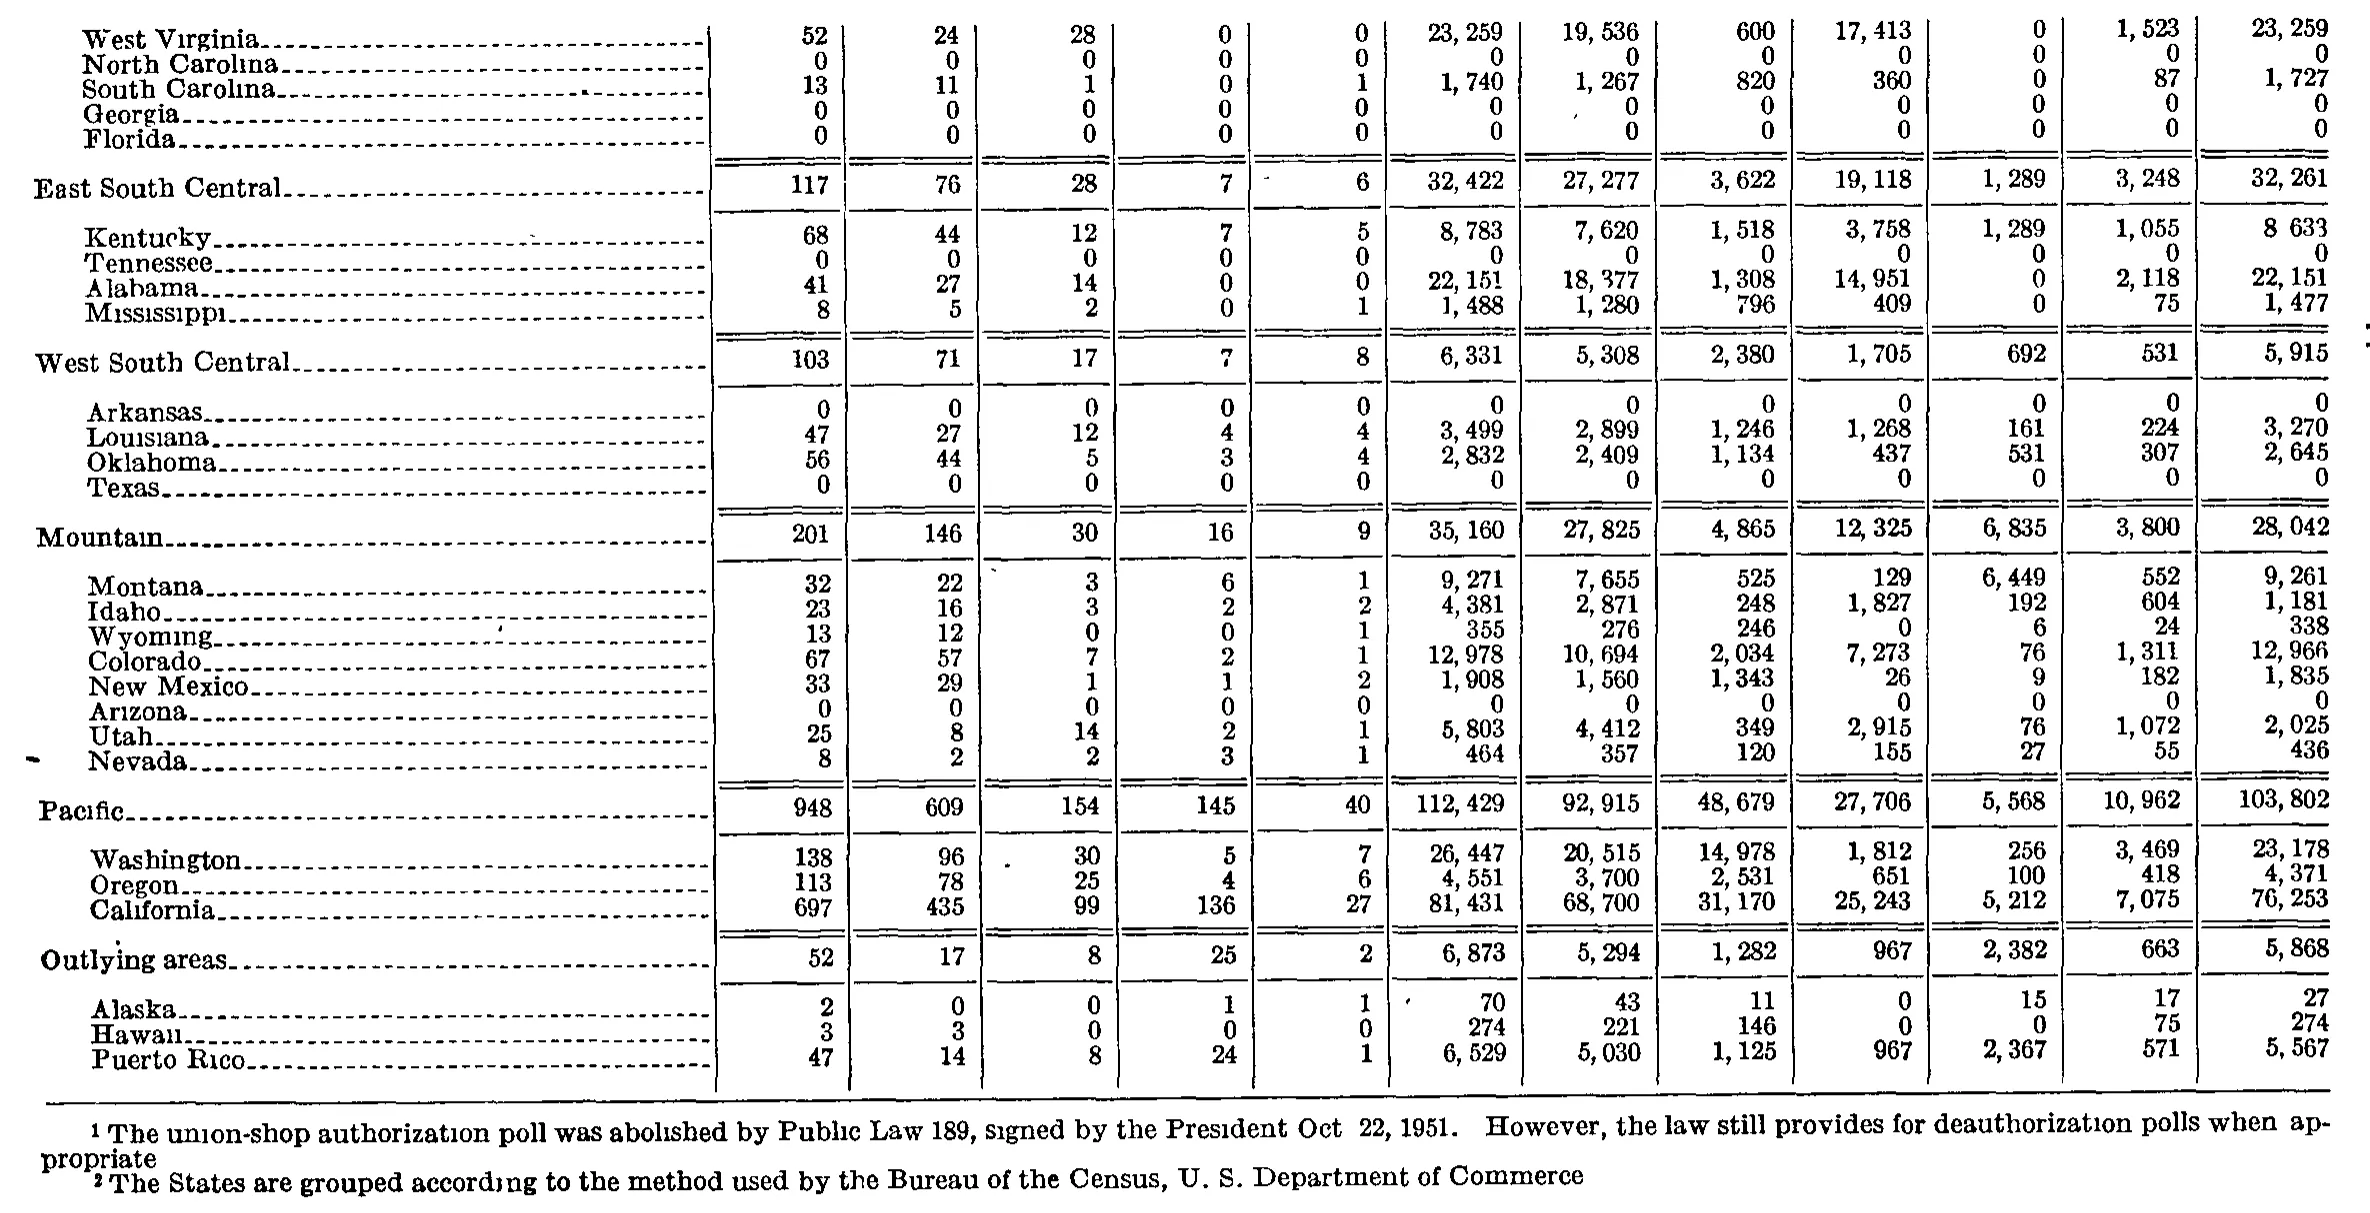
Geographic distribution of union-shop authorization polls, outcome, eligible voters, and valid votes cast during fiscal year 1951
Stitched from pp. 327–328.
| Division and State | Total number of polls | Number of polls | Employees eligible to vote | Total valid votes cast | Valid votes cast for union-shop by affiliation of petitioners | Valid votes cast against union-shop | Employees in units authorizing union-shop | |||||
|---|---|---|---|---|---|---|---|---|---|---|---|---|
| Division and State | Total number of polls | A F of L affiliates authorized | C I O affiliates authorized | Unaffiliated unions authorized | No union authorized | Employees eligible to vote | Total valid votes cast | A F of L affiliates | C I O affiliates | Unaffiliated unions | Valid votes cast against union-shop | Employees in units authorizing union-shop |
| New England | 455 | 192 | 202 | 50 | 11 | 92,777 | 76,764 | 12,362 | 46,288 | 8,859 | 9,255 | 92,599 |
| Maine | 17 | 13 | 3 | 0 | 1 | 2,598 | 2,315 | 1,084 | 958 | 0 | 273 | 2,593 |
| New Hampshire | 37 | 12 | 23 | 1 | 1 | 6,312 | 5,609 | 846 | 4,098 | 17 | 648 | 6,295 |
| Vermont | 12 | 4 | 4 | 4 | 0 | 2,448 | 2,171 | 53 | 494 | 1,318 | 306 | 2,448 |
| Massachusetts | 242 | 102 | 112 | 20 | 8 | 39,497 | 32,720 | 3,334 | 21,965 | 3,299 | 4,122 | 39,375 |
| Rhode Island | 56 | 20 | 24 | 12 | 0 | 8,907 | 7,979 | 928 | 5,341 | 1,052 | 658 | 8,907 |
| Connecticut | 91 | 41 | 36 | 13 | 1 | 33,015 | 25,970 | 6,117 | 13,432 | 3,173 | 3,248 | 32,981 |
| Middle Atlantic | 1,612 | 707 | 637 | 231 | 37 | 626,779 | 518,308 | 117,025 | 313,371 | 23,193 | 64,719 | 617,893 |
| New York | 717 | 365 | 224 | 106 | 22 | 192,932 | 169,338 | 96,276 | 54,290 | 8,042 | 10,730 | 187,975 |
| New Jersey | 340 | 164 | 109 | 61 | 6 | 77,246 | 64,647 | 8,418 | 41,047 | 9,220 | 5,962 | 77,119 |
| Pennsylvania | 555 | 178 | 304 | 64 | 9 | 356,601 | 284,323 | 12,331 | 218,034 | 5,931 | 48,027 | 352,799 |
| East North Central | 1,706 | 760 | 695 | 193 | 58 | 594,378 | 486,097 | 47,002 | 336,871 | 32,242 | 69,982 | 584,811 |
| Ohio | 504 | 230 | 209 | 48 | 17 | 254,311 | 206,501 | 15,829 | 150,590 | 6,009 | 34,073 | 253,194 |
| Indiana | 212 | 104 | 77 | 19 | 12 | 60,266 | 50,080 | 4,624 | 31,423 | 5,980 | 8,053 | 53,365 |
| Illinois | 416 | 212 | 130 | 60 | 14 | 70,496 | 60,261 | 11,228 | 30,575 | 10,454 | 8,004 | 69,416 |
| Michigan | 340 | 99 | 185 | 46 | 10 | 161,199 | 127,267 | 4,227 | 103,125 | 6,629 | 13,286 | 160,799 |
| Wisconsin | 234 | 115 | 94 | 20 | 5 | 48,106 | 41,988 | 11,094 | 21,158 | 3,170 | 6,566 | 48,037 |
| West North Central | 606 | 390 | 150 | 36 | 30 | 57,868 | 49,005 | 10,125 | 32,162 | 2,197 | 4,521 | 56,379 |
| Iowa | 0 | 0 | 0 | 0 | 0 | 0 | 0 | 0 | 0 | 0 | 0 | 0 |
| Minnesota | 182 | 98 | 59 | 12 | 13 | 22,690 | 19,283 | 2,801 | 14,092 | 338 | 2,052 | 21,584 |
| Missouri | 366 | 253 | 77 | 22 | 14 | 31,858 | 26,794 | 6,223 | 16,597 | 1,808 | 2,166 | 31,511 |
| North Dakota | 0 | 0 | 0 | 0 | 0 | 0 | 0 | 0 | 0 | 0 | 0 | 0 |
| South Dakota | 0 | 0 | 0 | 0 | 0 | 0 | 0 | 0 | 0 | 0 | 0 | 0 |
| Nebraska | 0 | 0 | 0 | 0 | 0 | 0 | 0 | 0 | 0 | 0 | 0 | 0 |
| Kansas | 58 | 39 | 14 | 2 | 3 | 3,320 | 2,928 | 1,101 | 1,473 | 51 | 303 | 3,284 |
| South Atlantic | 164 | 94 | 55 | 11 | 4 | 58,358 | 46,890 | 6,295 | 35,756 | 980 | 3,859 | 58,311 |
| Delaware | 4 | 0 | 4 | 0 | 0 | 357 | 314 | 0 | 300 | 0 | 14 | 357 |
| Maryland | 68 | 42 | 21 | 4 | 1 | 29,848 | 23,306 | 3,105 | 17,669 | 352 | 2,180 | 29,829 |
| District of Columbia | 27 | 17 | 1 | 7 | 2 | 3,154 | 2,467 | 1,770 | 14 | 628 | 55 | 3,139 |
| Virginia | 0 | 0 | 0 | 0 | 0 | 0 | 0 | 0 | 0 | 0 | 0 | 0 |
| West Virginia | 52 | 24 | 28 | 0 | 0 | 23,259 | 19,536 | 600 | 17,413 | 0 | 1,523 | 23,259 |
| North Carolina | 0 | 0 | 0 | 0 | 0 | 0 | 0 | 0 | 0 | 0 | 0 | 0 |
| South Carolina | 13 | 11 | 1 | 0 | 1 | 1,740 | 1,267 | 820 | 360 | 0 | 87 | 1,727 |
| Georgia | 0 | 0 | 0 | 0 | 0 | 0 | 0 | 0 | 0 | 0 | 0 | 0 |
| Florida | 0 | 0 | 0 | 0 | 0 | 0 | 0 | 0 | 0 | 0 | 0 | 0 |
| East South Central | 117 | 76 | 28 | 7 | 6 | 32,422 | 27,277 | 3,622 | 19,118 | 1,289 | 3,248 | 32,261 |
| Kentucky | 68 | 44 | 12 | 7 | 5 | 8,783 | 7,620 | 1,518 | 3,758 | 1,289 | 1,055 | 8,633 |
| Tennessee | 0 | 0 | 0 | 0 | 0 | 0 | 0 | 0 | 0 | 0 | 0 | 0 |
| Alabama | 41 | 27 | 14 | 0 | 0 | 22,151 | 18,377 | 1,308 | 14,951 | 0 | 2,118 | 22,151 |
| Mississippi | 8 | 5 | 2 | 0 | 1 | 1,488 | 1,280 | 796 | 409 | 0 | 75 | 1,477 |
| West South Central | 103 | 71 | 17 | 7 | 8 | 6,331 | 5,308 | 2,380 | 1,705 | 692 | 531 | 5,915 |
| Arkansas | 0 | 0 | 0 | 0 | 0 | 0 | 0 | 0 | 0 | 0 | 0 | 0 |
| Louisiana | 47 | 27 | 12 | 4 | 4 | 3,499 | 2,899 | 1,246 | 1,268 | 161 | 224 | 3,270 |
| Oklahoma | 56 | 44 | 5 | 3 | 4 | 2,832 | 2,409 | 1,134 | 437 | 531 | 307 | 2,645 |
| Texas | 0 | 0 | 0 | 0 | 0 | 0 | 0 | 0 | 0 | 0 | 0 | 0 |
| Mountain | 201 | 146 | 30 | 16 | 9 | 35,160 | 27,825 | 4,865 | 12,325 | 6,835 | 3,800 | 28,042 |
| Montana | 32 | 22 | 3 | 6 | 1 | 9,271 | 7,655 | 525 | 129 | 6,449 | 552 | 9,261 |
| Idaho | 23 | 16 | 3 | 2 | 2 | 4,381 | 2,871 | 248 | 1,827 | 192 | 604 | 1,181 |
| Wyoming | 13 | 12 | 0 | 0 | 1 | 355 | 276 | 246 | 0 | 6 | 24 | 338 |
| Colorado | 67 | 57 | 7 | 2 | 1 | 12,978 | 10,694 | 2,034 | 7,273 | 76 | 1,311 | 12,966 |
| New Mexico | 33 | 29 | 1 | 1 | 2 | 1,908 | 1,560 | 1,343 | 26 | 9 | 182 | 1,835 |
| Arizona | 0 | 0 | 0 | 0 | 0 | 0 | 0 | 0 | 0 | 0 | 0 | 0 |
| Utah | 25 | 8 | 14 | 2 | 1 | 5,803 | 4,412 | 349 | 2,915 | 76 | 1,072 | 2,025 |
| Nevada | 8 | 2 | 2 | 3 | 1 | 464 | 357 | 120 | 155 | 27 | 55 | 436 |
| Pacific | 948 | 609 | 154 | 145 | 40 | 112,429 | 92,915 | 48,679 | 27,706 | 5,568 | 10,962 | 103,802 |
| Washington | 138 | 96 | 30 | 5 | 7 | 26,447 | 20,515 | 14,978 | 1,812 | 256 | 3,469 | 23,178 |
| Oregon | 113 | 78 | 25 | 4 | 6 | 4,551 | 3,700 | 2,531 | 651 | 100 | 418 | 4,371 |
| California | 697 | 435 | 99 | 136 | 27 | 81,431 | 68,700 | 31,170 | 25,243 | 5,212 | 7,075 | 76,253 |
| Outlying areas | 52 | 17 | 8 | 25 | 2 | 6,873 | 5,294 | 1,282 | 967 | 2,382 | 663 | 5,868 |
| Alaska | 2 | 0 | 0 | 1 | 1 | 70 | 43 | 11 | 0 | 15 | 17 | 27 |
| Hawaii | 3 | 3 | 0 | 0 | 0 | 274 | 221 | 146 | 0 | 0 | 75 | 274 |
| Puerto Rico | 47 | 14 | 8 | 24 | 1 | 6,529 | 5,030 | 1,125 | 967 | 2,367 | 571 | 5,567 |
- 1 The union-shop authorization poll was abolished by Public Law 189, signed by the President Oct. 22, 1951. However, the law still provides for deauthorization polls when appropriate.
- 2 The States are grouped according to the method used by the Bureau of the Census, U. S. Department of Commerce.
570 of 570 figures sit in a row or column sum that works out.
Reader’s notes
p. 327. The crop ends mid-table: the South Atlantic section is cut off after Virginia (its division total of 164 polls implies further states follow on the next page), and no footnote texts are printed on this image, so `footnotes` is empty even though markers 1 (caption), 2 (stub heading) and 3 (last column heading) are referenced. The Virginia row sits on the bottom crop edge and its glyphs are clipped; I read zeros across the row, but the final cell (Employees in units authorizing union-shop) is the least legible and was read as 0 by inference from the rest of the row — treat that one cell as doubtful. The raised marker after "union-shop" in the last column heading is faint at this resolution; I read it as a superscript 3. In the stub, "New Hampshire" is followed by a stray leader-dot that abuts the figure 37 in the Total-number-of-polls column; the value is 37. All division totals (New England, Middle Atlantic, East North Central, West North Central) sum exactly to their listed states in all 12 numeric columns, and in every state row AFL + CIO + Unaffiliated + Against equals Total valid votes cast, so no misprints are apparent in the transcribed portion.
p. 328. This crop is a continuation page: no column headings are printed on it, so header_rows is empty. The grid has 13 columns (stub plus 12 data columns), counted from the column rules. The first five rows (West Virginia through Florida) are the tail of a region group (South Atlantic) whose subtotal line falls on the preceding page and is therefore not in this crop. Kentucky, last column: the digit-grouping comma did not print or did not survive the scan, so the cell reads "8 633" on the page; transcribed as "8,633". The East South Central subtotal for that column (32,261) equals 8,633 + 0 + 22,151 + 1,477, confirming the value. Every subtotal row in the crop (East South Central, West South Central, Mountain, Pacific, Outlying areas) was checked against the sum of its component state rows in all 12 data columns, and all agree with the printed totals. No misprints found in the body. A few stray specks appear in the scan (a mark right of the "7" in the East South Central row, a mark left of the "70" in the Alaska row, a mark above the "3" in Montana's third column, and a short dash in the left margin by the Utah row); these are scan artifacts, not footnote markers or digits, and were not transcribed. Terminal periods on the two footnotes and after "Oct" are faint or dropped in this 1-bit scan; they are rendered as standard sentence punctuation above.
Source image
Source data: U.S. NLRB Annual Reports (public domain). Reconstruction by NLRB Stats Archive. Read by claude-opus-5 (effort max, prompt extract_v1) from the 300-dpi scan; stitched by page. Updated October 2026.