NLRB Stats Archive › Annual Reports › FY1951 › Geographic distribution of decertification elections, eligible voters, and number of votes cast for participating unions, during fiscal year 1951
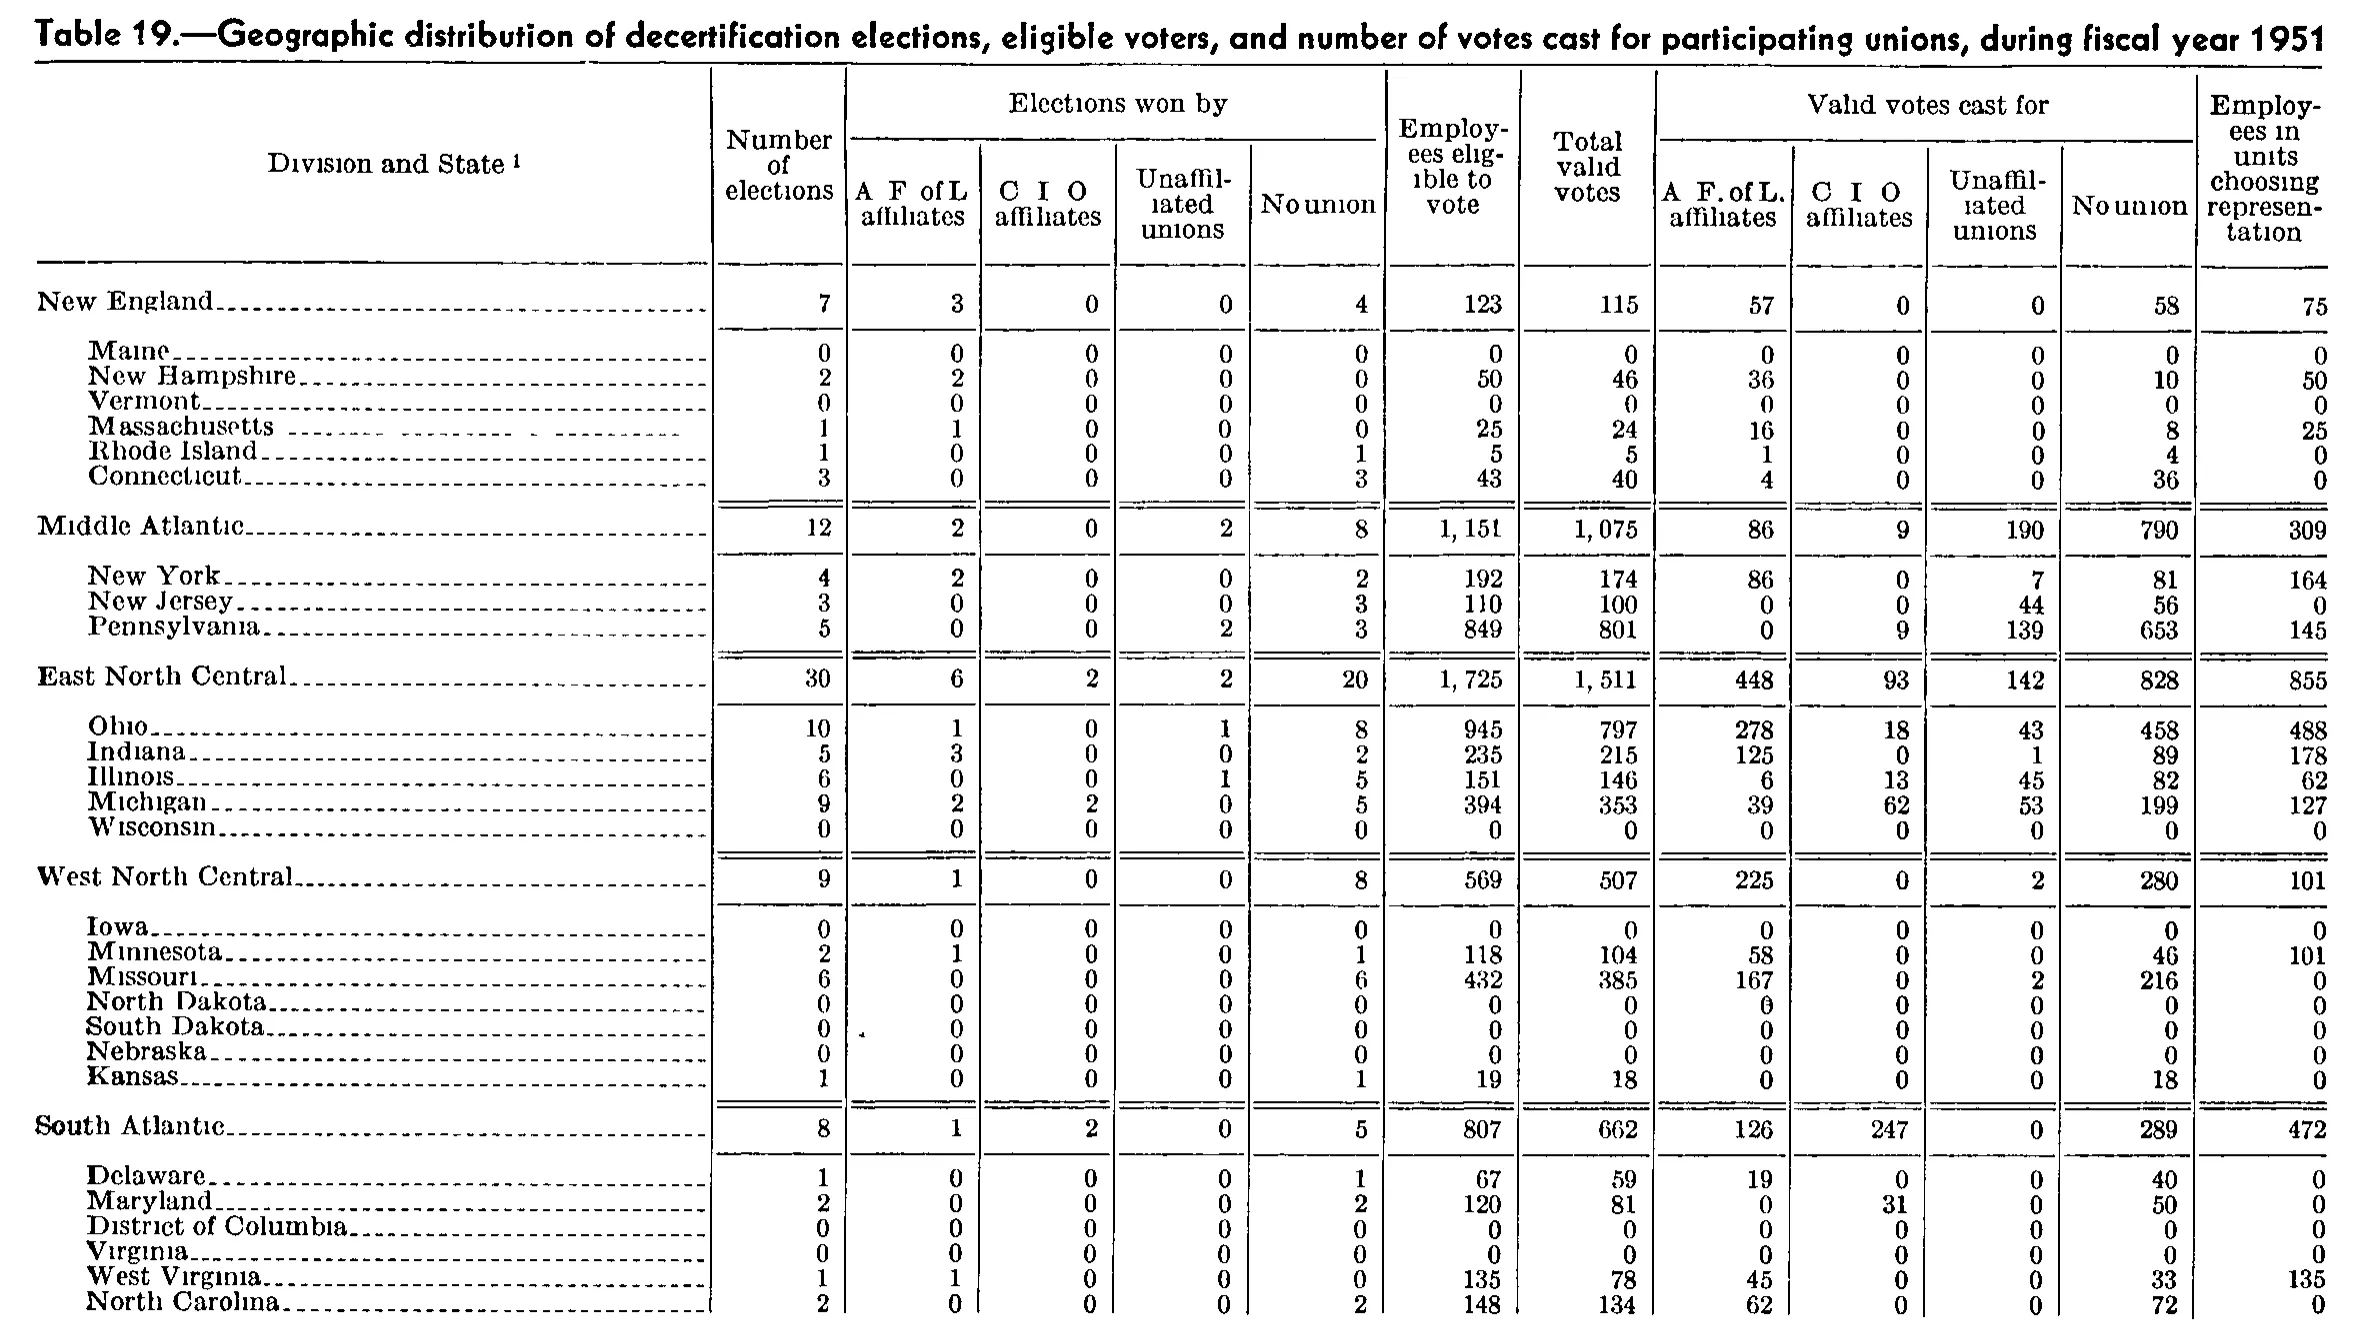
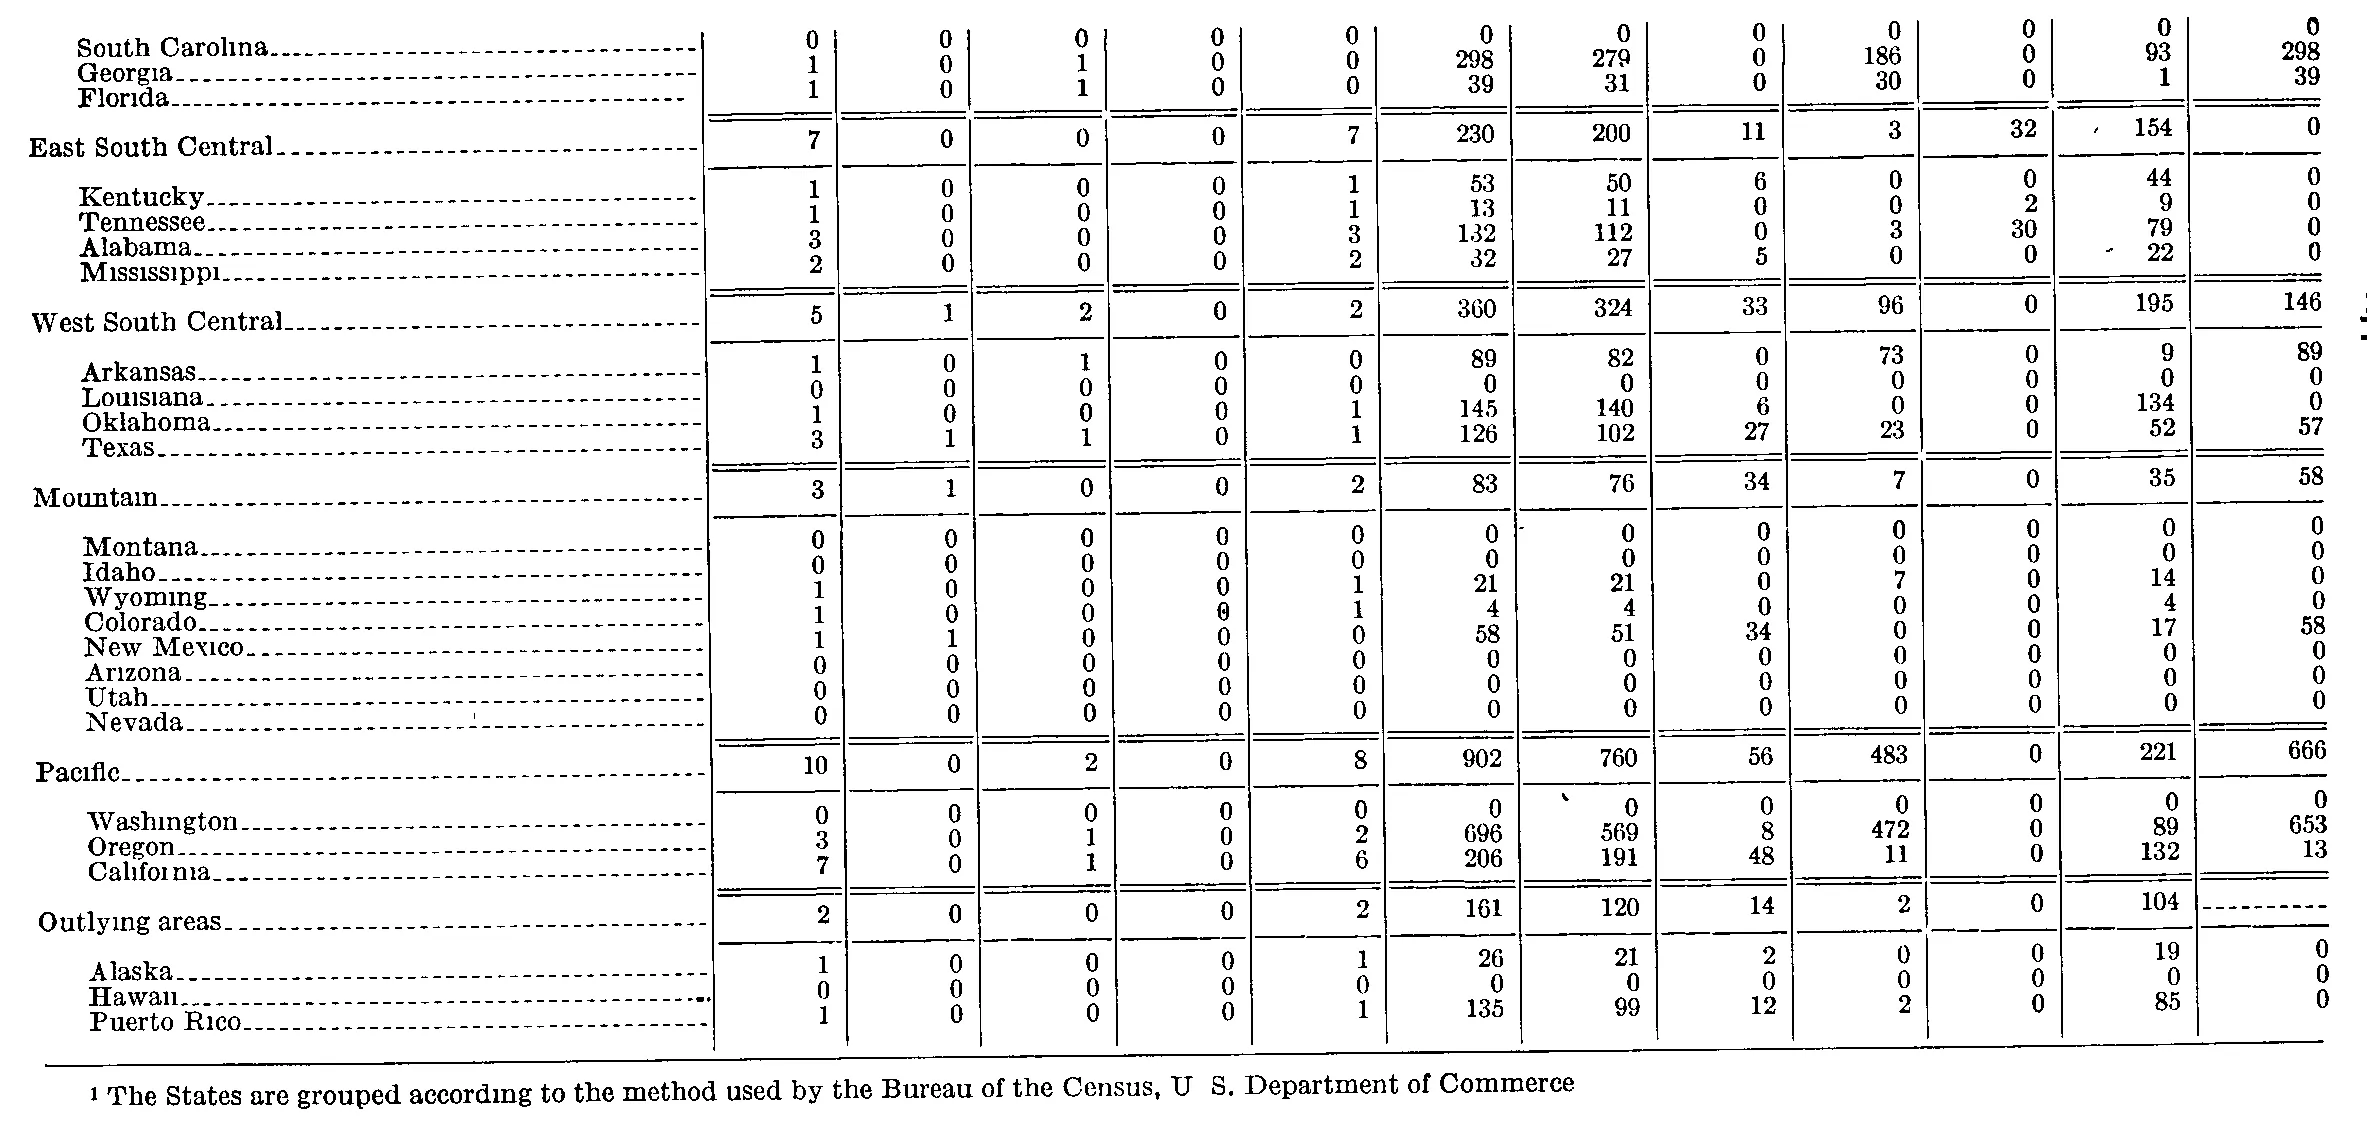
Geographic distribution of decertification elections, eligible voters, and number of votes cast for participating unions, during fiscal year 1951
Stitched from pp. 325–326.
| Division and State | Number of elections | Elections won by | Employees eligible to vote | Total valid votes | Valid votes cast for | Employees in units choosing representation | ||||||
|---|---|---|---|---|---|---|---|---|---|---|---|---|
| Division and State | Number of elections | A F of L affiliates | C I O affiliates | Unaffiliated unions | No union | Employees eligible to vote | Total valid votes | A F. of L. affiliates | C I O affiliates | Unaffiliated unions | No union | Employees in units choosing representation |
| New England | 7 | 3 | 0 | 0 | 4 | 123 | 115 | 57 | 0 | 0 | 58 | 75 |
| Maine | 0 | 0 | 0 | 0 | 0 | 0 | 0 | 0 | 0 | 0 | 0 | 0 |
| New Hampshire | 2 | 2 | 0 | 0 | 0 | 50 | 46 | 36 | 0 | 0 | 10 | 50 |
| Vermont | 0 | 0 | 0 | 0 | 0 | 0 | 0 | 0 | 0 | 0 | 0 | 0 |
| Massachusetts | 1 | 1 | 0 | 0 | 0 | 25 | 24 | 16 | 0 | 0 | 8 | 25 |
| Rhode Island | 1 | 0 | 0 | 0 | 1 | 5 | 5 | 1 | 0 | 0 | 4 | 0 |
| Connecticut | 3 | 0 | 0 | 0 | 3 | 43 | 40 | 4 | 0 | 0 | 36 | 0 |
| Middle Atlantic | 12 | 2 | 0 | 2 | 8 | 1,151 | 1,075 | 86 | 9 | 190 | 790 | 309 |
| New York | 4 | 2 | 0 | 0 | 2 | 192 | 174 | 86 | 0 | 7 | 81 | 164 |
| New Jersey | 3 | 0 | 0 | 0 | 3 | 110 | 100 | 0 | 0 | 44 | 56 | 0 |
| Pennsylvania | 5 | 0 | 0 | 2 | 3 | 849 | 801 | 0 | 9 | 139 | 653 | 145 |
| East North Central | 30 | 6 | 2 | 2 | 20 | 1,725 | 1,511 | 448 | 93 | 142 | 828 | 855 |
| Ohio | 10 | 1 | 0 | 1 | 8 | 945 | 797 | 278 | 18 | 43 | 458 | 488 |
| Indiana | 5 | 3 | 0 | 0 | 2 | 235 | 215 | 125 | 0 | 1 | 89 | 178 |
| Illinois | 6 | 0 | 0 | 1 | 5 | 151 | 146 | 6 | 13 | 45 | 82 | 62 |
| Michigan | 9 | 2 | 2 | 0 | 5 | 394 | 353 | 39 | 62 | 53 | 199 | 127 |
| Wisconsin | 0 | 0 | 0 | 0 | 0 | 0 | 0 | 0 | 0 | 0 | 0 | 0 |
| West North Central | 9 | 1 | 0 | 0 | 8 | 569 | 507 | 225 | 0 | 2 | 280 | 101 |
| Iowa | 0 | 0 | 0 | 0 | 0 | 0 | 0 | 0 | 0 | 0 | 0 | 0 |
| Minnesota | 2 | 1 | 0 | 0 | 1 | 118 | 104 | 58 | 0 | 0 | 46 | 101 |
| Missouri | 6 | 0 | 0 | 0 | 6 | 432 | 385 | 167 | 0 | 2 | 216 | 0 |
| North Dakota | 0 | 0 | 0 | 0 | 0 | 0 | 0 | 0 | 0 | 0 | 0 | 0 |
| South Dakota | 0 | 0 | 0 | 0 | 0 | 0 | 0 | 0 | 0 | 0 | 0 | 0 |
| Nebraska | 0 | 0 | 0 | 0 | 0 | 0 | 0 | 0 | 0 | 0 | 0 | 0 |
| Kansas | 1 | 0 | 0 | 0 | 1 | 19 | 18 | 0 | 0 | 0 | 18 | 0 |
| South Atlantic | 8 | 1 | 2 | 0 | 5 | 807 | 662 | 126 | 247 | 0 | 289 | 472 |
| Delaware | 1 | 0 | 0 | 0 | 1 | 67 | 59 | 19 | 0 | 0 | 40 | 0 |
| Maryland | 2 | 0 | 0 | 0 | 2 | 120 | 81 | 0 | 31 | 0 | 50 | 0 |
| District of Columbia | 0 | 0 | 0 | 0 | 0 | 0 | 0 | 0 | 0 | 0 | 0 | 0 |
| Virginia | 0 | 0 | 0 | 0 | 0 | 0 | 0 | 0 | 0 | 0 | 0 | 0 |
| West Virginia | 1 | 1 | 0 | 0 | 0 | 135 | 78 | 45 | 0 | 0 | 33 | 135 |
| North Carolina | 2 | 0 | 0 | 0 | 2 | 148 | 134 | 62 | 0 | 0 | 72 | 0 |
| South Carolina | 0 | 0 | 0 | 0 | 0 | 0 | 0 | 0 | 0 | 0 | 0 | 0 |
| Georgia | 1 | 0 | 1 | 0 | 0 | 298 | 279 | 0 | 186 | 0 | 93 | 298 |
| Florida | 1 | 0 | 1 | 0 | 0 | 39 | 31 | 0 | 30 | 0 | 1 | 39 |
| East South Central | 7 | 0 | 0 | 0 | 7 | 230 | 200 | 11 | 3 | 32 | 154 | 0 |
| Kentucky | 1 | 0 | 0 | 0 | 1 | 53 | 50 | 6 | 0 | 0 | 44 | 0 |
| Tennessee | 1 | 0 | 0 | 0 | 1 | 13 | 11 | 0 | 0 | 2 | 9 | 0 |
| Alabama | 3 | 0 | 0 | 0 | 3 | 132 | 112 | 0 | 3 | 30 | 79 | 0 |
| Mississippi | 2 | 0 | 0 | 0 | 2 | 32 | 27 | 5 | 0 | 0 | 22 | 0 |
| West South Central | 5 | 1 | 2 | 0 | 2 | 360 | 324 | 33 | 96 | 0 | 195 | 146 |
| Arkansas | 1 | 0 | 1 | 0 | 0 | 89 | 82 | 0 | 73 | 0 | 9 | 89 |
| Louisiana | 0 | 0 | 0 | 0 | 0 | 0 | 0 | 0 | 0 | 0 | 0 | 0 |
| Oklahoma | 1 | 0 | 0 | 0 | 1 | 145 | 140 | 6 | 0 | 0 | 134 | 0 |
| Texas | 3 | 1 | 1 | 0 | 1 | 126 | 102 | 27 | 23 | 0 | 52 | 57 |
| Mountain | 3 | 1 | 0 | 0 | 2 | 83 | 76 | 34 | 7 | 0 | 35 | 58 |
| Montana | 0 | 0 | 0 | 0 | 0 | 0 | 0 | 0 | 0 | 0 | 0 | 0 |
| Idaho | 0 | 0 | 0 | 0 | 0 | 0 | 0 | 0 | 0 | 0 | 0 | 0 |
| Wyoming | 1 | 0 | 0 | 0 | 1 | 21 | 21 | 0 | 7 | 0 | 14 | 0 |
| Colorado | 1 | 0 | 0 | 0 | 1 | 4 | 4 | 0 | 0 | 0 | 4 | 0 |
| New Mexico | 1 | 1 | 0 | 0 | 0 | 58 | 51 | 34 | 0 | 0 | 17 | 58 |
| Arizona | 0 | 0 | 0 | 0 | 0 | 0 | 0 | 0 | 0 | 0 | 0 | 0 |
| Utah | 0 | 0 | 0 | 0 | 0 | 0 | 0 | 0 | 0 | 0 | 0 | 0 |
| Nevada | 0 | 0 | 0 | 0 | 0 | 0 | 0 | 0 | 0 | 0 | 0 | 0 |
| Pacific | 10 | 0 | 2 | 0 | 8 | 902 | 760 | 56 | 483 | 0 | 221 | 666 |
| Washington | 0 | 0 | 0 | 0 | 0 | 0 | 0 | 0 | 0 | 0 | 0 | 0 |
| Oregon | 3 | 0 | 1 | 0 | 2 | 696 | 569 | 8 | 472 | 0 | 89 | 653 |
| California | 7 | 0 | 1 | 0 | 6 | 206 | 191 | 48 | 11 | 0 | 132 | 13 |
| Outlying areas | 2 | 0 | 0 | 0 | 2 | 161 | 120 | 14 | 2 | 0 | 104 | |
| Alaska | 1 | 0 | 0 | 0 | 1 | 26 | 21 | 2 | 0 | 0 | 19 | 0 |
| Hawaii | 0 | 0 | 0 | 0 | 0 | 0 | 0 | 0 | 0 | 0 | 0 | 0 |
| Puerto Rico | 1 | 0 | 0 | 0 | 1 | 135 | 99 | 12 | 2 | 0 | 85 | 0 |
- 1 The States are grouped according to the method used by the Bureau of the Census, U. S. Department of Commerce.
340 of 340 figures sit in a row or column sum that works out.
Reader’s notes
p. 325. The crop is cut off at the bottom: the South Atlantic division is incomplete (its 8 elections are only partly accounted for by the 6 state rows shown, so South Carolina, Georgia and Florida and all later divisions, plus any grand total, are missing), and no footnote text is visible. The stub heading carries a raised 1 ("Division and State^1") but the corresponding footnote falls below the crop, so `footnotes` is empty. Column headings: 13 columns, two heading levels. "Elections won by" spans columns 3-6 and "Valid votes cast for" spans columns 9-12; "Division and State^1", "Number of elections", "Employees eligible to vote", "Total valid votes" and "Employees in units choosing representation" are tall single headings repeated in both levels. The two A F of L subheadings are printed differently: "A F of L affiliates" under "Elections won by" but "A F. of L. affiliates" under "Valid votes cast for"; both are transcribed as printed. Letter-spaced headings ("C I O", "No union") are normalized only for inter-letter spacing, not wording. Doubtful cell: North Dakota, "A F. of L. affiliates" (valid votes cast for) — the glyph is a broken/ink-filled character that reads like a theta; in context with every other North Dakota cell being 0 it is almost certainly a printed 0, transcribed as 0. There is also a small stray ink speck in the left margin of the South Dakota row near the "A F of L affiliates" (elections won by) column; it is not a digit and the cell value is 0. Internal consistency: every division subtotal shown in full (New England, Middle Atlantic, East North Central, West North Central) reconciles exactly with the sum of its state rows across all 12 numeric columns, so no misprints are suspected in the completed sections.
p. 326. Continuation page: no column headings are printed on this crop, so header_rows is empty. The grid has 13 columns (stub + 12 data columns), counted from the column rules. The crop begins mid-table: the first three rows (South Carolina, Georgia, Florida) are the tail of the South Atlantic group, whose group heading/total row falls on the previous page and is not in the crop. Label-to-row alignment: in this scan each row label is printed roughly one-third of a line BELOW the number line it belongs to (drift grows toward the top of the page). The mapping used here was confirmed two ways: (a) every rule-delimited block contains exactly as many printed labels as number lines, and (b) the table's internal arithmetic closes on that mapping — column 1 = columns 2+3+4+5 in every row, column 7 = columns 8+9+10+11 in every row, and each region row equals the column-wise sum of its member states (verified exactly for East South Central, West South Central, Mountain, Pacific and Outlying areas, all twelve columns). Note this makes Washington an all-zero row while Oregon carries 696/569 and California 206/191; that is what is printed and it is required by the Pacific totals. "Outlying areas", last column: printed as a dash rule, transcribed as "" per convention (its three member rows all print 0 there). Stray ink specks that are not characters and were not transcribed: a comma-like mark just left of "154" (East South Central, column 11), a similar mark left of "22" (Mississippi, column 11), and a small mark above the "0" in column 7 of the Washington row. Footnote: the period after "U" in "U. S." is lost in the scan (prints as "U S."), and the terminal period after "Commerce" is faint; both were restored to standard form.
Source image
Source data: U.S. NLRB Annual Reports (public domain). Reconstruction by NLRB Stats Archive. Read by claude-opus-5 (effort max, prompt extract_v1) from the 300-dpi scan; stitched by page. Updated October 2026.